• Home
  • Tools dropdown img
    • Spreadsheet Charts

      • ChartExpo for Google Sheets
      • ChartExpo for Microsoft Excel
    • Power BI Charts

      • Power BI Custom Visuals by ChartExpo
    • Word Cloud

  • Charts dropdown img
    • Chart Category

      • Bar Charts
      • Circle Graphs
      • Column Charts
      • Combo Charts
      • Comparison Charts
      • Line Graphs
      • PPC Charts
      • Sentiment Analysis Charts
      • Survey Charts
    • Chart Type

      • Box and Whisker Plot
      • Clustered Bar Chart
      • Clustered Column Chart
      • Comparison Bar Chart
      • Control Chart
      • CSAT Survey Bar Chart
      • CSAT Survey Chart
      • Dot Plot Chart
      • Double Bar Graph
      • Funnel Chart
      • Gauge Chart
      • Likert Scale Chart
      • Matrix Chart
      • Multi Axis Line Chart
      • Overlapping Bar Chart
      • Pareto Chart
      • Radar Chart
      • Radial Bar Chart
      • Sankey Diagram
      • Scatter Plot Chart
      • Slope Chart
      • Sunburst Chart
      • Tornado Chart
      • Waterfall Chart
      • Word Cloud
    • Google Sheets
      Microsoft Excel
  • Services
  • Pricing
  • Contact us
  • Blog
  • Support dropdown img
      • Gallery
      • Videos
      • Contact us
      • FAQs
      • Resources
    • Please feel free to contact us

      atsupport@chartexpo.com

Categories
All Data Visualizations Data Analytics Surveys
Add-ons/
  • Google Sheets
  • Microsoft Excel
  • Power BI
All Data Visualizations Data Analytics Surveys
Add-ons
  • Google Sheets
  • Microsoft Excel
  • Power BI

We use cookies

This website uses cookies to provide better user experience and user's session management.
By continuing visiting this website you consent the use of these cookies.

Ok

ChartExpo Survey


Home > Blog > Surveys

Top Market Research Methods for Stunning Insights

Having your finger on the market’s pulse is crucial to stay ahead of the competition.

This is where market research methods come into play.

Now, I know what you’re thinking. Market research? Isn’t that just a fancy term for snooping on your competitors?

Market Research Methods

Well, my friend, it’s so much more than that. Market research is a crucial component of any successful business strategy. It provides insights into customer preferences, market trends, and competitive landscapes.

Its value?

Oh, it’s priceless! Knowing your audience’s whims and wishes means wielding the power to outshine your competitors effortlessly.

But here’s the kicker: not all market research methods are equal. There’s primary research, secondary research, and then a whole smorgasbord of methods to choose from.

But the real magic happens when you analyze the data you collect.

Hold tight as we delve into the intricacies of primary and secondary market research. We shall discern the key differences and chart a course through the turbulent sea of market research methods.

We’ll not stop there.

We’ll also guide you in effortlessly analyzing all that juicy market research data in Excel.

Table of Content:

  1. What are Market Research Methods?
  2. Why are Market Research Methods So Valuable?
  3. Key Objectives of Market Research Methods
  4. Primary vs. Secondary Market Research Methods
  5. 4 Types of Market Research Methods
  6. Top 10 Market Research Methods
    1. Secondary Research
    2. Competitive Analysis
    3. Social Media Listening
    4. Experimental Research
    5. A/B Testing
    6. Mystery Shopping
    7. Data Analytics
    8. Trend Analysis
    9. Customer Feedback Analysis
    10. Test Marketing
  7. How to Use a Market Research Technique?
  8. How to Analyze Market Research Methods?
  9. Example of Market Research Process
  10. Benefits of Using Best Marketing Research Procedures
  11. Best Practices for Using Market Research Methodologies
  12. Choosing the Right Market Research Method for Your Survey 
  13. Market Research Methods FAQs
  14. Wrap Up

But first!

What are Market Research Methods?

Definition: Market research methods are systematic techniques for gathering, analyzing, and interpreting data about a target market, audience, or industry. These methods help businesses understand customer preferences, market trends, competition, and potential opportunities.

They are broadly classified into primary research (e.g., Surveys, interviews, focus groups) and secondary research (e.g., analyzing existing reports, industry data, or online resources). By leveraging these methods, organizations make informed decisions to develop effective marketing strategies and improve their offerings.

Why are Market Research Methods So Valuable?

Market research methods are invaluable because they give businesses actionable insights to make data-driven decisions. Here’s why they are so important:

  1. Understand Customer Needs: Identify customer preferences, pain points, and expectations to create products and services that align with their needs.
  2. Reduce Risks: Minimize the risks of launching new products or entering new markets by understanding market demand and competition.
  3. Identify Opportunities: Discover untapped markets, trends, and areas for growth.
  4. Improve Marketing Strategies: Tailor campaigns to the right audience, ensuring better engagement and return on investment (ROI).
  5. Monitor Competitors: Stay ahead by analyzing competitors’ strategies, strengths, and weaknesses.
  6. Enhance Customer Satisfaction: Use feedback to improve customer experience and build loyalty.

Key Objectives of Market Research Methods

Think of market research methods as your business bestie, whispering customer secrets, spilling competitor tea, and dishing on the hottest market trends. The subsequent points outline the primary goals of engaging in market research:

  • Comprehend Your Target Market

  1. Define your optimal clientele.
  2. Comprehend their needs, aspirations, and obstacles.
  3. Assess their purchasing patterns and decision-making methods.

A comprehensive understanding of the target market is vital for the success of marketing strategies, pricing determinations, and product development endeavors. Utilizing effective market research methods, the data amassed through market research’ including demographics, psychographics, and behavioral information’ significantly contributes to shaping a detailed profile of the ideal customer. Psychographic segmentation plays a crucial role in this process by providing insights into consumers’ psychological and behavioral dimensions.

  • Identify Market Opportunities

  1. Uncover unmet needs in the market.
  2. Leverage new trends or technologies.
  3. Explore opportunities to expand into untapped markets or segments.

Utilizing effective Market Research Methods, market research aids in identifying market gaps and potential areas for business growth, including insights gained through segmentation of the market. By scrutinizing the competitive landscape and emerging trends, informed decisions can be made regarding resource allocation.

  • Develop and Test New Products and Services

  1. Determine the most crucial features and benefits for customers.
  2. Establish an optimal price point.

Test, launch, thrive! Market research empowers you to build products customers love, saving time, resources, and marketing heartache.

  • Track and Measure Marketing Performance

  1. Assess the reach of marketing campaigns to the target audience.
  2. Evaluate lead generation and sales outcomes.
  3. Calculate the return on investment (ROI).

Market research supports the tracking and assessment of marketing campaign performance with analytics for agencies. Turn insights into action! This market research treasure chest unlocks refined strategies and fuels a powerful ROI boost.

Primary vs. Secondary Market Research Methods

Primary or secondary research? It’s like choosing between crafting a gourmet meal from scratch and ordering a tantalizing dish from a menu. Which one tickles your taste for data?

Let’s find out.

  • Data Source

    • Primary market research: Involves collecting firsthand data directly from the source, typically through surveys, interviews, focus groups, or observations. The data is original and tailored to the specific research objectives.
    • Secondary market research: Relies on existing data previously collected by other sources. Examples include government agencies, industry reports, academic studies, and market research firms. The data is publicly available and not customized for the researcher’s needs.
  • Purpose

    • Primary market research: Ideal for addressing unique research questions and obtaining specific insights relevant to a particular business or project. It allows you to explore new areas and gain in-depth market knowledge.
    • Secondary market research: More suitable for getting an overview of the market, industry trends, and general information. It helps in benchmarking and understanding the broader context of the research topic.
  • Data Freshness

    • Primary market research: Provides the most current and up-to-date information since the data is collected for the specific research purpose.
    • Secondary market research: The data may not always be the most current. However, it provides valuable historical context and trends.
  •  Cost and Time

    • Primary market research: This can be more expensive and time-consuming. It involves designing research instruments, recruiting participants, conducting interviews or surveys, and analyzing data.
    • Secondary market research: Generally more cost-effective and quicker since the data is already available. You can access vast information without having to collect it from scratch.
  • Customization

    • Primary market research: Offers high customization as you can design surveys or interviews tailored to specific research objectives. You have control over the questions asked and the data collected.
    • Secondary market research: Provides limited customization since you must work with the existing data. Furthermore, you may not find data that perfectly aligns with your research needs.

4 Types of Market Research Methods

1. Surveys

Surveys involve collecting structured responses from a target audience through questionnaires. They are ideal for gathering quantitative data and identifying customer preferences.

2. Interviews

One-on-one interviews provide in-depth insights into consumer behavior, motivations, and pain points. They allow for open-ended discussions and detailed feedback.

3. Focus Groups

A focus group consists of a small group of participants discussing a product, service, or idea. This method helps businesses understand customer perceptions and emotional responses.

4. Observational Research

This method involves monitoring customer behavior in real-world settings without direct interaction. It helps businesses understand buying patterns and decision-making processes.

Top 10 Market Research Methods

1. Secondary Research

Analyze existing data, reports, and industry studies from sources like government publications, trade associations, and market research firms to understand market trends, customer behavior, and competitive landscapes.

2. Competitive Analysis

Examine competitors’ products, pricing, marketing strategies, and customer reviews to identify market gaps, strengths, and opportunities for differentiation. This method helps businesses refine their strategies and stay ahead in the market.

3. Social Media Listening

Monitor discussions, hashtags, brand mentions, and consumer sentiments on platforms like Twitter, Facebook, and LinkedIn. This provides real-time insights into customer opinions, industry trends, and brand reputation.

4. Experimental Research

Test different marketing strategies, pricing models, or product variations in controlled settings to determine which approach resonates best with customers. This helps businesses optimize their offerings based on data-driven insights.

5. A/B Testing

Compare two versions of a webpage, advertisement, or product feature to determine which one performs better. This method is widely used in digital marketing to improve conversion rates and customer engagement.

6. Mystery Shopping

Hire evaluators to visit stores, call customer service, or interact with online platforms while posing as regular customers. This helps assess service quality, product performance, and overall customer experience.

7. Data Analytics

Utilize big data, AI-driven tools, and customer relationship management (CRM) systems to analyze customer behavior, purchasing patterns, website traffic, and engagement metrics. This enables businesses to make informed decisions.

8. Trend Analysis

Study historical and current market trends, consumer behaviors, and industry developments to predict future demand and market shifts. Businesses can use this insight to align their strategies with emerging opportunities.

9. Customer Feedback Analysis

Collect and evaluate customer feedback through online reviews, complaint records, and satisfaction surveys. This helps businesses identify pain points, improve products, and enhance customer satisfaction.

10. Test Marketing

Launch a product or service in a limited market segment before a full-scale release. This allows businesses to gauge consumer reactions, refine their offerings, and minimize risks before expanding to larger markets.

How to Use a Market Research Technique?

Step 1: Define Your Research Objective

Identify what you want to achieve with market research. It could be understanding customer needs, evaluating competitors, or testing a new product idea. A clear objective helps in selecting the right research method.

Step 2: Choose the Appropriate Research Method

Select a technique based on your objective. For example:

  • Competitive Analysis for studying competitors
  • Social Media Listening for real-time customer insights
  • A/B Testing for digital marketing improvements

Step 3: Collect Data

Gather relevant information using your chosen method. This could involve:

  • Analyzing industry reports (Secondary Research)
  • Monitoring customer interactions online (Social Media Listening)
  • Conducting experiments (Experimental Research)

Step 4: Analyze the Data

Process the collected data using statistical tools, AI analytics, or qualitative techniques. Identify patterns, trends, and insights that align with your research goals.

Step 5: Interpret and Apply Insights

Translate findings into actionable strategies. For example:

  • If trend analysis shows a rising demand for eco-friendly products, adjust your marketing strategy accordingly.
  • If mystery shopping reveals poor customer service, improve staff training.

Step 6: Test and Refine

Before fully implementing your insights, test small-scale changes through pilot programs or A/B testing. Evaluate the impact and make necessary adjustments.

Step 7: Monitor and Update

Market conditions change over time, so continuously track industry trends, customer preferences, and competitor movements. Adapt your strategies to stay relevant and competitive.

How to Analyze Market Research Methods?

Are you lost in a labyrinth of market research data?

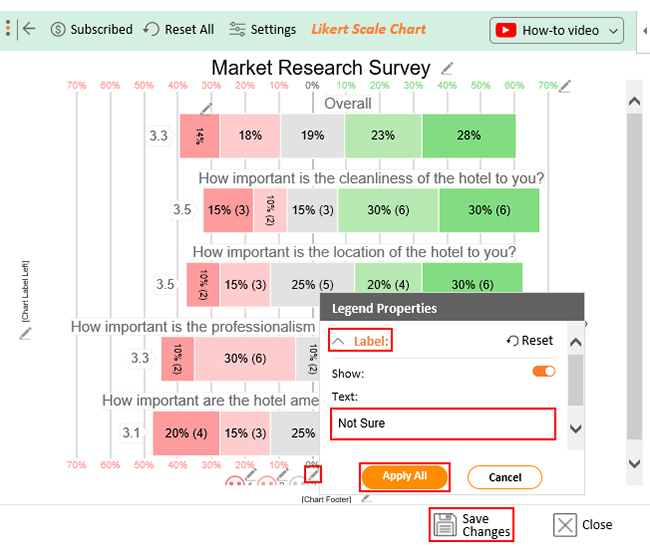
We’ve got the wizardry you need to unlock the secrets hidden within those rows and columns ChartExpo. ChartExpo turns dull spreadsheets into vibrant visualizations, making pie charts look jealous and bar graphs beg for mercy.

Why ChartExpo?

Benefits of Using ChartExpo

  • ChartExpo offers an array of visualizations, allowing you to cherry-pick the perfect one for your data. This turbocharges your data analysis game, making it as effective as a laser-guided missile.
  • ChartExpo struts its stuff with a user interface so easy to use that it feels like child’s play. No coding chops are required, just pure magic that conjures up eye-opening charts with a few clicks.
  • With ChartExpo, you have the power to create visual masterpieces that are as unique as a snowflake. Customize to your heart’s content with colors, fonts, and styles, turning your visuals into works of art.
  • ChartExpo gives you a taste of greatness for free with a 7-day trial. And when you’re ready to commit, the monthly plan is a steal at just $10.

How to Install ChartExpo in Excel?

  1. Open your Excel application.
  2. Open the worksheet and click the “Insert” menu.
  3. You’ll see the “My Apps” option.
  4. In the office Add-ins window, click “Store” and search for ChartExpo on my Apps Store.
  5. Click the “Add” button to install ChartExpo in your Excel.

ChartExpo charts are available both in Google Sheets and Microsoft Excel. Please use the following CTA’s to install the tool of your choice and create beautiful visualizations in a few clicks in your favorite tool.

Example of Market Research Process

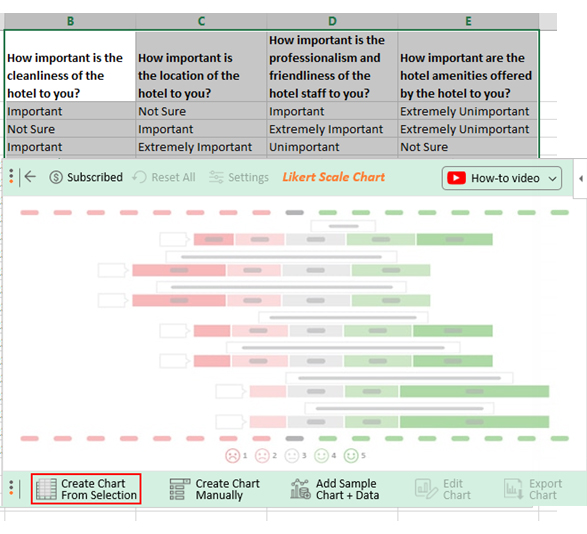
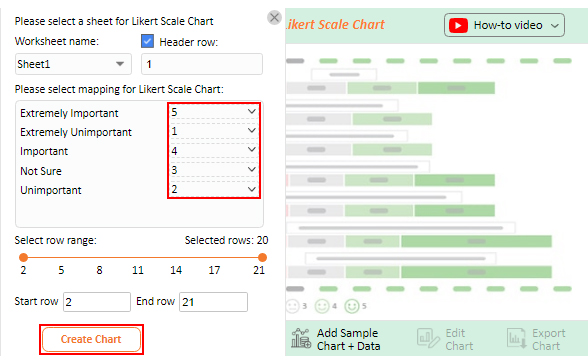
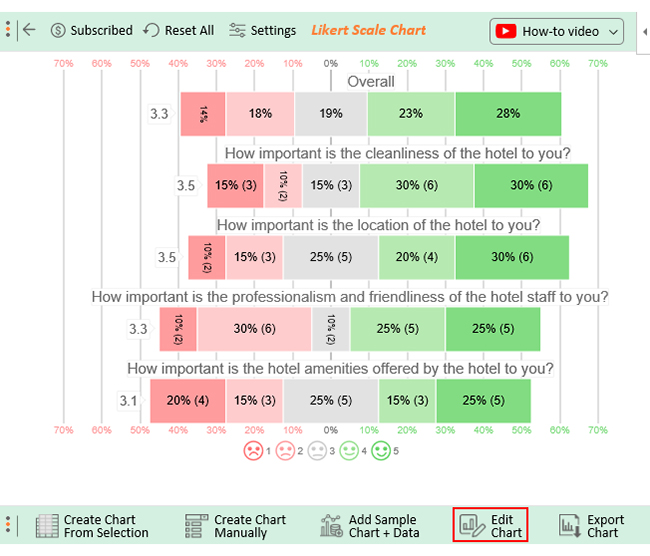
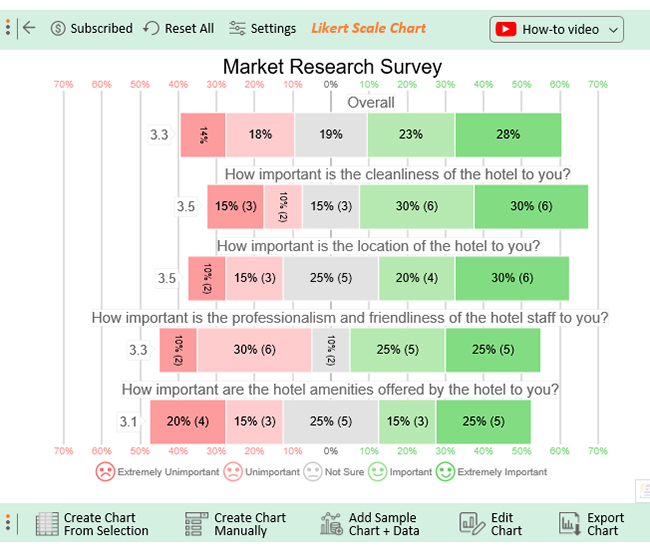
Let’s say you want to launch a hotel and want to know what customers want. Therefore you create a market research survey with the following questions.

  • How important is the cleanliness of the hotel to you?
  • How important is the location of the hotel to you?
  • How important is the professionalism of the hotel staff to you?
  • How important are the hotel amenities offered by the hotel to you?

Below is the response scale you embed on each question:

  1. Extremely Unimportant
  2. Unimportant
  3. Not Sure
  4. Important
  5. Extremely Important

Let’s say your survey yields the data table below.

How important is the cleanliness of the hotel to you? How important is the location of the hotel to you? How important is the professionalism of the hotel staff to you? How important are the hotel amenities offered by the hotel to you?
Important Not Sure Important Extremely Unimportant
Not Sure Important Extremely Important Extremely Unimportant
Important Extremely Important Unimportant Not Sure
Extremely Important Unimportant Extremely Unimportant Extremely Important
Extremely Important Not Sure Unimportant Unimportant
Not Sure Unimportant Important Important
Not Sure Unimportant Important Not Sure
Extremely Important Extremely Important Unimportant Important
Extremely Unimportant Important Important Not Sure
Extremely Important Not Sure Not Sure Extremely Important
Extremely Important Extremely Unimportant Extremely Unimportant Extremely Unimportant
Important Not Sure Extremely Important Extremely Important
Extremely Unimportant Important Extremely Important Extremely Important
Unimportant Extremely Important Not Sure Unimportant
Important Extremely Important Extremely Important Important
Important Extremely Important Extremely Important Extremely Unimportant
Unimportant Extremely Unimportant Important Extremely Important
Extremely Important Important Unimportant Not Sure
Extremely Unimportant Not Sure Unimportant Not Sure
Important Extremely Important Unimportant Unimportant

This table contains example data. Expect many responses and questions in real life.

  • To get started with ChartExpo, install ChartExpo in Excel.
  • Now Click on My Apps from the INSERT menu.
insert chartexpo in excel
  • Choose ChartExpo from My Apps, then click Insert.
open chartexpo in excel
  • Once it loads, choose the “Likert Scale Chart” from the charts list.
search likert scale chart in excel
  • Click the “Create Chart From Selection” button after selecting the data from the sheet, as shown.
Create Chart From Selection for Market Research Methods
  • When you click the “Create Chart From Selection” button, you have to map responses with numbers manually. The Likert scale has this arrangement:
    • Extremely Unimportant = 1
    • Unimportant = 2
    • Not Sure = 3
    • Important = 4
    • Extremely Important = 5
  • Once all is set, click the “Create Chart” button.
Map Likert Responses to Numbers for Market Research Methods
  • ChartExpo will generate the visualization below for you.
Market Research Methods Design Template
  • If you want to have the chart’s title, click Edit Chart, as shown in the above image.
  • Click the pencil icon next to the Chart Header to change the title.
  • It will open the properties dialog. Under the Text section, you can add a heading in Line 1 and enable Show.
  • Give the appropriate title of your chart and click the Apply button.
Apply Title on Chart for Market Research Methods
  • Let’s say you want to add text responses instead of numbers against every emoji.
  • Click the pencil icon next to the respective emoji. Expand the “Label” properties and write the required text. Then click the “Apply All” button.
  • Click the “Save Changes” button to persist the changes.
Apply Label on Chart for Market Research Methods
  • Your final chart will appear below.
Final Market Research Methods

Insights

  • 60% of the respondents consider hotel cleanliness important, 25% consider it unimportant, and 15% are neutral.
  • Regarding the hotel location, 50% find it important, whereas 25% find it unimportant.
  • In terms of the professionalism of the hotel staff, 50% consider it important, while 40% find it unimportant.
  • For hotel amenities, 40% consider them important, while 35% find them unimportant.
  • Overall, 51% view the aforementioned factors as important in their decision-making process, while 32% deem them unimportant.

Benefits of Using Best Marketing Research Procedures

Advantages of a proficient market research process include:

Informed Decision-Making

  • Acquire thorough customer insight: Grasp customer needs, desires, challenges, and purchasing behaviors to customize offerings effectively.
  • Forge a Competitive Edge: Assess competitors’ strengths and weaknesses to achieve effective brand differentiation and strategic planning.
  • Manage Risks: Experiment with new products, services, and marketing approaches before broad implementation to reduce potential losses.

Enhanced Profitability

  • Drive Sales Growth: Develop products and services resonating with the target market, resulting in increased demand and revenue.
  • Optimize Pricing: Set prices aligned with customer expectations and value perceptions, maximizing profit margins.
  • Efficient Resource Allocation: Concentrate marketing efforts on the most promising channels and segments, reducing acquisition costs and enhancing ROI.

Improved Customer Satisfaction

  • Tailor Offerings: Design products and services effectively addressing customer needs and preferences, fostering higher satisfaction and loyalty.
  • Develop impactful communication: Craft targeted messages that resonate with the audience, fostering stronger relationships and trust.
  • Enhance Customer Experience: Identify and tackle challenges in the map of customer journey, resulting in smoother interactions and increased word-of-mouth marketing.

Best Practices for Using Market Research Methodologies

1. Define Clear Research Objectives

Start with a well-defined goal to ensure your research is focused and actionable. Whether it’s understanding customer needs or evaluating competitors, having a clear objective guides the entire process.

2. Choose the Right Method for Your Goal

Different research goals require different techniques. For instance:

  • Use competitive analysis to study market rivals.
  • Apply social media listening for real-time consumer insights.
  • Conduct A/B testing for optimizing marketing strategies.

3. Ensure Data Quality and Accuracy

Reliable data is key to making informed decisions. Use credible sources, verify secondary research findings, and minimize biases in primary research to maintain accuracy.

4. Analyze and Interpret Objectively

Avoid confirmation bias by using statistical tools and objective analysis. Identify trends, patterns, and insights that genuinely reflect market conditions instead of supporting preconceived assumptions.

5. Keep Research Continuous and Adaptive

Markets evolve, so your research should too. Regularly update your insights, track industry trends, and refine your strategies to stay ahead of changing consumer behaviors and market dynamics.

Choosing the Right Market Research Method for Your Survey

Choosing the right market research method depends on your objectives and target audience. If you need in-depth insights, qualitative methods like open-ended questionnaires or customer feedback analysis work best. For measurable data, quantitative approaches such as structured surveys or online polls are more effective.

Consider your audience’s behavior social media listening is ideal for capturing real-time opinions, while competitive analysis helps evaluate market trends. If testing marketing strategies, A/B testing can reveal what resonates best. Finally, align your method with your budget and resources to ensure efficient and reliable data collection.

Market Research Methods FAQs

What are the primary types of market research methods?

Market research methods encompass a variety of approaches, including surveys, interviews, observational studies, focus groups, and data analysis. These methods are tailored to gather both quantitative and qualitative insights, providing a comprehensive understanding of market dynamics.

What are the 4 market research methods?

The four main market research methods are;

  • Surveys and questionnaires for gathering data from a target audience.
  • Interviews and focus groups for in-depth qualitative insights.
  • Observational research to observe consumer behavior.
  • Secondary research using existing data sources for analysis.

How do businesses choose the most suitable market research methods for their needs?

Businesses select market research methods based on their specific goals, target audience, and the nature of the information sought. Factors such as budget, timelines, and the desired depth of insights play a role in the decision-making process.

Wrap Up

Market research methods are vital for optimizing business strategies and decision-making. A thoughtful combination of primary and secondary methods provides valuable insights into customer preferences, market trends, and competitors. Moreover, they allow you to identify opportunities, mitigate risks, and effectively tailor offerings to meet customer demands.

Surveys provide valuable quantitative data, enabling you to understand customer demographics and preferences on a large scale. Interviews and focus groups offer qualitative depth, unveiling motivations and sentiments that may not be apparent through surveys.

Observational research allows you to monitor consumer behavior, helping you identify trends and pain points in real-world settings. Moreover, secondary research taps into existing data sources, saving time and resources while providing valuable information.

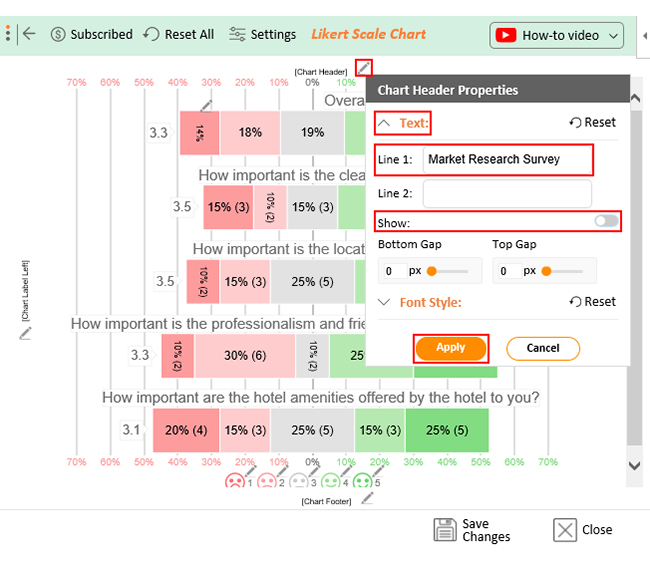
To optimize market research methods further, use innovative tools like ChartExpo, which turns data into captivating visualizations. ChartExpo allows you to analyze data more efficiently and make data-driven decisions that improve business outcomes.

Ready to chart your way to data domination? Embrace the magic of ChartExpo and watch your competitors disappear into thin air.

How much did you enjoy this article?

PBIAd1
Start Free Trial!
128551

Related articles

next previous
Surveys11 min read

How to Interpret 4-Point Likert Scale Results?

Click to learn How to Create, Gather and Analyze Data Using the 4-Point Likert Scale? A complete guide with definition, examples, uses, and applications.

Surveys32 min read

Net Promoter Survey: Lies, Legends, and Lazy Thinking

Net Promoter Survey risks hiding customer truths behind one-size-fits-all scores. Want feedback that drives decisions? Get started with smarter questions.

Surveys11 min read

How to Make a Questionnaire? Examples & Templates

What is a questionnaire in survey? Learn how to make a questionnaire for a survey using Google Forms and analyze the questionnaire data in Excel.

Surveys18 min read

50 Impactful Business Survey Questions for Targeted Insights

What is a business survey? How to use the right business survey questions to help get your customers' and prospects' insights and behaviors in Excel?

Surveys12 min read

Top Post-Event Survey Questions to Measure Event Success

Click to learn how to craft post-event survey questions. It will help you understand the attendees' perspectives to improve your future events and processes.

ChartExpo logo

Turn Data into Visual
Stories

CHARTEXPO

  • Home
  • Gallery
  • Videos
  • Services
  • Pricing
  • Contact us
  • FAQs
  • Privacy policy
  • Terms of Service
  • Sitemap

TOOLS

  • ChartExpo for Google Sheets
  • ChartExpo for Microsoft Excel
  • Power BI Custom Visuals by ChartExpo
  • Word Cloud

CATEGORIES

  • Bar Charts
  • Circle Graphs
  • Column Charts
  • Combo Charts
  • Comparison Charts
  • Line Graphs
  • PPC Charts
  • Sentiment Analysis Charts
  • Survey Charts

TOP CHARTS

  • Sankey Diagram
  • Likert Scale Chart
  • Comparison Bar Chart
  • Pareto Chart
  • Funnel Chart
  • Gauge Chart
  • Radar Chart
  • Radial Bar Chart
  • Sunburst Chart
  • see more
  • Scatter Plot Chart
  • CSAT Survey Bar Chart
  • CSAT Survey Chart
  • Dot Plot Chart
  • Double Bar Graph
  • Matrix Chart
  • Multi Axis Line Chart
  • Overlapping Bar Chart
  • Control Chart
  • Slope Chart
  • Clustered Bar Chart
  • Clustered Column Chart
  • Box and Whisker Plot
  • Tornado Chart
  • Waterfall Chart
  • Word Cloud
  • see less

RESOURCES

  • Blog
  • Resources
  • YouTube
SIGN UP FOR UPDATES

We wouldn't dream of spamming you or selling your info.

© 2025 ChartExpo, all rights reserved.