• Home
  • Tools dropdown img
    • Spreadsheet Charts

      • ChartExpo for Google Sheets
      • ChartExpo for Microsoft Excel
    • Power BI Charts

      • Power BI Custom Visuals by ChartExpo
    • Word Cloud

  • Charts dropdown img
    • Chart Category

      • Bar Charts
      • Circle Graphs
      • Column Charts
      • Combo Charts
      • Comparison Charts
      • Line Graphs
      • PPC Charts
      • Sentiment Analysis Charts
      • Survey Charts
    • Chart Type

      • Box and Whisker Plot
      • Clustered Bar Chart
      • Clustered Column Chart
      • Comparison Bar Chart
      • Control Chart
      • CSAT Survey Bar Chart
      • CSAT Survey Chart
      • Dot Plot Chart
      • Double Bar Graph
      • Funnel Chart
      • Gauge Chart
      • Likert Scale Chart
      • Matrix Chart
      • Multi Axis Line Chart
      • Overlapping Bar Chart
      • Pareto Chart
      • Radar Chart
      • Radial Bar Chart
      • Sankey Diagram
      • Scatter Plot Chart
      • Slope Chart
      • Sunburst Chart
      • Tornado Chart
      • Waterfall Chart
      • Word Cloud
    • Google Sheets
      Microsoft Excel
  • Services
  • Pricing
  • Contact us
  • Blog
  • Support dropdown img
      • Gallery
      • Videos
      • Contact us
      • FAQs
      • Resources
    • Please feel free to contact us

      atsupport@chartexpo.com

Categories
All Data Visualizations Data Analytics Surveys
Add-ons/
  • Google Sheets
  • Microsoft Excel
  • Power BI
All Data Visualizations Data Analytics Surveys
Add-ons
  • Google Sheets
  • Microsoft Excel
  • Power BI

We use cookies

This website uses cookies to provide better user experience and user's session management.
By continuing visiting this website you consent the use of these cookies.

Ok

ChartExpo Survey


Home > Blog > Data Analytics

How to Calculate Capex: Definition, Visuals & Formulas

It is crucial to have a good understanding of how to calculate CapEx to make sound financial decisions. While it may appear intimidating, mastering this skill is essential for every business owner or financial expert.

how to calculate capex

CapEx, short for capital expenditures, includes the cash a business spends on property with a lifespan exceeding 12 months. This accommodates property consisting of land, equipment, or buildings. Hence, knowing how to calculate CapEx enables you to evaluate your long-term asset investments effectively.

How to calculate CapEx requires carefully evaluating a company’s spending on physical assets. It offers a preview of its dedication to growth and progress. The U.S. Bureau of Economic Analysis reports that private fixed investment, including CapEx, has been consistently rising. This shows how important capital investments are in advancing economic growth.

Furthermore, how to calculate CapEx allows you to assess how your business is operating and strategize for expansion. A solid understanding of CapEx allows financial analysts to analyze a company’s investment patterns and evaluate its competitive position.

In this article, we will learn how to calculate CapEx. We will equip you to make wise financial decisions and drive your business toward sustainable success.

Let’s begin.

Table of Contents:

  1. What is Capital Expenditure (CapEx)?
  2. What are the Types of CapEx?
  3. What is the Difference between OpEx vs. CapEx?
  4. Why is CapEx Important?
  5. How to Calculate CapEx?
  6. How to Examine Capital Expenditure (Capex)?
  7. Wrap Up

First…

What is Capital Expenditure (CapEx)?

Definition: CapEx stands for Capital Expenditure. It refers to money used to purchase, improve, or maintain physical assets such as buildings, equipment, and machinery. It includes amounts spent on acquiring new assets, fixing the present one, or enhancing its functions. CapEx is a huge commitment undertaken by a company for future gains.

Production capacity boosting, efficiency improvement, and compliance with regulations are some uses of capital expenditures (CapEx). This involves buying machines, constructing buildings, and upgrading technological facilities. Good financial planning and analysis help ensure efficient allocation of resources when making decisions concerning capital expenditure. Managing Capital Expenditures can enhance a company’s competitiveness and future growth opportunities.

Unlike operating expenses, CapEx is not incurred regularly but is crucial for the growth of a business. Understanding how to calculate CapEx is a vital element in the process of financial planning and budgeting. By tracking CapEx, companies can measure return on investment capital and evaluate their investment plans, as well as their capacity to produce future cash earnings.

What are the Types of CapEx?

Understanding the types of CapEx is essential for informed financial data-driven decision-making and bolstering your business’s competitiveness. Each type plays a vital function in shaping a company’s growth trajectory and operational performance.

  1. Buildings: Investments in building or obtaining new facilities, places of work, or manufacturing plants fall under this class. Companies allocate budgets to enlarge their physical footprint or enhance present infrastructure to support operations.
  2. Land: Purchase or development of land for future projects or expansion initiatives constitutes land CapEx. It’s an essential investment for companies planning long-term growth or real estate development.
  3. Equipment and machinery: Procuring new machinery or upgrading existing equipment is vital for enhancing productivity and efficiency.
  4. Computers or servers: Investments in technology infrastructure include hardware like computer systems, servers, and networking equipment. This enables companies to stay aggressive in the digital age by supporting various KPIs for operations and data management.
  5. Furniture: Acquiring office furniture and fixtures to create conducive work environments for employees is a common type of CapEx. How to calculate CapEx such as this contributes to enhancing productivity and employee satisfaction.
  6. Vehicles: Companies may invest in vans, trucks, or company cars to aid logistics, transportation, or field operations. Vehicle CapEx ensures smooth operations and timely delivery of products and services.
  7. Patents: Intellectual property investments, including patents, trademarks, and copyrights, safeguard a company’s innovations and proprietary technologies. Patents provide legal protection and potential revenue streams through licensing or royalties.

What is the Difference between OpEx vs. CapEx?

What is OpEx vs. CapEx? OPEX encompasses expenses related to day-to-day operations, while CapEx pertains to investments in long-term assets. Understanding the disparity between the two is crucial for effective financial planning and decision-making.

Criteria Operating Expenditure (OpEx) Capital Expenditure (CapEx)
Nature of Expense Consists of day-to-day operational expenses Involves investments in long-term assets or infrastructure
Financial Treatment Typically fully expensed in the period incurred Often depreciated or amortized over the asset’s useful life
Impact on Income Directly impacts the company’s profitability Indirectly affects profitability through depreciation
Examples Salaries, utilities, rent, marketing expenses Machinery purchase, building construction, software upgrades
Timing of Expense Incurred regularly and immediately Incurred upfront but provides benefits over an extended period
Reversibility Generally reversible or adjustable in the short-term Generally irreversible or requires significant effort to reverse
Strategic Focus Maintains day-to-day operations and sustains business Enhances productivity, efficiency, and long-term growth

Why is CapEx Important?

CapEx drives business success by fueling growth, enhancing competitiveness, and growing sustainable value for stakeholders. Its prudent control is important for achieving strategic goals and maintaining a competitive edge in dynamic marketplace environments.

  • Investment in growth: CapEx allows you to expand operations, enter new markets, and develop innovative products or services. This fosters long-term growth and sustainability.
  • Competitive advantage: Strategic investments in CapEx can give your organization a competitive edge. How? By enhancing operational efficiency, improving product quality, and staying ahead of business trends.
  • Long-term value creation: CapEx contributes to the creation of long-term financial plans for shareholders. It helps to generate revenue streams, increase asset value, and support overall business growth.
  • Asset maintenance and replacement: CapEx ensures the upkeep and replacement of aging or obsolete assets. Consequently, it prevents operational disruptions and maintains productivity levels.
  • Financial performance: Proper management of CapEx can positively impact financial performance metrics such as revenue growth and return on investment. This bolsters the company’s overall financial health.
  • Investor confidence: Transparent and strategic allocation of CapEx funds instills confidence in investors. It demonstrates the company’s commitment to growth, profitability, and long-term value creation.

How to Calculate CapEx?

How to calculate CapEx involves identifying and summing up all expenditures made on acquiring, upgrading, or improving long-term assets. The process involves the following steps:

  1. Identify changes in PP&E: Determine the change in PP&E from the beginning to the end of the period. PP&E includes tangible assets such as buildings, machinery, and equipment.
  2. Account for depreciation: Add the current depreciation expense to the change in PP&E. Depreciation reflects the allocation of the cost of an asset over its useful life.
  3. Apply the CapEx formula: The formula for calculating CapEx is:

Capex = Change in PP&E + current depreciation

CapEx Example: Let’s consider a company, XYZ Corp. At the beginning of the year, XYZ Corp had PP&E valued at $1,000,000. Throughout the year, they acquired new equipment worth $200,000 and disposed of old equipment worth $50,000. The company’s depreciation expense for the year amounted to $150,000.

Calculation:

  1. Change in PP&E = (Ending PP&E) – (Beginning PP&E) = [($1,000,000 + $200,000) – ($1,000,000 – $50,000)] = $1,150,000 – $950,000 = $200,000
  2. CapEx = Change in PP&E + Current Depreciation = $200,000 + $150,000 = $350,000

Result: The CapEx for XYZ Corp for the year is $350,000.

How to Examine Capital Expenditure (Capex)?

Analyzing data can be as complex and frustrating as attempting to solve a Rubik’s cube in the dark. And the challenge is real when analyzing CapEx.

This is in which data visualization comes in, supplying clarity and expertise to complex datasets.

Although Excel is beneficial, it lacks strong visual representation abilities, making data analysis difficult.

Enter ChartExpo – the solution to Excel’s visualization limitations. With its intuitive interface and dynamic visualization capabilities, ChartExpo transforms CapEx data into visually engaging charts and graphs. This makes complex data analysis a breeze.

Let’s learn how to install ChartExpo in Excel.

  1. Open your Excel application.
  2. Open the worksheet and click the “Insert” menu.
  3. You’ll see the “My Apps” option.
  4. In the Office Add-ins window, click “Store” and search for ChartExpo on my Apps Store.
  5. Click the “Add” button to install ChartExpo in your Excel.

ChartExpo charts are available both in Google Sheets and Microsoft Excel. Please use the following CTAs to install the tool of your choice and create beautiful visualizations with a few clicks in your favorite tool.

CapEx Example

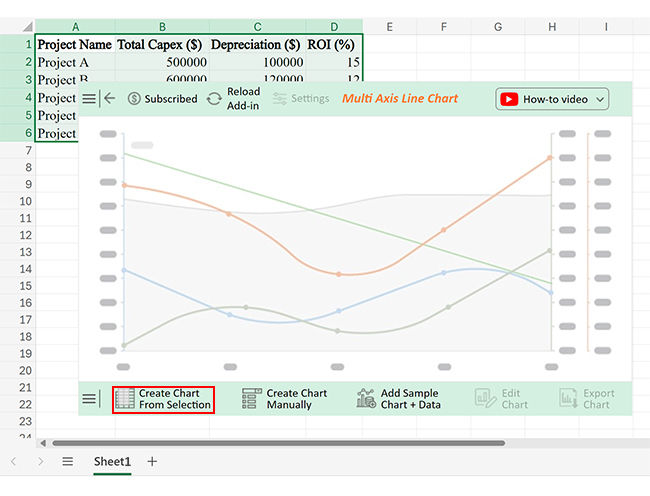
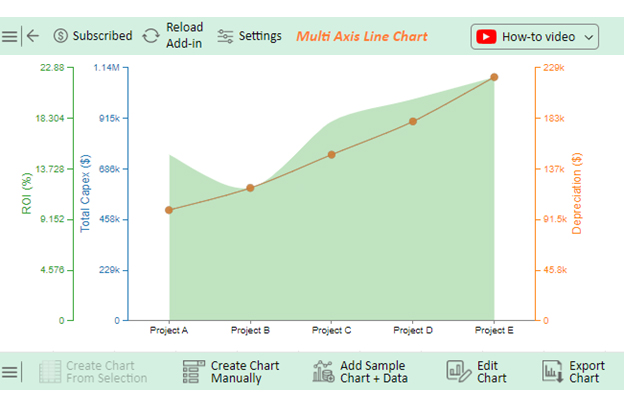
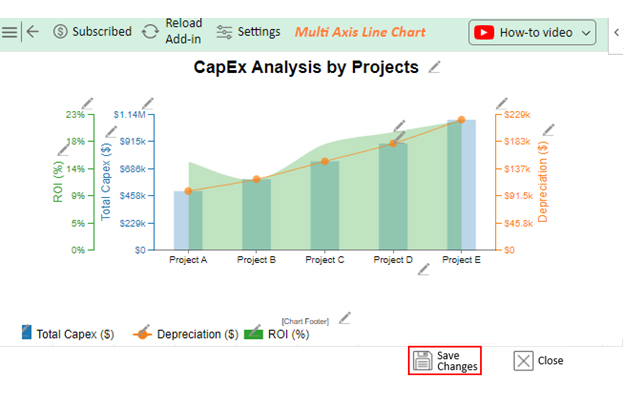
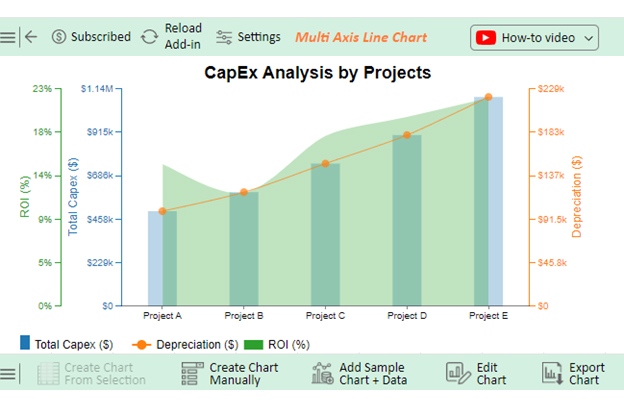
Let’s say you want to analyze the CapEx sample data below.

Project Name Total Capex ($) Depreciation ($) ROI (%)
Project A 500000 100000 15
Project B 600000 120000 12
Project C 750000 150000 18
Project D 900000 180000 20
Project E 1100000 220000 22

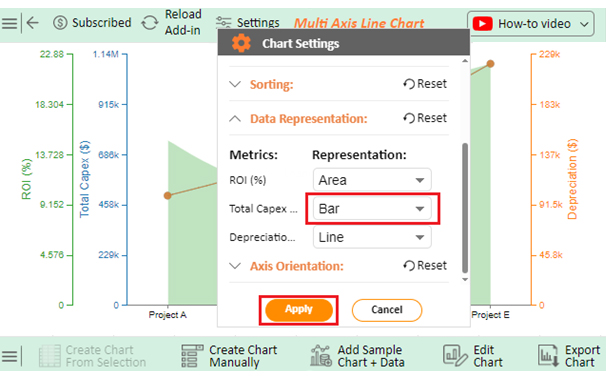
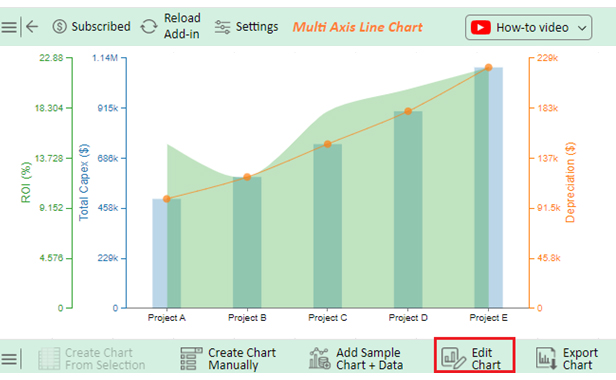
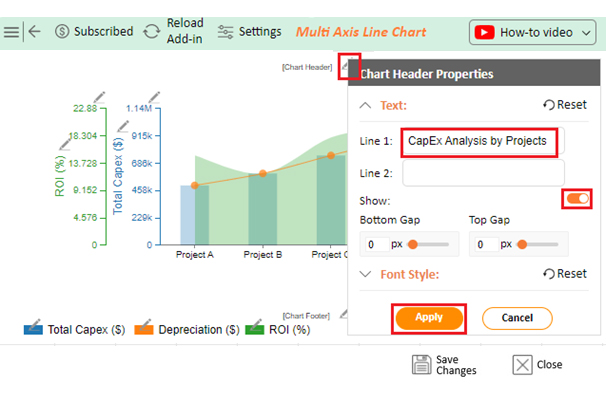
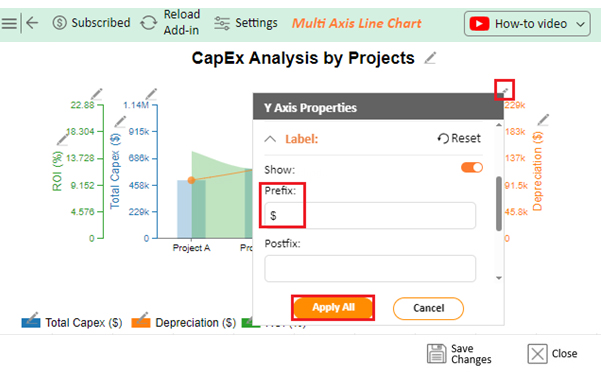
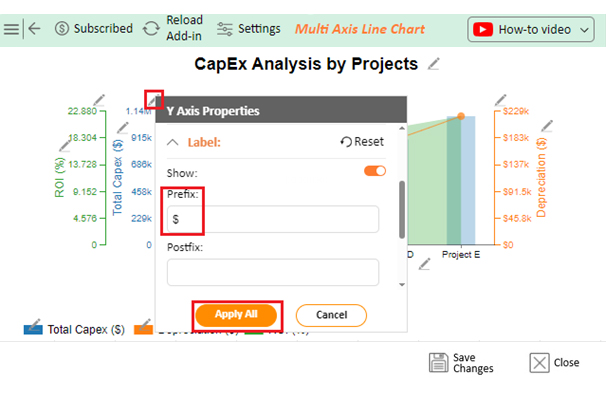
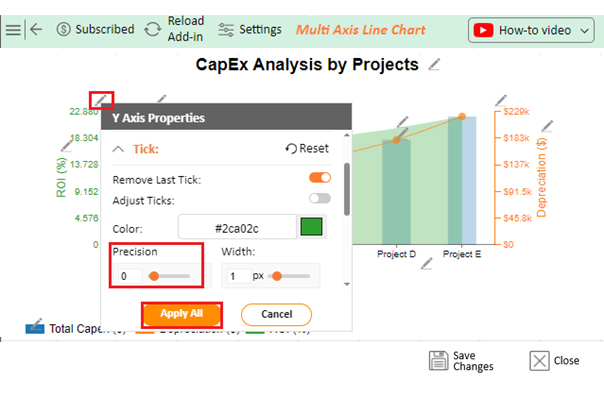
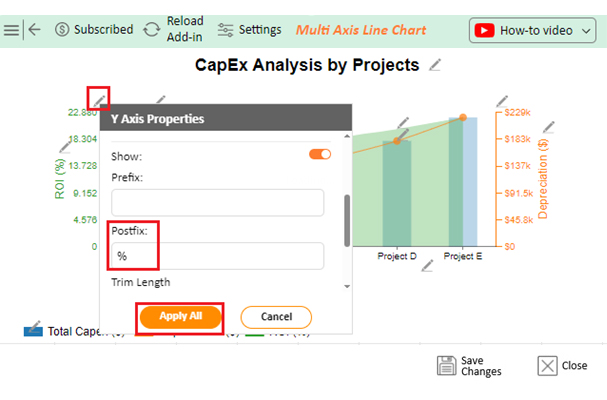
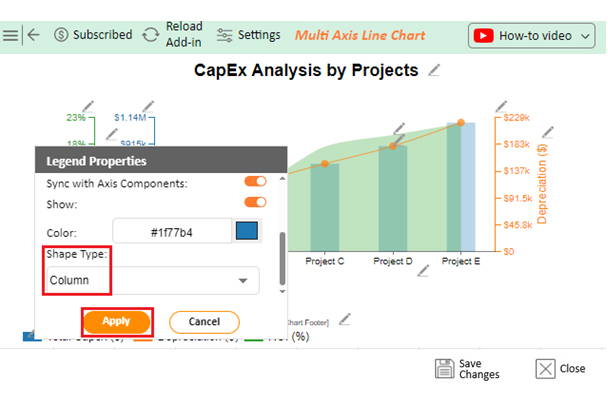
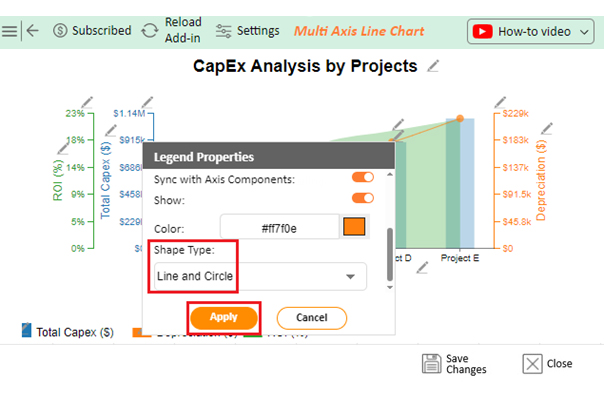
Follow these steps to visualize this data in Excel using ChartExpo and glean valuable insights.

  • To get started with ChartExpo, install ChartExpo in Excel.
  • Now Click on My Apps from the INSERT menu.
insert chartexpo in excel
  • Choose ChartExpo from My Apps, then click Insert.
open chartexpo in excel
  • Once it loads, scroll through the charts list to locate and choose the “Multi-Axis Line Chart”.
search multi axis line chart in excel
  • Click the “Create Chart From Selection” button after selecting the data from the sheet, as shown.
Create Chart From Selection After Learning How to Calculate CAPEX
  • ChartExpo will generate the visualization below for you.
Initial Visual After Learning How to Calculate CapEx
  • Click on Settings and change the “Data Representation” of Profit Markup into Bar as follows.
Change Data Representation After Learning How to Calculate CapEx
  • If you want to add anything to the chart, click the Edit Chart button:
Edit Chart After Learning How to Calculate CapEx
  • Click the pencil icon next to the Chart Header to change the title.
  • It will open the properties dialog. Under the Text section, you can add a heading in Line 1 and enable Show.
  • Give the appropriate title of your chart and click the Apply button.
Add Chart Header After Learning How to Calculate CapEx
  • Add a dollar sign with the Depreciation values.
Add Prefix in Depreciation Values After Learning How to Calculate CapEx
  • Add a dollar sign with the Total CapEx values.
Add Prefix in Total CapEx After Learning How to Calculate CapEx
  • Change the precision value of ROI to zero.
Change Precision of ROI After Learning How to Calculate CapEx
  • Add the percentage sign with ROI.
Add Postfix in ROI After Learning How to Calculate CapEx
  • Change the Legend shape of Total CapEx to Column and click the Apply button.
Change Legend Shape After Learning How to Calculate CapEx
  • Change the Legend shape of Depreciation into a Line and Circle and click the Apply button.
Apply Legend Changes After Learning How to Calculate CapEx
  • Click the Save Changes button to persist the changes made to the chart.
Save Changes After Learning How to Calculate CapEx
  • Your final Multi Axis Line Chart will look like the one below.
Final How to Calculate CapEx

Insights

  • The total capital expenditures vary from $500,000 to $1,100,000.
  • The depreciation ranges from $100,000 to $220,000.
  • ROI spans from 12% to 22%, showing profit potential.
  • Project E demonstrates increased ROI, indicating superior investment returns.

FAQs

Is CapEx a budget?

No, CapEx is not a budget. It represents long-term investments in assets and infrastructure. While CapEx figures may influence budgeting decisions, they are distinct from the overall budget of a company or project.

Is high CapEx good or bad?

High CapEx can be good or bad, depending on the context. It’s positive when it fuels growth, innovation, and competitiveness. However, if not managed efficiently, it can strain finances and hinder profitability, leading to negative outcomes.

Does CapEx affect gross profit?

Yes, CapEx affects gross profit indirectly. CapEx itself isn’t directly deducted from revenue to calculate gross profit. However, the depreciation of CapEx assets is factored into the cost of goods sold (COGS), which impacts gross profit.

Wrap Up

Learning how to calculate CapEx is essential for businesses to make well-informed financial choices. Evaluating changes in PP&E and factoring in depreciation assists in accurately calculating your company’s investment in long-term assets. This computation helps with budgeting, financial analysis, and strategic planning.

Properly managing CapEx contributes to sustainable growth, profitability, and shareholder value. It clearly shows the company’s investment in future growth opportunities and asset maintenance.

Moreover, CapEx influences financial performance metrics and investor confidence. Transparent and strategic allocation of CapEx funds demonstrates the company’s commitment to long-term success.

While high CapEx can drive growth and innovation, it must be managed efficiently to avoid financial strain. Additionally, CapEx affects gross profit indirectly through depreciation’s impact on COGS. Therefore, you must balance investing in CapEx for growth and maintaining financial stability.

Overall, how to calculate CapEx empowers your business to navigate the complex financial landscape with confidence and clarity. It enables you to allocate resources effectively, maximize returns on investment, and achieve sustainable long-term success.

Do not hesitate.

Embrace the concept of CapEx with ChartExpo to fuel your business’s growth and financial health.

How much did you enjoy this article?

PBIAd1
Start Free Trial!
134837

Related articles

next previous
Data Analytics31 min read

Data Analysis Without Nonsense: Fix the Right Problem, Fast

Data analysis can mislead when metrics look right but outcomes fail. Learn how to spot red flags, fix failures, and make better decisions. Read on!

Data Analytics29 min read

Variance Analysis Isn’t a Math Problem, It’s a Trust Problem

Variance analysis helps identify what went wrong, who owns it, and what to do next. Use it to drive decisions, not just reports. Learn more!

Data Analytics10 min read

Supplier Comparison Template: Download It Now

A supplier comparison template streamlines vendor evaluation by comparing cost and quality. Click here to learn its benefits and how to analyze them.

Data Analytics32 min read

Ecommerce Analytics: How to Fix What It Often Gets Wrong

Ecommerce analytics often lead to mixed signals and costly misreads. Fix attribution gaps, align teams, and act on the right data. Get started now!

Data Analytics30 min read

When Sales Funnel Breaks: Failures, Fixes, & Funnel Debt

Is your sales funnel hiding costly gaps? Learn how pipeline stalls, false metrics, and handoff chaos could be draining revenue. Get started now!

ChartExpo logo

Turn Data into Visual
Stories

CHARTEXPO

  • Home
  • Gallery
  • Videos
  • Services
  • Pricing
  • Contact us
  • FAQs
  • Privacy policy
  • Terms of Service
  • Sitemap

TOOLS

  • ChartExpo for Google Sheets
  • ChartExpo for Microsoft Excel
  • Power BI Custom Visuals by ChartExpo
  • Word Cloud

CATEGORIES

  • Bar Charts
  • Circle Graphs
  • Column Charts
  • Combo Charts
  • Comparison Charts
  • Line Graphs
  • PPC Charts
  • Sentiment Analysis Charts
  • Survey Charts

TOP CHARTS

  • Sankey Diagram
  • Likert Scale Chart
  • Comparison Bar Chart
  • Pareto Chart
  • Funnel Chart
  • Gauge Chart
  • Radar Chart
  • Radial Bar Chart
  • Sunburst Chart
  • see more
  • Scatter Plot Chart
  • CSAT Survey Bar Chart
  • CSAT Survey Chart
  • Dot Plot Chart
  • Double Bar Graph
  • Matrix Chart
  • Multi Axis Line Chart
  • Overlapping Bar Chart
  • Control Chart
  • Slope Chart
  • Clustered Bar Chart
  • Clustered Column Chart
  • Box and Whisker Plot
  • Tornado Chart
  • Waterfall Chart
  • Word Cloud
  • see less

RESOURCES

  • Blog
  • Resources
  • YouTube
SIGN UP FOR UPDATES

We wouldn't dream of spamming you or selling your info.

© 2025 ChartExpo, all rights reserved.