• Home
  • Tools dropdown img
    • Spreadsheet Charts

      • ChartExpo for Google Sheets
      • ChartExpo for Microsoft Excel
    • Power BI Charts

      • Power BI Custom Visuals by ChartExpo
    • Word Cloud

  • Charts dropdown img
    • Chart Category

      • Bar Charts
      • Circle Graphs
      • Column Charts
      • Combo Charts
      • Comparison Charts
      • Line Graphs
      • PPC Charts
      • Sentiment Analysis Charts
      • Survey Charts
    • Chart Type

      • Box and Whisker Plot
      • Clustered Bar Chart
      • Clustered Column Chart
      • Comparison Bar Chart
      • Control Chart
      • CSAT Survey Bar Chart
      • CSAT Survey Chart
      • Dot Plot Chart
      • Double Bar Graph
      • Funnel Chart
      • Gauge Chart
      • Likert Scale Chart
      • Matrix Chart
      • Multi Axis Line Chart
      • Overlapping Bar Chart
      • Pareto Chart
      • Radar Chart
      • Radial Bar Chart
      • Sankey Diagram
      • Scatter Plot Chart
      • Slope Chart
      • Sunburst Chart
      • Tornado Chart
      • Waterfall Chart
      • Word Cloud
    • Google Sheets
      Microsoft Excel
  • Services
  • Pricing
  • Contact us
  • Blog
  • Support dropdown img
      • Gallery
      • Videos
      • Contact us
      • FAQs
      • Resources
    • Please feel free to contact us

      atsupport@chartexpo.com

Categories
All Data Visualizations Data Analytics Surveys
Add-ons/
  • Google Sheets
  • Microsoft Excel
  • Power BI
All Data Visualizations Data Analytics Surveys
Add-ons
  • Google Sheets
  • Microsoft Excel
  • Power BI

We use cookies

This website uses cookies to provide better user experience and user's session management.
By continuing visiting this website you consent the use of these cookies.

Ok

ChartExpo Survey


Home > Blog > Google Sheets

Google Sheets Accounting Template: Insights Made Simple

Tracking business finances without a clear system leads to missed entries, classification errors, and reports you cannot trust.

Google Sheets Accounting Template

A Google Sheets Accounting Template solves this by providing a ready-made structure for recording transactions, monitoring cash flow, and generating the summaries that support sound financial decisions.

Unlike expensive software packages, it runs entirely in a browser, updates in real time, and costs nothing to use.

This blog explains what these templates are, why they matter, their core features and common types, how to build and analyze one from scratch, and practical tips that keep the system accurate and useful for the long term.

Table of Contents:

  1. What is a Google Sheets Accounting Template?
  2. Why Use a Google Sheets Accounting Template?
  3. Key Features of a Google Sheets Accounting Template
  4. Types of Google Sheets Accounting Templates
  5. Google Sheets Accounting Template Examples
  6. How to Create a Google Sheets Accounting Template?
  7. How to Analyze an Accounting Template in Google Sheets?
  8. How to Use and Download a Google Sheets Accounting Template?
  9. Benefits of Using a Google Sheets Accounting Template
  10. Tips for Creating a Google Sheets Accounting Template
  11. FAQs
  12. Wrap Up

What is a Google Sheets Accounting Template?

Definition: A Google Sheets Accounting Template is a purpose-built spreadsheet that gives individuals and businesses a structured foundation for managing financial data. Rather than constructing models from the ground up, users get a ready-made accounting template in Google Sheets complete with formulas, transaction categories, and summary views that streamline bookkeeping from day one.

At its core, a Google Sheets business accounting template automates key calculations while keeping financial records in a logical, searchable structure. Because it operates in the cloud, any authorized user can access and update data in real time, making teamwork on financial tasks straightforward and secure.

Why Use a Google Sheets Accounting Template?

Disorganized financial records create blind spots that slow decision-making and invite costly mistakes. The right template brings order to transactions, automates repetitive calculations, and puts financial visibility within reach for any user.

  • Centralizes financial records in one place: Consolidates every transaction, category, and financial summary into one shared, easy-to-navigate file.
  • Tracks income and expenses automatically: Streamlines revenue and spending oversight, the way a business expenses spreadsheet does for systematic expense monitoring.
  • Reduces manual calculation errors: Cuts down on arithmetic mistakes by running calculations automatically and applying the same logic across every sheet.
  • Provides real-time financial visibility: Surfaces changes the moment they are entered, so financial standing is always current and never stale.
  • Supports budgeting and forecasting: Supports structured planning for upcoming income and expenditure, particularly when paired with a cash flow forecasting template.
  • Simplifies tax preparation: Groups income and expenses into clean categories that translate directly into audit-ready reports at filing time.
  • Enables collaboration with team or accountant: Lets accountants, managers, and team members view or edit shared records simultaneously without version conflicts.

Key Features of a Google Sheets Accounting Template

What separates a functional spreadsheet from a powerful financial tool comes down to its built-in capabilities. The following features define a well-constructed Google Sheets Accounting Template.

  • Automated formulas for totals and balances: Computes totals, net figures, and running balances on the spot, removing any need for manual arithmetic.
  • Pre-built income and expense categories: Supplies a ready-made taxonomy for income and expenses, so every entry lands in the right place without guesswork.
  • Monthly and yearly summary dashboard: Rolls up detailed entries into period-level views that make evaluating financial performance fast and clear.
  • Cash flow tracking section: Dedicates a structured area to monitoring cash movement, offering the same visibility as a cash flow analysis template used to gauge short-term liquidity.
  • Data validation for accurate entry: Enforces input rules at the cell level, catching formatting and range errors before they corrupt financial records.
  • Customizable charts and reports: Provides built-in chart options that translate raw numbers into visual comparisons users can tailor to their reporting goals.
  • Cloud-based access and sharing controls: Stores data in the cloud with permission-based sharing, giving authorized users access from any internet-connected device.

Types of Google Sheets Accounting Templates

No single layout fits every financial need. These are the most widely used formats, each targeting a distinct accounting goal.

  • Income and Expense Tracker Template: Logs every income and expense entry by date, giving a running view of profitability and spending discipline over time.
  • Cash Flow Statement Template: Documents all cash receipts and disbursements so users can assess liquidity and spot funding gaps before they become problems.
  • Profit and Loss (P&L) Template: Presents a period-based view of income minus costs, comparable to a Google Sheet profit and loss template used to benchmark operating results.
  • Balance Sheet Template: Captures the financial position at a given date by listing assets, liabilities, and equity, mirroring a balance sheet template in Google Sheets built for net worth and solvency review.
  • Budget Planning Template: Sets forward-looking income and cost targets organized by period, forming a reference point for variance tracking.
  • Accounts Receivable and Payable Template: Keeps a live register of amounts owed to and by the business, supporting timely collections and payment scheduling.

Google Sheets Accounting Template Examples

  • Income and Expense Flow

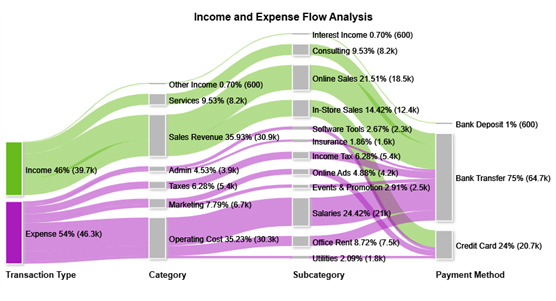
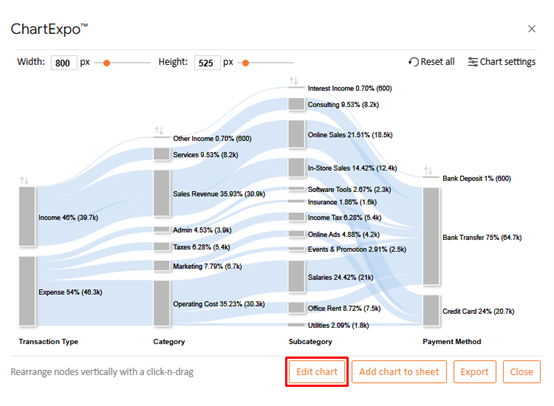
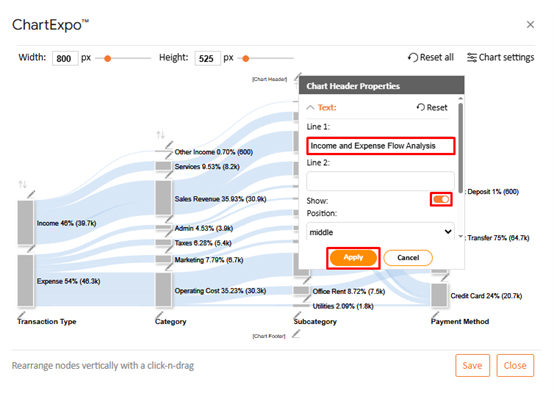
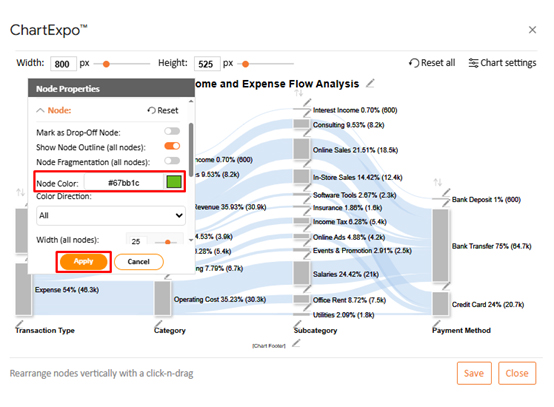
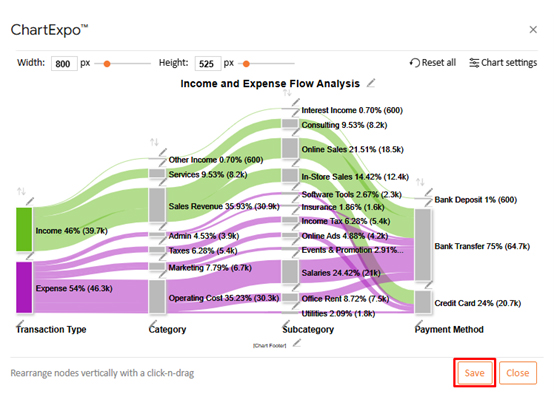
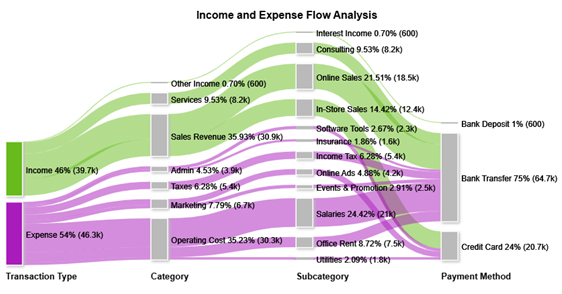
This chart maps the path of funds from income sources through expense categories and payment methods, revealing where money concentrates and where it leaks.

Google Sheets Accounting Template
  • Financial Components Driving Net Profit

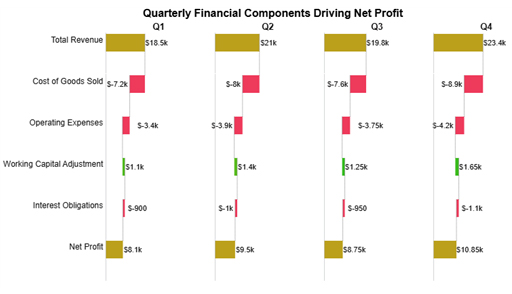
This view breaks net profit into its contributing factors, showing how revenue, direct costs, and adjustments each push the final figure up or down.

Google Sheets Accounting Template
  • Mileage Expense Distribution Across Business

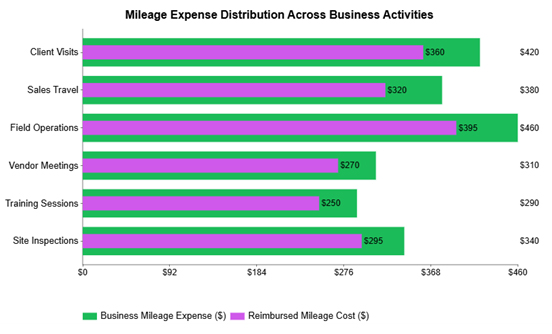
This chart compares actual mileage costs against reimbursements by department or function, making it straightforward to spot where cost recovery falls short.

Google Sheets Accounting Template
  • Project Cost Breakdown

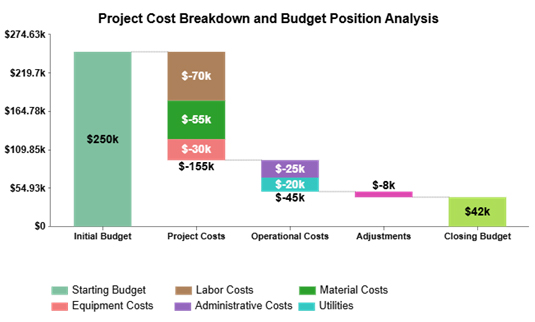
This view stacks individual cost components to show how each one contributes to the project total, directing attention to the largest drivers of expenditure.

Google Sheets Accounting Template
  • Activity-Level Cost Breakdown

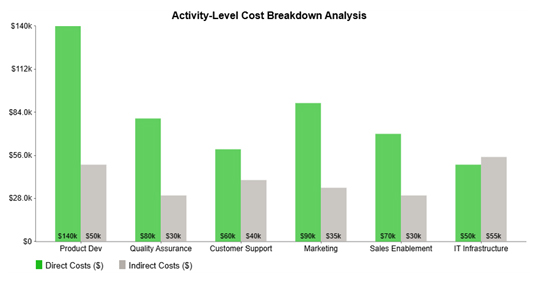
This chart places direct and indirect costs side by side for each business activity, making it easy to see which functions consume the most resources and where the cost mix shifts.

Google Sheets Accounting Template

How to Create a Google Sheets Accounting Template?

Building a Google Sheets Accounting Template from scratch requires fewer steps than most people expect. The process below walks through every key element, from opening a blank file to protecting the formulas that keep everything accurate.

  • Open Google Sheets and create a new spreadsheet: Open a blank spreadsheet and name it clearly so the file is easy to locate when needed.
  • Define income and expense categories: List every revenue type and cost category your business uses, a foundation that can later expand to support a debt tracker in Google Sheets.
  • Add columns for date, description, category, and amount: Set up columns that capture the key details of each entry so records stay consistent and searchable.
  • Insert formulas for totals and balances: Apply SUM, IF, and related functions to compute totals and net figures without repeated manual entry.
  • Create a summary dashboard with charts: Add a summary tab with charts that turn detailed transaction data into at-a-glance performance views.
  • Apply data validation and protect formula cells: Lock formula cells so they cannot be overwritten, a step that matters especially when adapting models like payroll spreadsheet templates.

How to Analyze an Accounting Template in Google Sheets?

Raw numbers inside a Google Sheets Accounting Template only become useful when examined with a clear method. The steps below outline a structured approach to getting meaningful insight from your financial data.

  1. Validate data consistency: Cross-check categories, running totals, and formula outputs to confirm your accounting template contains no data-entry errors or broken logic.
  2. Evaluate income and expense patterns: Study period-over-period shifts in revenue and costs, particularly when drawing on Google Finance in Google Sheets for live market data comparisons.
  3. Assess cash movement behavior: Review the timing and volume of receipts versus payments to identify liquidity risks and operational rhythm.
  4. Detect anomalies and outliers: Scan for values that deviate sharply from established patterns, as these often point to entry errors or transactions that warrant closer review.

Pairing your data with a visualization add-on takes the analysis further. Charting tools convert financial records into clear visual outputs that expose trends and outliers that a spreadsheet alone cannot highlight.

Why use ChartExpo?

  • Transforms raw financial data into polished, easy-to-read charts with minimal setup.
  • Surfaces spending trends and income patterns that flat tables tend to hide.
  • Connects directly to Google Sheets, so chart creation requires no data export or reformatting.
  • Comes with a 7-day free trial and a flat $10 per month subscription after that.

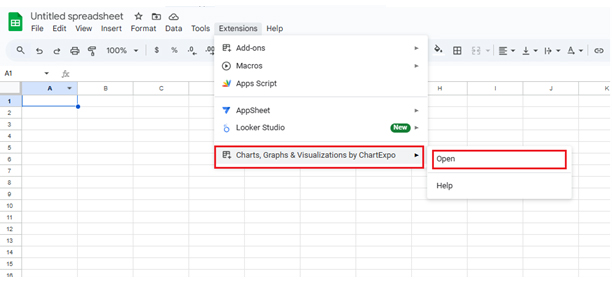
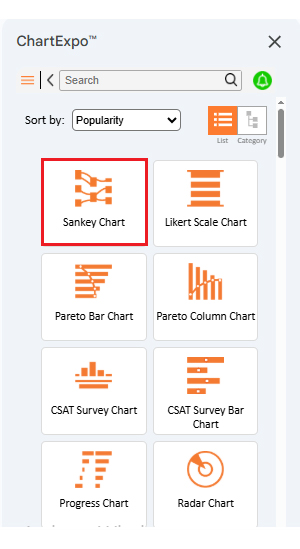
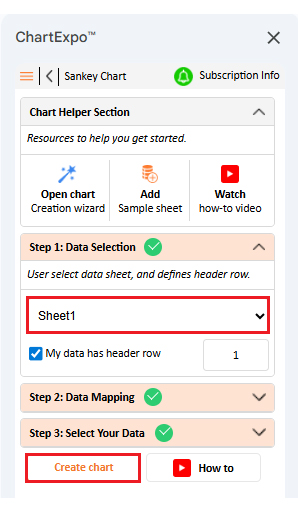
 How to install ChartExpo in Google Sheets?

  • Go to Google Sheets and open the file you are interested in. Then click on the Extensions tab in the upper menu.
  • Click on the Add-ons and enter “Get add-ons.”
  • Go to the Google Workspace Marketplace and search for ChartExpo.
  • Explore “Charts, Graphs & Visualizations by ChartExpo, and click the “Install” button.
  • Allow the necessary access and confirm your Google account when asked.

Example:

Consider we have the following data for a Sankey Chart.

Transaction Type Category Subcategory Payment Method Amount
Income Sales Revenue Online Sales Bank Transfer 18500
Income Sales Revenue In-Store Sales Credit Card 12400
Income Services Consulting Bank Transfer 8200
Income Other Income Interest Income Bank Deposit 600
Expense Operating Cost Salaries Bank Transfer 21000
Expense Operating Cost Office Rent Bank Transfer 7500
Expense Operating Cost Utilities Credit Card 1800
Expense Marketing Online Ads Credit Card 4200
Expense Marketing Events & Promotion Bank Transfer 2500
Expense Admin Software Tools Credit Card 2300
Expense Admin Insurance Bank Transfer 1600
Expense Taxes Income Tax Bank Transfer 5400
  • To get started with ChartExpo, install ChartExpo.
  • Go to Extensions > Charts, Graphs & Visualizations by ChartExpo > Open.
Google Sheets Accounting Template
  • Once ChartExpo is installed, click on the “Add new chart” button.
Google Sheets Accounting Template
  • Once it loads, scroll through the charts list to locate and choose the “Sankey Chart”.
Google Sheets Accounting Template
  • Then, select your worksheet and confirm the data range; your data is automatically mapped, and click on the “Create chart.”
Google Sheets Accounting Template
  • If you want to customize your chart, select the ‘Edit Chart’ option and design it to your specifications.
Google Sheets Accounting Template
  • To change the chart’s title, select the pencil icon on the header. Then, enter the text you want and select “Apply”.
Google Sheets Accounting Template
  • You can change bar colors by clicking the pencil icon, selecting the node, choosing a color, and clicking Apply to save the changes.
Google Sheets Accounting Template
  • When you are done with all the changes, click the “Save” button or follow the steps to save the changes to a Google Sheet.
Google Sheets Accounting Template
  • The final look of the Sankey Chart is shown below.
Google Sheets Accounting Template

Key Insights

  • At 54% of total cash movement, outgoings outpace receipts, putting the operation in a negative cash flow position.
  • Payroll represents the single biggest cost line, accounting for 24.42% of total expenses.
  • Revenue from sales leads all income streams at 35.93%, with online channels generating the majority of that figure at 21.51%.

How to Use and Download a Google Sheets Accounting Template?

Most users start with an existing template rather than building from scratch. The steps below cover the quickest path from discovery to a fully customized, working file.

  • Access Google Sheets template gallery: Open the built-in template gallery inside Google Sheets to review available accounting layouts.
  • Search for accounting or bookkeeping templates: Filter by purpose so you find a structure that matches your specific financial tracking needs.
  • Click “Use Template” to create a copy: Duplicate the chosen template to your Drive so edits do not change the source file for others.
  • Customize categories and formulas: Rename income and expense categories, and update any formulas that need to match your ledger structure.
  • Share with accountant or team members: Grant view or edit access to relevant stakeholders, a step that fits naturally into a Google Workspace for business.
  • Download as Excel or PDF if required: Save a copy as an Excel file or PDF whenever you need to share records outside Google’s ecosystem.

Benefits of Using a Google Sheets Accounting Template

A well-configured Google Sheets business accounting template does more than save time. It shifts the way a business operates by making financial information accessible, accurate, and actionable.

  • Cost-effective accounting solution: Delivers structured financial tracking at no software cost, freeing budget for other priorities.
  • Easy customization for business needs: Let users reshape the structure to suit any industry or internal reporting process.
  • Real-time collaboration and sharing: Enables simultaneous access and updates by multiple users.
  • Automated financial calculations: Reduce manual work and calculation errors.
  • Improved financial decision-making: Surfaces clear summaries that support faster, better-informed financial choices.
  • Accessible from any device: Allows secure access anytime with internet connectivity.

Tips for Creating a Google Sheets Accounting Template

Even a well-designed template underperforms when the underlying habits are weak. These practical tips help maintain accuracy and usability in your Google Sheets Accounting Template over time.

  • Keep category names consistent: Prevents mismatches in period-end reports by ensuring every transaction maps to the same label each time.
  • Use separate sheets for summaries: Keeps detailed entries and high-level summaries in separate tabs so neither clutters the other.
  • Protect formula cells: Locks cells that contain formulas so casual edits cannot break the logic the template depends on.
  • Apply conditional formatting: Color-codes cells automatically when values cross a set threshold, making problem areas visible at a glance.
  • Validate data entry fields: Sets rules on what each cell will accept so bad data is caught at the point of entry, not later during review.
  • Update records regularly: Keep the data current so any report or chart drawn from the template reflects the actual state of the business.

FAQs

Does Google Sheets have an accounting template?

Yes. Built-in template options cover basic bookkeeping and budgeting needs, and many users also build custom Google Sheets Accounting Template structures suited to their workflows.

How to create an accounting system in Google Sheets?

Begin by defining income and expense categories, then build data-entry columns for each transaction. Add formulas to automate totals, and round out the system with a summary dashboard using an accounting template in Google Sheets as the foundation.

Is a Google Sheets Accounting Template suitable for small businesses?

For most small businesses, yes. A Google Sheets Accounting Template handles expense tracking, revenue monitoring, and basic financial reporting without the overhead of dedicated accounting software.

Wrap Up

A Google Sheets Accounting Template provides the structure every financial tracking effort needs, from organized transaction records and automated calculations to period summaries and collaborative access. It removes the cost and complexity of dedicated software while keeping financial data visible, consistent, and ready for review at any point in the operating cycle.

Adding a visualization tool to the workflow takes analysis further by converting tabular data into charts that highlight spending patterns and income trends at a glance. Combined with regular updates, protected formulas, and disciplined category naming, these practices keep the template performing reliably as the business grows and financial needs evolve.

How much did you enjoy this article?

GSAd2
Start Free Trial!
160273

Related articles

next previous
Google Sheets12 min read

Google Spreadsheet Templates: You Can Use Today

Google spreadsheet templates simplify tracking, planning, and reporting. Click here to learn how to use them with examples, tips, visual tools, and more.

Google Sheets6 min read

Google Sheets Pie Chart: A Complete Visual Guide

Transform data into clear visuals with a Google Sheets Pie Chart. Learn setup steps, customization tricks, and tips to create charts that communicate fast.

Google Sheets8 min read

How to Make Progress Bar in Google Sheets: Step-by-Step

Create a Progress Bar in Google Sheets to track goals, tasks, and project completion visually. Follow our easy step-by-step guide with practical examples.

Google Sheets9 min read

Google Sheet Expense Tracker Template: A Complete Guide

Google Sheet Expense Tracker Template tracks income, bills, and categories in one sheet. Build totals, charts, and alerts. Read on!

Google Sheets11 min read

Google Workspace for Business to Turn Data into Insight

Google Workspace for Business offers secure tools for teams. Click here to see how smarter charts and features enhance efficiency and streamline operations.

ChartExpo logo

Turn Data into Visual
Stories

CHARTEXPO

  • Home
  • Gallery
  • Videos
  • Services
  • Pricing
  • Contact us
  • FAQs
  • Privacy policy
  • Terms of Service
  • Sitemap

TOOLS

  • ChartExpo for Google Sheets
  • ChartExpo for Microsoft Excel
  • Power BI Custom Visuals by ChartExpo
  • Word Cloud

CATEGORIES

  • Bar Charts
  • Circle Graphs
  • Column Charts
  • Combo Charts
  • Comparison Charts
  • Line Graphs
  • PPC Charts
  • Sentiment Analysis Charts
  • Survey Charts

TOP CHARTS

  • Sankey Diagram
  • Likert Scale Chart
  • Comparison Bar Chart
  • Pareto Chart
  • Funnel Chart
  • Gauge Chart
  • Radar Chart
  • Radial Bar Chart
  • Sunburst Chart
  • see more
  • Scatter Plot Chart
  • CSAT Survey Bar Chart
  • CSAT Survey Chart
  • Dot Plot Chart
  • Double Bar Graph
  • Matrix Chart
  • Multi Axis Line Chart
  • Overlapping Bar Chart
  • Control Chart
  • Slope Chart
  • Clustered Bar Chart
  • Clustered Column Chart
  • Box and Whisker Plot
  • Tornado Chart
  • Waterfall Chart
  • Word Cloud
  • see less

RESOURCES

  • Blog
  • Resources
  • YouTube
SIGN UP FOR UPDATES

We wouldn't dream of spamming you or selling your info.

© 2026 ChartExpo, all rights reserved.