Categories
What if the answer to keeping your business alive was hidden in a cash flow forecasting template? This blog post will help you find out.
Many companies fail, not because they lack customers, but because they run out of cash. Money moves faster than most expect. Sales come in, bills go out, and without a clear plan, chaos follows.


A simple cash flow forecasting template can transform numbers on a screen into a living map of survival. It shows whether you can cover payroll next month or expand operations with confidence. This is where smart planning outshines unquestioning optimism.
Consider this: a small company using forecasting in Google Sheets can identify cash gaps weeks in advance. Then negotiate with suppliers before the crunch hits. This turns uncertainty into foresight. Pair that with cash flow forecasting, and you can easily model different scenarios. What happens if sales dip? What if expenses spike? You see the answer instantly.
Cash flow is not abstract. It is the daily pulse of your company. A growing startup may chase big funding, but without visibility into cash flow, ambition turns risky.
The right tools keep the dream alive. Therefore, a cash flow forecasting template is not a luxury. It is the difference between growth and struggle. And the good news? Anyone can master it with clear examples, smart visuals, and simple tools inside Google Sheets.
Definition: A cash flow forecasting template in Google Sheets helps track money coming in and out. It organizes income, expenses, and savings in one convenient location. Businesses use it to predict future cash positions. This supports better planning and decision-making. It is helpful for financial forecasting for startups as it shows whether funds will cover costs.
The template is flexible and easy to update. You can compare projections with actual results for clarity and accuracy. It works well with a balance sheet template in Google Sheets to give a full financial view. This tool guides stability and growth.
A cash flow projection template in Google Sheets illuminates the financial landscape, making the road ahead clearer. It gives you confidence to plan, grow, and avoid surprises.
Why?
A cash flow projection format in Google Sheets is not just numbers on a page. It tells you where money comes from, where it goes, and what remains. This clarity is the foundation of strong planning and smarter business forecasting.
Creating a cash flow forecast doesn’t have to feel overwhelming. With Google Sheets, the process becomes simple, visual, and adaptable. By combining it with tools such as a balance sheet template in Google Sheets, you gain a comprehensive view of your financial health. The steps below make the process clear and actionable.
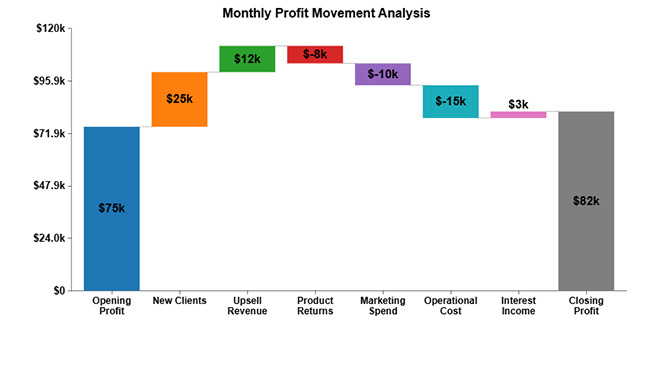
Every business has moments of doubt about money. Will there be enough to pay salaries next month? Can new equipment be purchased without risk? This is where a cash flow forecast example in Google Sheets comes alive. It shows the story of money in motion with clarity and simplicity.
Here are the examples:
Here are templates with examples:
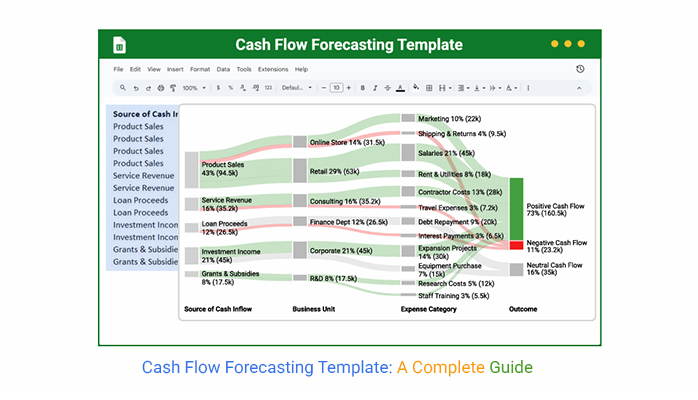
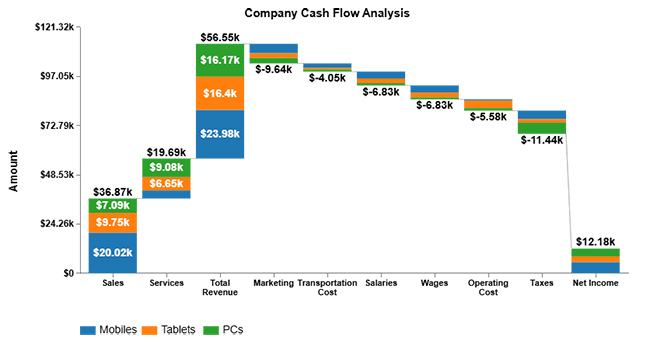
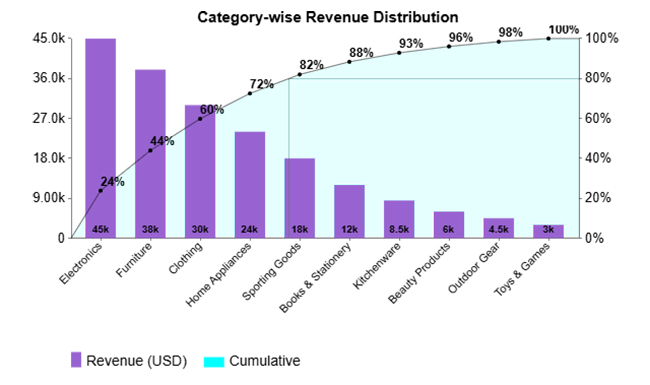
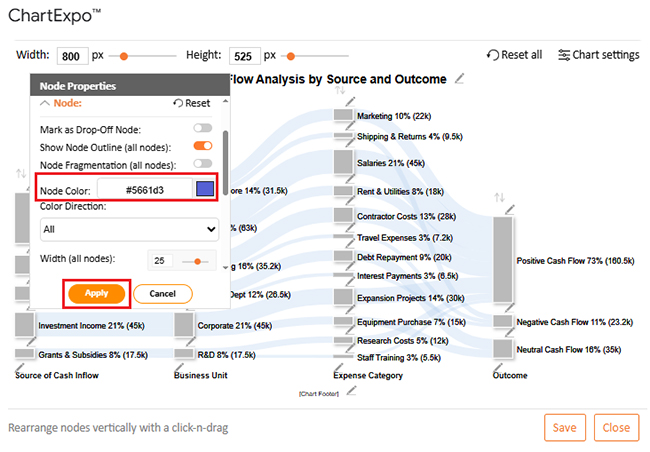
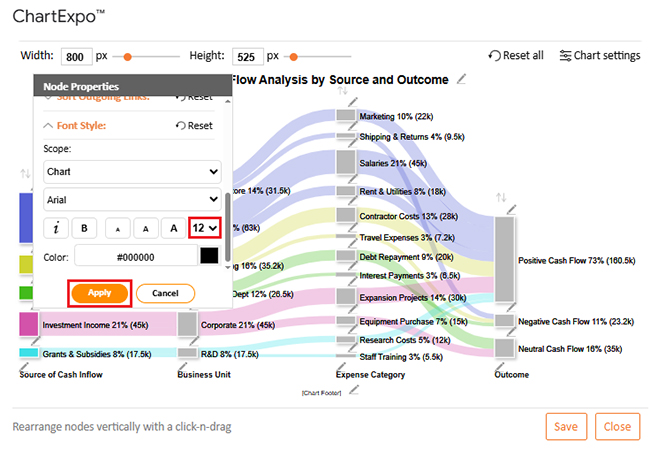
Numbers alone rarely tell the full story. With the right visuals, cash flow forecasts in Google Sheets become clear and actionable. ChartExpo makes this easy by turning raw data into powerful insights. Whether you are working on a sales forecast example or applying time series forecasting, visuals reveal patterns that tables cannot.
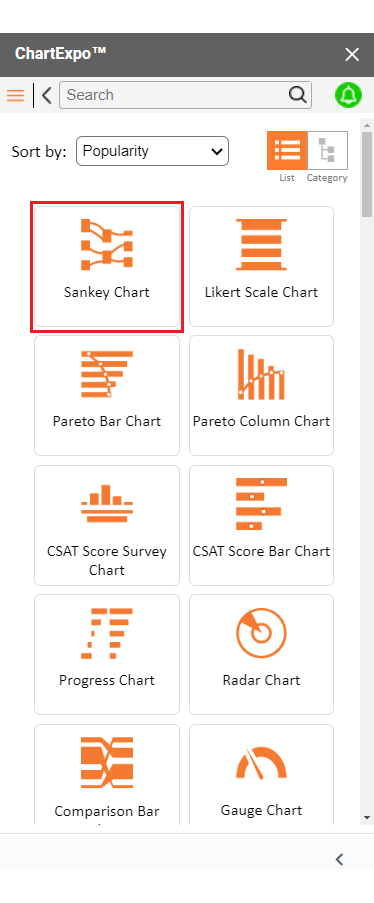
Here are the top charts to use:
Money talks, but spreadsheets often mumble. Excel can crunch numbers, but when it comes to visuals, it leaves you squinting at clunky charts. Data deserves better storytelling, and that is where Google Sheets and smart tools step in.
Data visualization is the secret ingredient that makes cash flow forecasting clear and convincing. Instead of staring at endless rows, you can see patterns at a glance. ChartExpo takes this further by turning flat data into visuals that actually speak. It bridges the gap that Excel leaves open, making forecasting accurate and engaging.
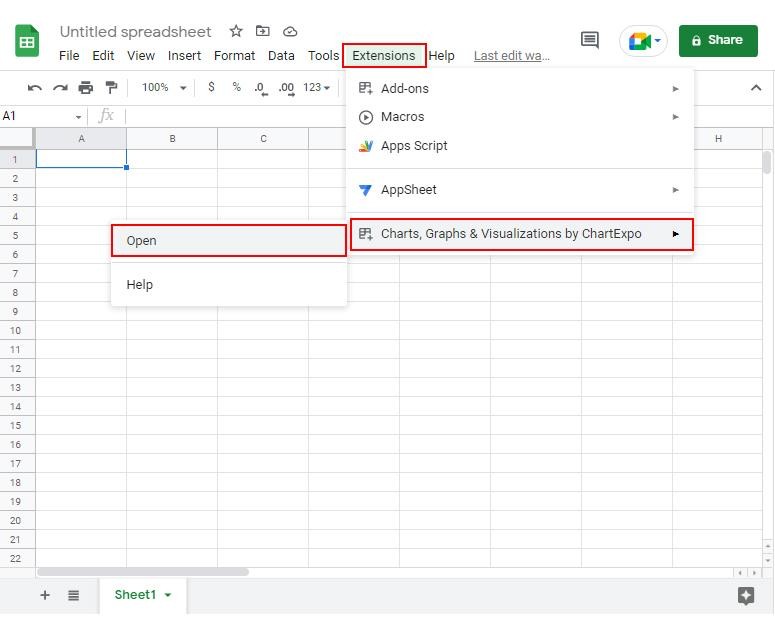
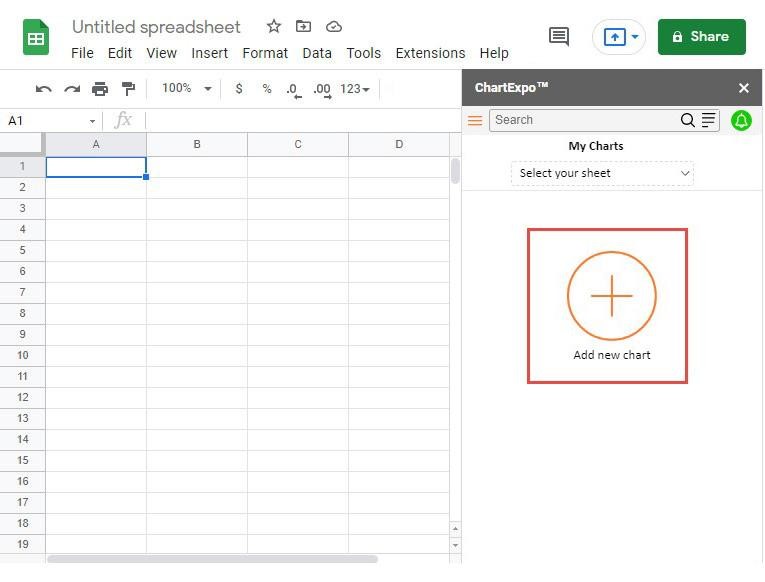
How to Install ChartExpo in Google Sheets?
ChartExpo charts are available both in Google Sheets and Microsoft Excel. Please use the following CTAs to install the tool of your choice and create beautiful visualizations in a few clicks in your favorite tool.
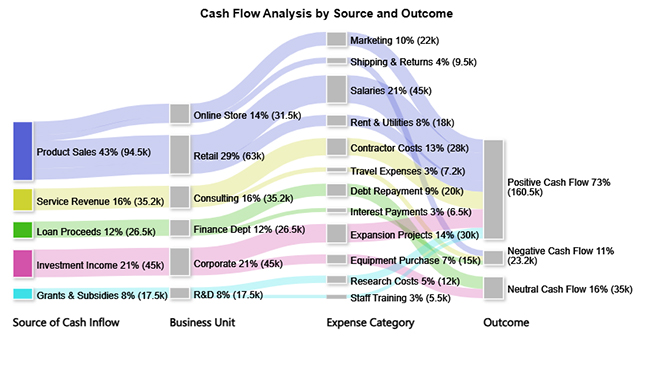
Let’s analyze the cash flow sample data below in Google Sheets using ChartExpo.
| Source of Cash Inflow | Business Unit | Expense Category | Outcome | Amount (USD) |
| Product Sales | Retail | Salaries | Positive Cash Flow | 45,000 |
| Product Sales | Retail | Rent & Utilities | Positive Cash Flow | 18,000 |
| Product Sales | Online Store | Marketing | Positive Cash Flow | 22,000 |
| Product Sales | Online Store | Shipping & Returns | Negative Cash Flow | 9,500 |
| Service Revenue | Consulting | Contractor Costs | Positive Cash Flow | 28,000 |
| Service Revenue | Consulting | Travel Expenses | Negative Cash Flow | 7,200 |
| Loan Proceeds | Finance Dept | Debt Repayment | Neutral Cash Flow | 20,000 |
| Loan Proceeds | Finance Dept | Interest Payments | Negative Cash Flow | 6,500 |
| Investment Income | Corporate | Expansion Projects | Positive Cash Flow | 30,000 |
| Investment Income | Corporate | Equipment Purchase | Neutral Cash Flow | 15,000 |
| Grants & Subsidies | R&D | Research Costs | Positive Cash Flow | 12,000 |
| Grants & Subsidies | R&D | Staff Training | Positive Cash Flow | 5,500 |
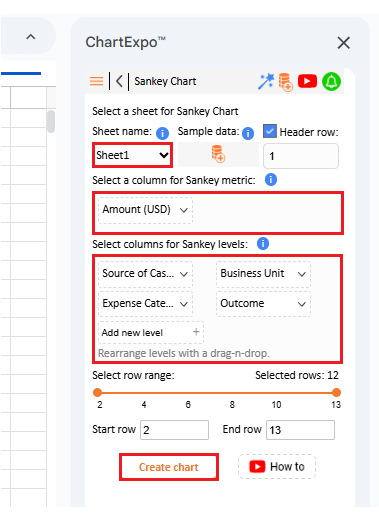
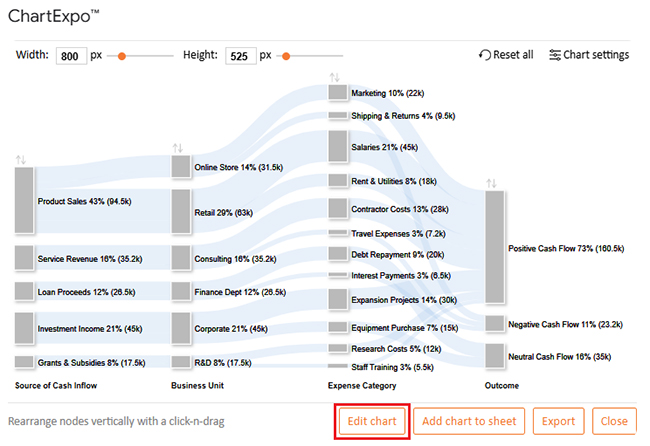
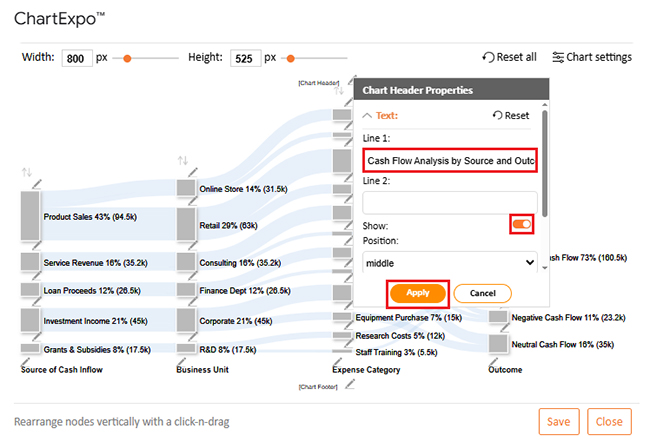
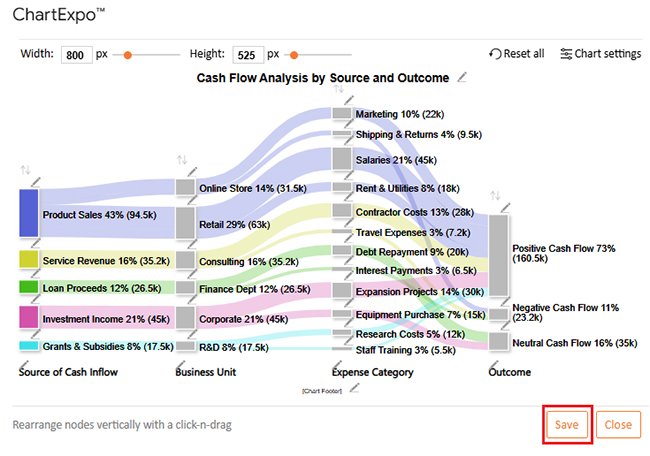

Managing money feels overwhelming until you see it laid out clearly. A cash flow forecasting template in Google Sheets turns scattered numbers into a plan you can trust. Follow these steps to get started with this template:
No tool is perfect. A cash flow forecasting template in Google Sheets has limitations that you should be aware of. Understanding these will help you use it wisely and avoid any surprises.
A template on its own does not guarantee better results. The value comes from how you use it, how often you update it, and how carefully you read the numbers. A cash flow forecasting template in Google Sheets can guide your decisions, but only if you work with it consistently.
Here are some simple tips to follow:
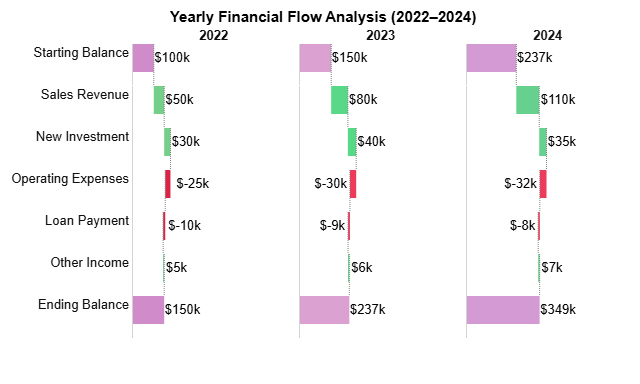
A 3-way cash flow forecast connects profit and loss, balance sheet, and cash flow. It shows how income, expenses, and assets interact. This forecast offers a comprehensive financial overview, enabling businesses to plan with confidence.
Cash flow forecasting is not complicated when you have the right tools. With Google Sheets, you can turn raw numbers into clarity. Templates make the process structured, while examples and visuals bring the data to life.
A sales forecast example illustrates how revenue is generated. Pairing it with expense tracking reveals where money goes. Together, they form a story that helps you act wisely. Numbers stop being random and start guiding decisions.
A balance sheet template in Google Sheets adds another layer of insight. It connects assets and liabilities to your cash flow. You see the full picture, not just part of it. This keeps planning grounded in reality.
An operating budget spreadsheet works well in conjunction with cash flow forecasts. It allows you to compare planned expenses with actual outcomes. This makes managing finances proactive rather than reactive. Surprises become less frequent as confidence grows.
For smaller companies, bookkeeping spreadsheets are a practical solution for managing finances. They track daily activity and feed accurate data into your forecast. Clean records mean better insights, and better insights mean better decisions.
Conclusively, ChartExpo in Google Sheets transforms flat tables into clear, interactive charts. It helps you spot trends instantly and share results with ease.
So, do not hesitate. Install ChartExpo today and start using it right away. Your forecasts will be sharper, your planning will be more effective, and your business will be better prepared for growth.
How much did you enjoy this article?


Calculate accounts receivable turnover ratio to measure credit collection speed, improve cash flow, and strengthen your financial strategy. Read on!

Change Management KPIs are the key to tracking adoption, performance, and ROI during transitions. Find out which metrics matter. Read on!

Data collection methods and techniques determine the quality of every insight you act on. Explore key approaches for gathering reliable data. Read on!


