• Home
  • Tools dropdown img
    • Spreadsheet Charts

      • ChartExpo for Google Sheets
      • ChartExpo for Microsoft Excel
    • Power BI Charts

      • Power BI Custom Visuals by ChartExpo
    • Word Cloud

  • Charts dropdown img
    • Chart Category

      • Bar Charts
      • Circle Graphs
      • Column Charts
      • Combo Charts
      • Comparison Charts
      • Line Graphs
      • PPC Charts
      • Sentiment Analysis Charts
      • Survey Charts
    • Chart Type

      • Box and Whisker Plot
      • Clustered Bar Chart
      • Clustered Column Chart
      • Comparison Bar Chart
      • Control Chart
      • CSAT Survey Bar Chart
      • CSAT Survey Chart
      • Dot Plot Chart
      • Double Bar Graph
      • Funnel Chart
      • Gauge Chart
      • Likert Scale Chart
      • Matrix Chart
      • Multi Axis Line Chart
      • Overlapping Bar Chart
      • Pareto Chart
      • Radar Chart
      • Radial Bar Chart
      • Sankey Diagram
      • Scatter Plot Chart
      • Slope Chart
      • Sunburst Chart
      • Tornado Chart
      • Waterfall Chart
      • Word Cloud
    • Google Sheets
      Microsoft Excel
  • Services
  • Pricing
  • Contact us
  • Blog
  • Support dropdown img
      • Gallery
      • Videos
      • Contact us
      • FAQs
      • Resources
    • Please feel free to contact us

      atsupport@chartexpo.com

Categories
All Data Visualizations Data Analytics Surveys
Add-ons/
  • Google Sheets
  • Microsoft Excel
  • Power BI
All Data Visualizations Data Analytics Surveys
Add-ons
  • Google Sheets
  • Microsoft Excel
  • Power BI

We use cookies

This website uses cookies to provide better user experience and user's session management.
By continuing visiting this website you consent the use of these cookies.

Ok

ChartExpo Survey


Home > Blog > Google Sheets

Google Workspace for Business to Turn Data into Insight

What if Google Workspace for Business were less about emails and calendars and more about sharper decisions? That’s what we’ll discuss in this blog post. Tools that don’t just manage work but drive it forward.

Google Workspace for Business

As of January 2025, over 10 million paying businesses trusted Google Workspace to run daily operations. And that’s not all. This number grows every quarter. Why? Because simplicity scales, and speed wins.

Teams thrive on clarity. A project manager can connect meetings, spreadsheets, and reports in minutes. Sales leaders can predict growth using forecasting in Google Sheets without external software. Moreover, HR departments can run a survey in Google Sheets and analyze responses instantly. These are not fancy extras. They are practical moves that save hours each week.

But the magic isn’t in using one app at a time. It’s in the connections. Data flows seamlessly from Sheets to Docs, meetings sync across global teams in real-time, and charts update automatically without manual intervention. Every click feels lighter, and every workflow smoother.

So, is Google Workspace for Business only about cloud storage and Gmail? Not anymore. It is about efficiency that compounds. It is about transforming numbers into stories and meetings into actions. The question isn’t whether you should explore Google Workspace for Business. The question is how fast you can start.

Follow my lead…

Table of Contents:

  1. What is Google Workspace for Business?
  2. Why Use Google Workspace for Small Businesses?
  3. How to Create a Google Workspace Business Account?
  4. Simple Way to Visualize Business Data in G Suite
  5. Benefits of Using Google Suite for Business
  6. Limitations of Google Workspace for Business
  7. FAQs
  8. Wrap Up

What is Google Workspace for Business?

Definition: Google Workspace for Business is a cloud-based suite that consolidates work tools. It includes Gmail, Drive, Docs, Sheets, Meet, and more. Teams use it to collaborate in real-time from anywhere; files update instantly, and communication flows faster.

Companies rely on Google Workspace to boost productivity and reduce wasted effort. The power lies in smart integrations. For example, managers can run a survey in Google Sheets and quickly analyze the results.

Businesses can also explore the Google Workspace marketplace to add specialized apps. The platform scales with small teams and global enterprises. It is simple, flexible, and built for growth.

Why Use Google Workspace for Small Businesses?

Running a small business means every decision counts. Time, money, and focus are always in short supply. So, the right tools can make the difference between growth and overwhelm.

Google Workspace features help small businesses simplify daily work and connect everything in one place. From smarter scheduling to financial insights, it brings clarity and efficiency to teams of all sizes.

Here is how:

  • Shared calendars: Everyone stays on the same page when schedules are visible. Meetings are easy to set, deadlines are clear, and teams avoid the messy back-and-forth of endless emails.
  • Cloud storage: Business files reside in a single, secure space, making them easy to access and share. Whether in the office or working remotely, employees can always open the latest version without confusion.
  • Collaboration tools: Docs and Sheets enable multiple people to work together in real-time. Changes show up instantly, keeping projects moving smoothly without delays or bottlenecks.
  • Google Finance in Google Sheets: Business owners can bring live financial data straight into their spreadsheets. This makes tracking sales and market trends simpler while supporting smarter, data-driven decisions.

How to Create a Google Workspace Business Account?

Starting a business account can feel overwhelming. The good news is that setting up Google Workspace for business is simple. You do not need to be a tech expert. All you need is a clear goal and a few minutes. With the right setup, your team can enjoy smarter tools from day one.

Follow these steps:

  1. Visit the website: Go to the official Google Workspace site and click on “Get Started”. This opens the setup wizard that guides you through the process.
  2. Enter your business details: Type in your company name and the number of employees. Google uses this to customize the setup for your team size.
  3. Add a domain name: Enter your existing business domain to create professional email addresses. You can purchase a new domain directly from Google if you don’t have one.
  4. Create your user account: Set up the first email address, which becomes your admin account. This account will be used to manage all settings and users.
  5. Choose a plan: Select the pricing plan that matches your business needs. After payment, you can invite your team to join and start exploring Google Workspace features immediately.

Top 10 ChartExpo Visuals in G Suite for Business

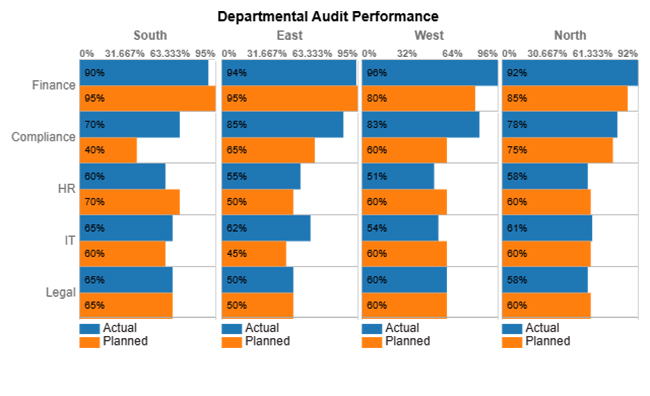
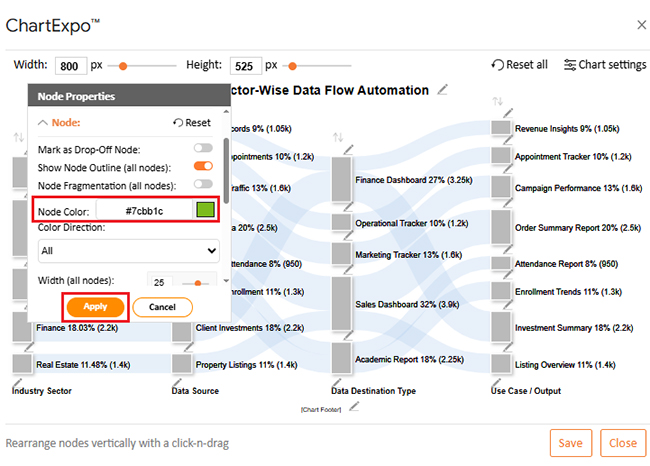
Spreadsheets hold valuable data, but numbers alone rarely tell the full story. Charts turn that data into insights people can actually act on. With ChartExpo in Google Sheets, businesses can go beyond basic graphs and create visuals that explain trends, comparisons, and outcomes.

Whether tracking performance, managing budgets, or analyzing growth, these visuals make decision-making faster and clearer.

  • Horizontal Waterfall Chart: This chart shows how revenues and expenses impact outcomes such as profit. It is perfect for analyzing budgets and comparing regions in Google Workspace for Business.
Google Workspace for Business
  • Performance Trends Chart: It tracks sales, customer satisfaction, or other key metrics over time. Teams can quickly identify growth patterns and areas for improvement.
Google Workspace for Business
  • Scatter Plot Chart: This chart compares multiple variables, such as revenue and growth rate. It helps uncover hidden patterns within a business.
Google Workspace for Business
  • Vertical Waterfall Chart: It highlights how sales, costs, and savings affect revenue step by step. Businesses use it to track profitability.
Google Workspace for Business
  • Comparison Bar Chart: This chart compares KPIs to show how priorities change. Teams see performance flows at a glance.
Google Workspace for Business
  • Clustered Bar Chart: It places two values side by side, such as planned versus actual time. This helps managers in the Google Workspace track project efficiency.
Google Workspace for Business
  • Progress Circle Chart: This chart tracks KPIs such as retention or satisfaction in a visual circle. It makes reporting in Google engaging and easy to read.
Google Workspace for Business
  • Matrix Chart: A Matrix Chart compares planned and actual performance across regions or departments. It helps teams track accountability more effectively.
Google Workspace for Business
  • Overlapping Bar Chart: This chart shows two datasets, such as targets and actuals, on top of each other. It makes benchmarking in Google Workspace for Business simple and visual.
Google Workspace for Business
  • Sankey Chart: It maps how data flows between categories using connected paths. Businesses in Google Workspace use it to visualize processes, such as revenue movement.
Google Workspace for Business

Simple Way to Visualize Business Data in G Suite

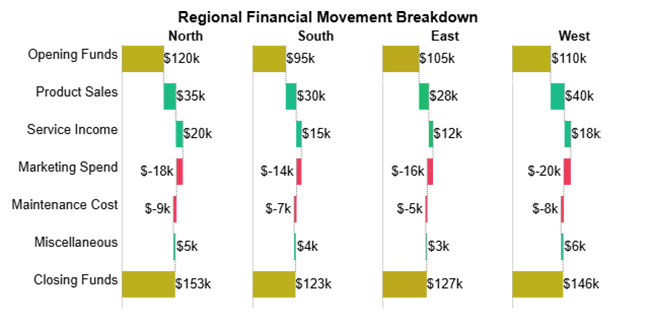
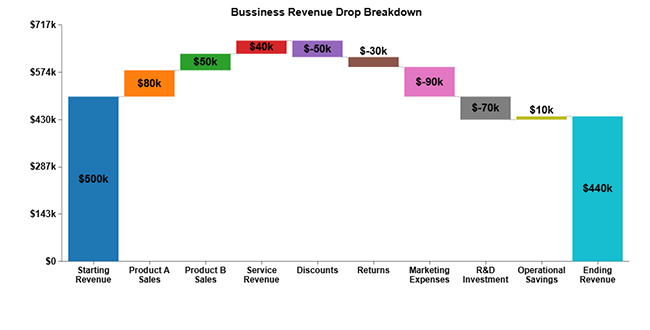
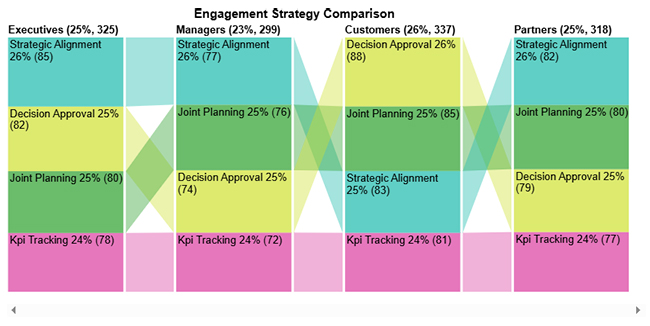
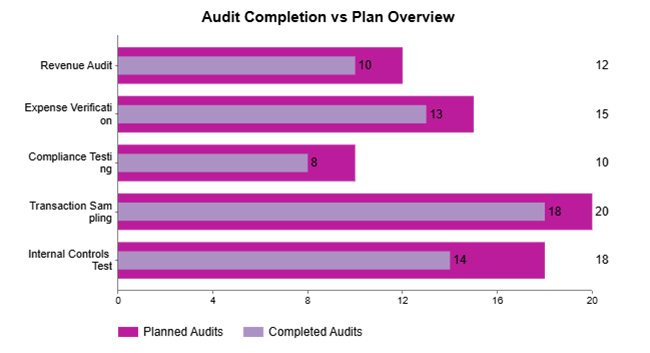
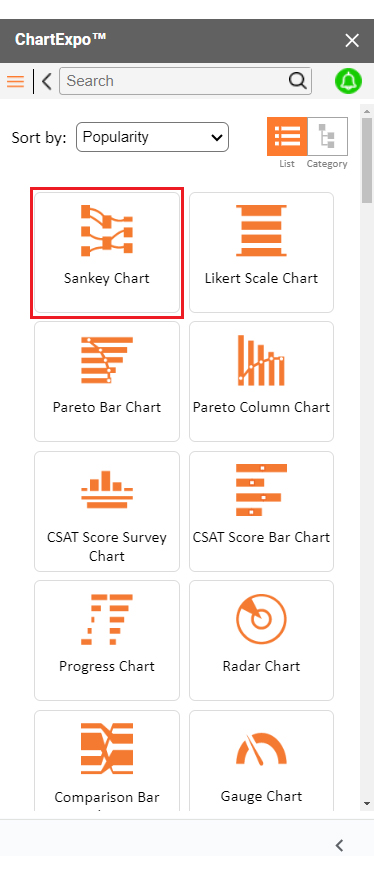
Spreadsheets may crunch numbers, but they rarely win hearts. Data without visuals is like a story without color. This is where ChartExpo steps in. It transforms raw data into visuals that speak louder than rows and columns. From waterfalls to Sankey flows, it turns analysis into insight.

Smarter tools create smarter charts, and that is the difference between working with data and truly understanding it.

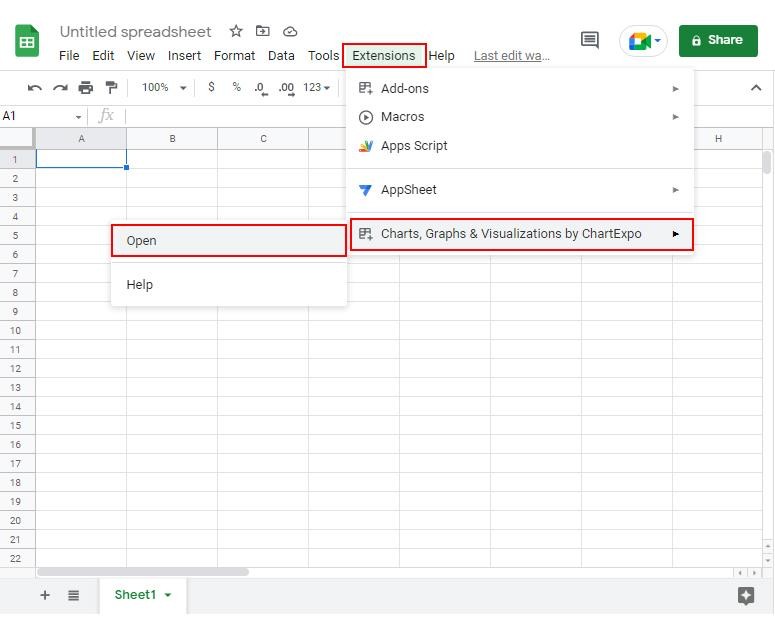
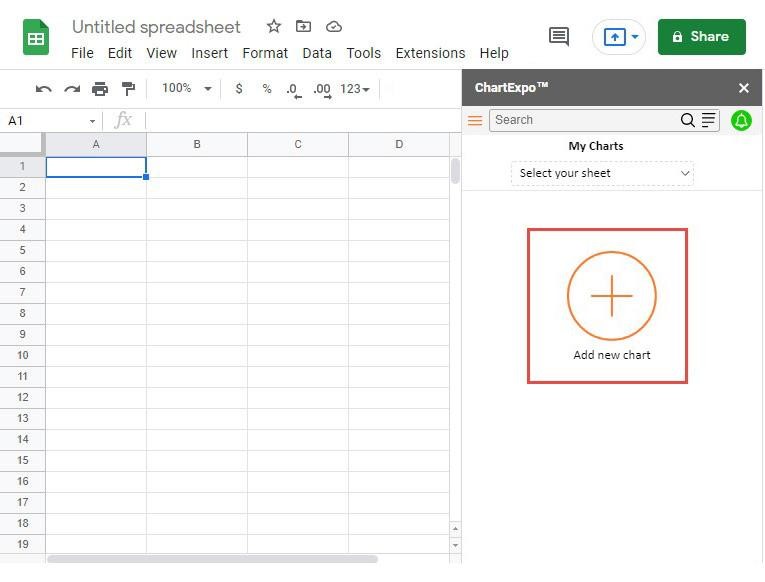
How to Install ChartExpo in Google Sheets?

  1. To start using ChartExpo, download it directly from the Google Sheets program. To do this, select Extensions from the top toolbar.
  2. A menu will appear. Click the Get add-ons option.
  3. Search for ChartExpo, and click on Charts, Graphs & Visualizations by ChartExpo when it appears in the results.
  4. Click the Install button. You will have to confirm your Google account and accept some permissions.

ChartExpo charts are available both in Google Sheets and Microsoft Excel. Please use the following CTAs to install your chosen tool and create beautiful visualizations in a few clicks in your favorite tool.

Example

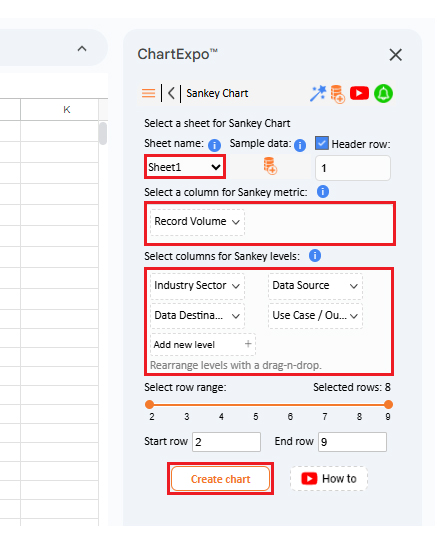
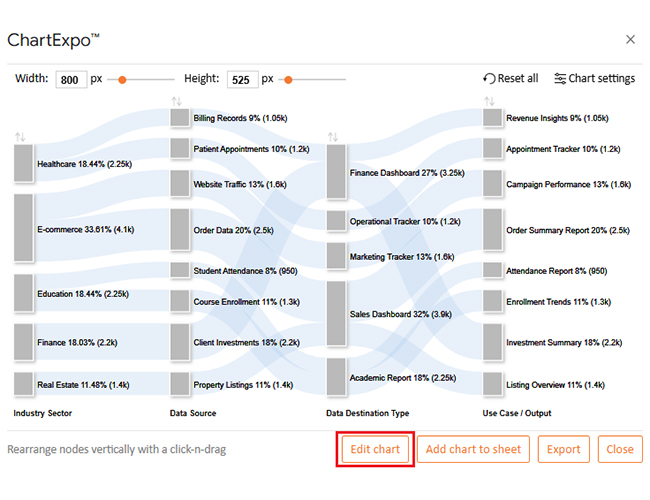
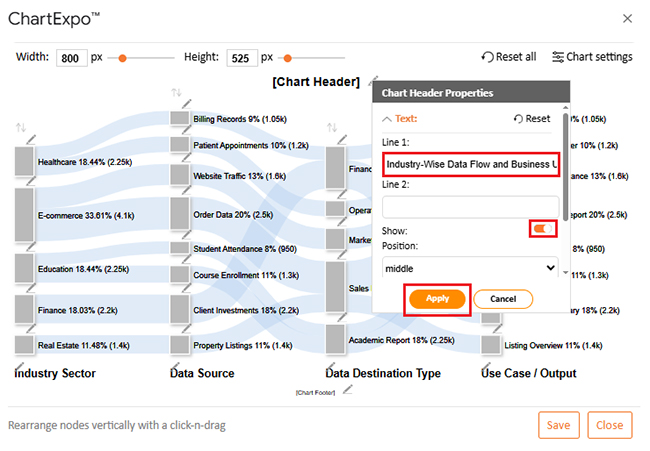
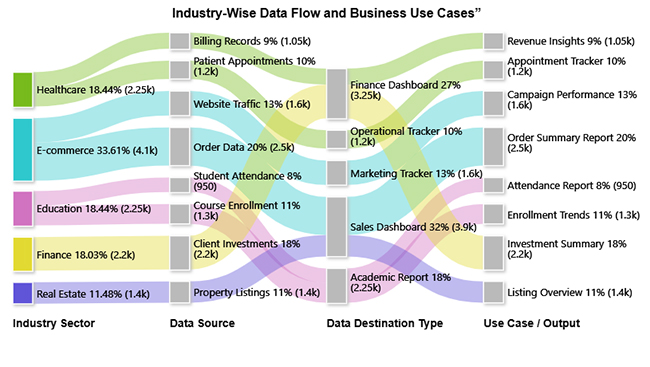
Let’s analyze this sample data in Google Sheets using ChartExpo.

Industry Sector

Data Source Data Destination Type Use Case / Output

Record Volume

Healthcare Patient Appointments Operational Tracker Appointment Tracker 1,200
Healthcare Billing Records Finance Dashboard Revenue Insights 1,050
E-commerce Order Data Sales Dashboard Order Summary Report 2,500
E-commerce Website Traffic Marketing Tracker Campaign Performance 1,600
Education Student Attendance Academic Report Attendance Report 950
Education Course Enrollment Academic Report Enrollment Trends 1,300
Finance Client Investments Finance Dashboard Investment Summary 2,200
Real Estate Property Listings Sales Dashboard Listing Overview 1,400
  • To get started with ChartExpo, install ChartExpo in Google Sheets.
  • Go to Extensions > Charts, Graphs & Visualizations by ChartExpo > Open.
Google Workspace for Business
  • To access the charts library, click the Add new chart button.
Google Workspace for Business
  • Once ChartExpo is loaded. Click on “Sankey Chart”.
Google Workspace for Business
  • Put the data table in the sheet first. Then, choose the Sheet name from the drop-down in the ChartExpo section.
  • Select the metric column; metric is the numeric column in your data sheet.
  • Select the dimensions column; the dimension is the categorical column in your datasheet that contains text information.
  • Click the Create chart button to complete the process.
Google Workspace for Business
  • ChartExpo will generate the visualization below for you.
Google Workspace for Business
  • If you want to have the chart’s title, click Edit Chart, as shown in the above image.
  • Click the pencil icon next to the Chart Header to change the title.
  • It will open the properties dialog. Under the Text section, you can add a heading in Line 1 and enable Show.
  • Give the appropriate title of your chart and click the Apply button.
Google Workspace for Business
  • You can add color in Nodes and set the direction as follows:
Google Workspace for Business
  • You can increase font size for better readability:
Google Workspace for Business
  • Click the “Save Changes” button to persist the changes.
Google Workspace for Business
  • Your final chart will appear as follows.
Google Workspace for Business

Insights

  • E-commerce: Has the largest share at 33.61%, focused on sales dashboards and order summaries.
  • Healthcare and Education: Each holds 18.44%, using finance dashboards, operational trackers, and academic reports.
  • Finance: Contributes 18.03%, mainly for investment summaries and finance dashboards.
  • Real Estate: Smallest share at 11.48%, centered on sales dashboards and listing overviews.

Benefits of Using Google Suite for Business

Running a business is easier when everything connects in one place. Google Suite brings communication, data, and collaboration together, enabling teams to work smarter. It saves time, improves efficiency, and helps people focus on results instead of routine tasks.

How?

  • Seamless collaboration: Teams can edit documents, spreadsheets, and presentations together in real time. Everyone stays aligned without messy email threads.
  • Smarter data analysis: With Google Finance in Google Sheets, companies can track live financial trends. This enables leaders to make informed decisions more quickly.
  • Automation and efficiency: Businesses can enhance workflows using Google Sheets add-ons. These tools reduce repetitive work and make reporting simple.
  • Flexibility across industries: Whether small or large, organizations can adapt the suite to their needs. It scales easily as teams grow.
  • Better time management: Shared calendars and connected apps help employees manage time effectively. Projects move smoothly, and deadlines are easier to meet.

Limitations of Google Workspace for Business

No business tool is flawless. Google Workspace for Business makes work easier, but it still has certain limitations. Knowing these helps teams prepare better and find the right add-ons or external tools to fill the gaps:

  • Advanced needs remain unmet: Standard apps cover daily tasks well. However, companies often want deeper customization that is not always available.
  • Marketplace limits: The Google Workspace Marketplace offers a wide range of apps. Yet it cannot always provide specialized solutions for highly unique workflows.
  • Spreadsheet struggles: Large datasets in Sheets can slow down or break formulas. Even functions such as Google Sheets’ transpose can feel limited when dealing with heavy reporting.
  • Time tracking gaps: Businesses want accurate productivity insights. While Google Sheets time tracking helps, it lacks the automation and smooth experience of dedicated tools.
  • Industry-specific challenges: Sectors such as schools have successfully adopted Google Workspace for Education. However, some institutions need extra platforms for compliance or specialized reporting.

FAQs

What is Google Workspace used for in business?

Google Workspace for Business is used for communication, collaboration, and data management. Teams share files, edit documents, and track projects in real time. It improves productivity, streamlines workflows, and keeps everyone connected from anywhere.

How much does Google Workspace cost for businesses?

Pricing for Google Workspace for Business starts at approximately $6 per user per month. Costs rise with advanced features, storage, and security options. Plans scale to fit small startups or large enterprises with flexible needs.

Wrap Up

Data should not be confusing. It should guide. Google Workspace for Business gives teams the tools to connect, share, and grow. Yet, true clarity comes when numbers are transformed into visuals that everyone understands.

Spreadsheets alone can feel heavy. Functions such as Google Sheets transpose make rearranging data easier, but the charts often fall short. Teams need more than simple bars and lines. They need visuals that explain stories at a glance.

This is where ChartExpo changes the game. It integrates smoothly with Google Sheets and fills the gaps left behind by this spreadsheet tool. With one click, raw numbers transform into meaningful visuals, and complex data becomes simple and ready for action.

The benefits extend across industries. Schools using Google Workspace for Education can track academic performance with clear charts. Managers can use Google Sheets time tracking to follow productivity with more precision. Moreover, finance teams can evaluate trends without losing hours in manual formatting.

Customization is another advantage. Through the Google Workspace marketplace, businesses can add ChartExpo and start building advanced visuals instantly. It is flexible, fast, and designed for individuals who want to spend less time fixing spreadsheets and more time making informed decisions.

The conclusion is simple. Data is powerful only if you can see it clearly. Google Workspace for Business gives the foundation, but ChartExpo makes it shine.

So, do not hesitate…

Install ChartExpo today and turn your Google Sheets into a smarter, more visual workspace. Let your charts do the talking.

How much did you enjoy this article?

GSAd2
Start Free Trial!
158727

Related articles

next previous
Google Sheets10 min read

Data Analysis in Google Sheets: Best Ways to Show Insights

Discover how data analysis in Google Sheets transforms raw spreadsheets into clear insights with pivot tables, charts, formulas, and built-in AI tools.

Google Sheets11 min read

Small Business Budget Spreadsheet: A Complete Guide

A small business budget template tracks income and cash flow. Learn pros and cons, and best practices to manage budgets effectively in Google Sheets.

Google Sheets13 min read

Real Estate Investment Spreadsheet for Property Insights

A real estate investment spreadsheet tracks income, expenses, and ROI. This blog offers sample templates and tips to enhance property investment decisions.

Google Sheets13 min read

Sales Projection Template in Google Sheets for Clear Insights

A sales projection template helps predict revenue with clarity. Learn best practices, examples, and tips in Google Sheets to improve planning and growth.

Google Sheets11 min read

Google Sheets Apps for Presentable Insights

Google Sheets apps boost productivity with smarter data handling. Click here to learn how to use them for better charts, faster analysis, and smarter decisions.

ChartExpo logo

Turn Data into Visual
Stories

CHARTEXPO

  • Home
  • Gallery
  • Videos
  • Services
  • Pricing
  • Contact us
  • FAQs
  • Privacy policy
  • Terms of Service
  • Sitemap

TOOLS

  • ChartExpo for Google Sheets
  • ChartExpo for Microsoft Excel
  • Power BI Custom Visuals by ChartExpo
  • Word Cloud

CATEGORIES

  • Bar Charts
  • Circle Graphs
  • Column Charts
  • Combo Charts
  • Comparison Charts
  • Line Graphs
  • PPC Charts
  • Sentiment Analysis Charts
  • Survey Charts

TOP CHARTS

  • Sankey Diagram
  • Likert Scale Chart
  • Comparison Bar Chart
  • Pareto Chart
  • Funnel Chart
  • Gauge Chart
  • Radar Chart
  • Radial Bar Chart
  • Sunburst Chart
  • see more
  • Scatter Plot Chart
  • CSAT Survey Bar Chart
  • CSAT Survey Chart
  • Dot Plot Chart
  • Double Bar Graph
  • Matrix Chart
  • Multi Axis Line Chart
  • Overlapping Bar Chart
  • Control Chart
  • Slope Chart
  • Clustered Bar Chart
  • Clustered Column Chart
  • Box and Whisker Plot
  • Tornado Chart
  • Waterfall Chart
  • Word Cloud
  • see less

RESOURCES

  • Blog
  • Resources
  • YouTube
SIGN UP FOR UPDATES

We wouldn't dream of spamming you or selling your info.

© 2026 ChartExpo, all rights reserved.