Categories
Google Sheets Transpose—what does it do, and why is it useful? This simple function flips rows into columns and columns into rows, making data easier to manage. Instead of manually rearranging cells, a single formula does the job instantly.


Data organization is crucial for accurate analysis. Google Sheets Transpose helps you clean up spreadsheets and present data in a more structured way. Whether you’re working on a budget on Google Sheets or managing sales reports, formatting matters. Clear data makes decision-making faster and more effective.
Many businesses rely on spreadsheets for financial planning. A disorganized sheet slows down work and increases errors. Using Google Sheets Transpose, teams can quickly restructure data for better readability. This is especially helpful when pulling data from different sources.
Large datasets often require combining multiple sheets. Functions like VLOOKUP for Google Sheets help fetch specific values, but properly arranging them is key. With Transpose, you can format data before applying complex formulas, improving accuracy and saving time.
Charts and reports depend on well-structured data. Visual analytics and digital analytics tools work best when data is properly formatted. A clean spreadsheet helps create insightful charts, performance reports, and trend analyses.
Small adjustments can make a big difference. Google Sheets Transpose ensures that messy spreadsheets don’t slow down productivity.
Let me show you how a well-organized sheet facilitates faster insights and better business decisions.
First…
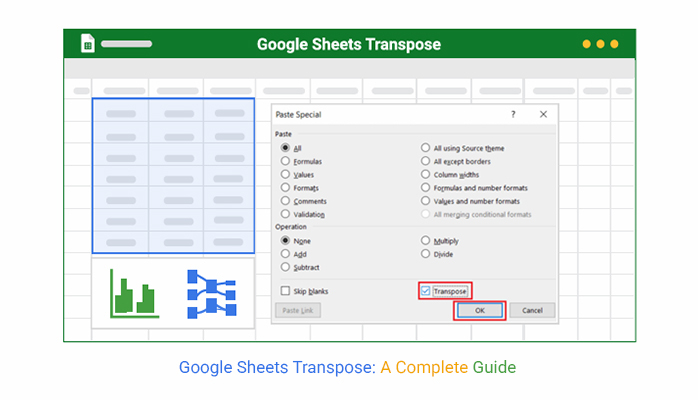
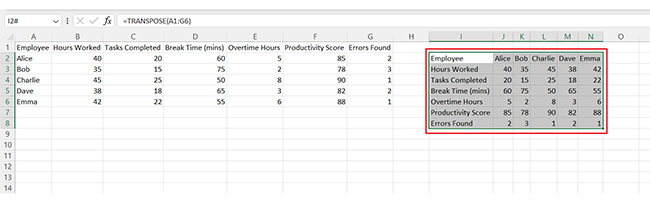
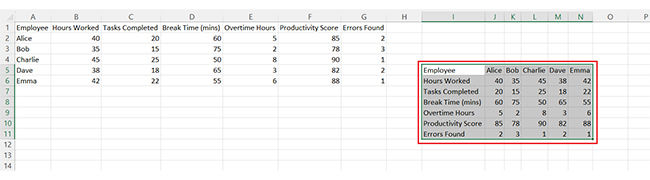
Definition: Transposing data in Google Sheets means switching rows to columns or vice versa. This feature is helpful when you need to rearrange your data for improved analysis. Instead of manually copying and pasting, the Google Sheets Transpose function does it in seconds.
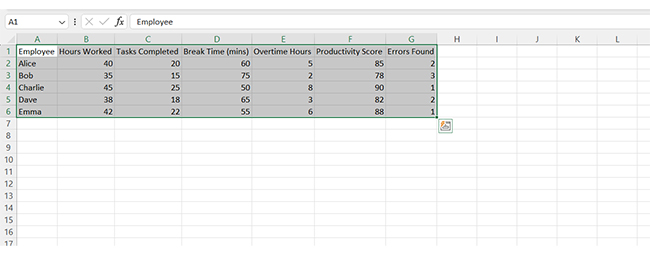
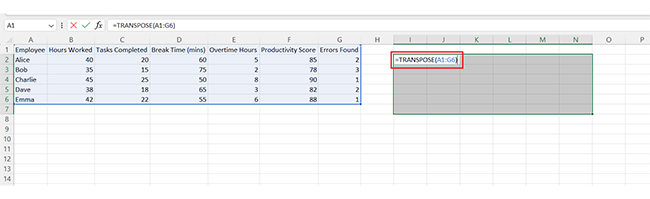
This feature is simple to use and saves time. To transpose:
This tool is useful for tasks like budget planning or organizing large datasets.
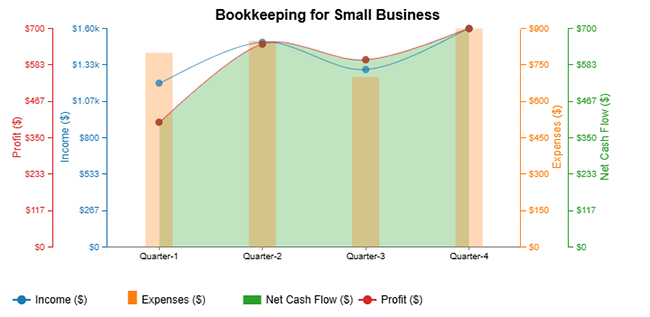
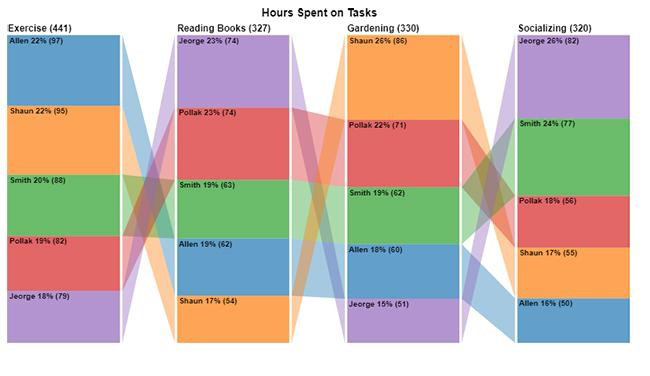
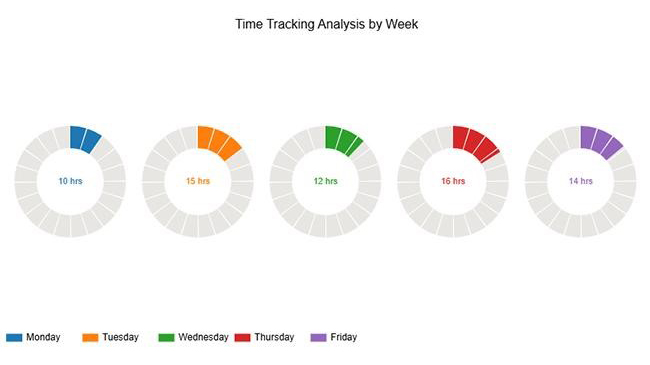
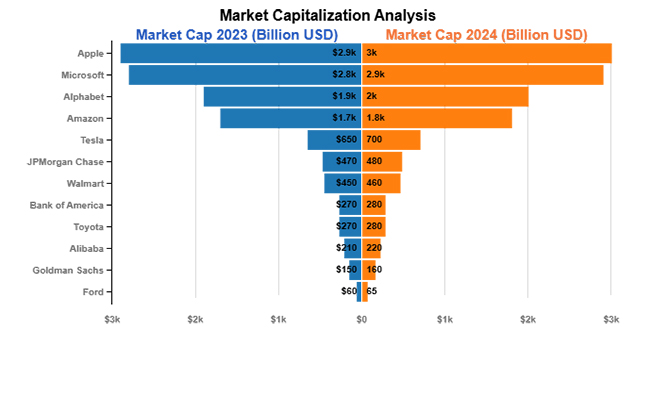
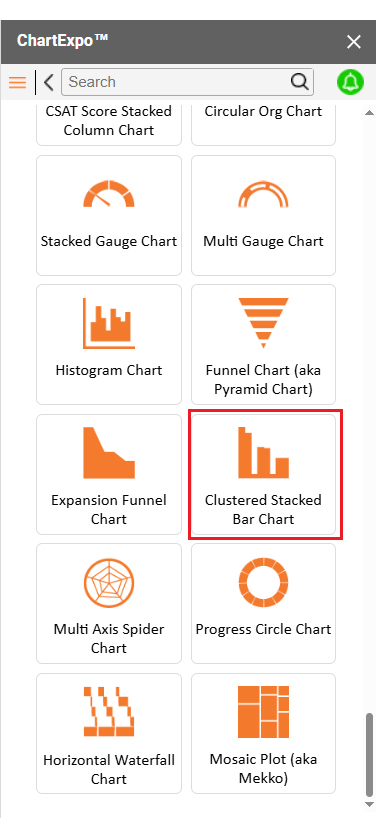
Check out these five charts, as well as a Waterfall chart in Google Sheets, used to analyze transpose data. They make it easy to understand trends and patterns in your data. We created these charts using ChartExpo, a powerful tool for data visualization.


Transposing data in Google Sheets is an intelligent solution to enhance your data organization. It helps you analyze complex datasets more efficiently. It also improves the readability of your spreadsheet by allowing you to view the information from a new perspective. Some benefits of this data organization tool include:
Transposing data can be a huge time-saver when working with large datasets in Google Sheets. It lets you quickly switch between rows and columns. Let me take you through the different ways to transpose data in Google Sheets:
Have you ever tried making sense of a messy Google Sheets? It’s like trying to read a book with pages in the wrong order. Don’t worry; Google Sheets Transpose is here, a quick fix for flipping rows into columns (and vice versa). This simple trick can work wonders when organizing data for better data visualization.
However, while Google Sheets does its best, it often falls short when displaying data clearly. That’s where ChartExpo takes over. It elevates your data visualization game to a new level, and with tools like a Scatter chart, it makes complex data easy to understand right where Google Sheets leaves off.
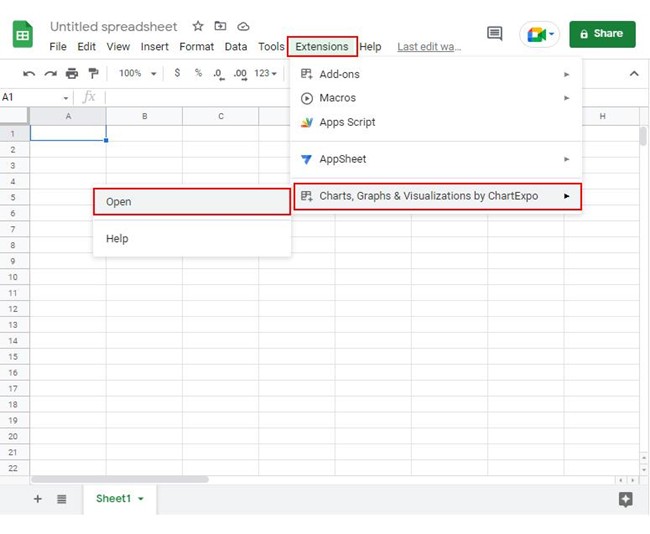
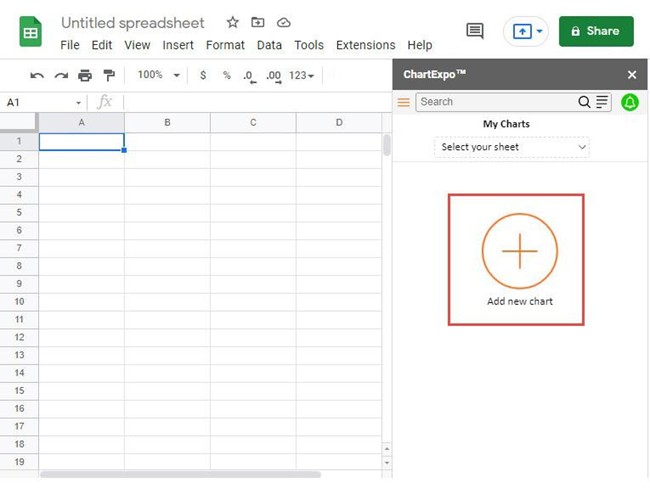
How to Install ChartExpo in Google Sheets?
ChartExpo charts are available in both Google Sheets and Microsoft Excel. Please use the following CTAs to install the tool of your choice and create beautiful visualizations, including a progress bar in Google Sheets, in just a few clicks in your favorite tool.
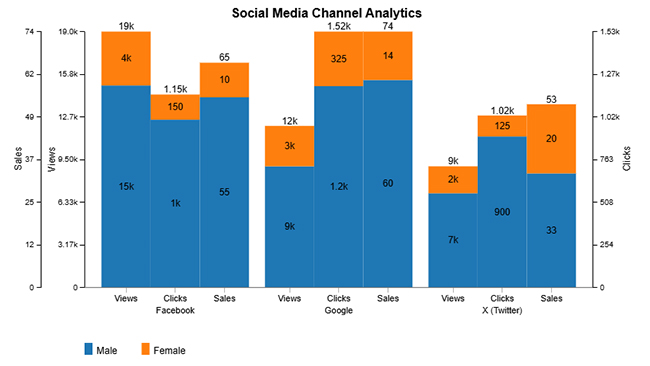
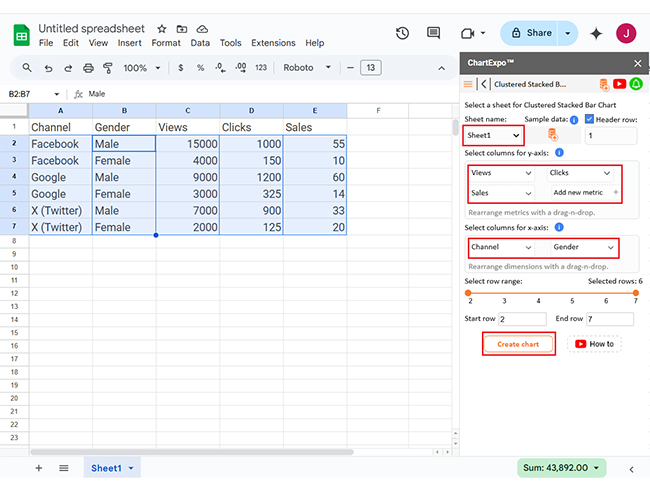
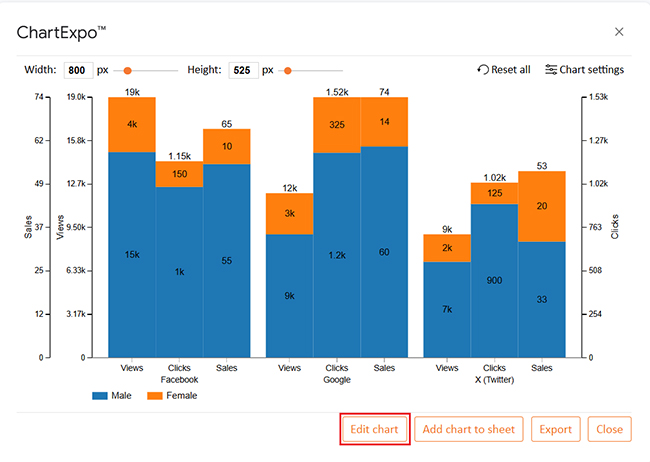
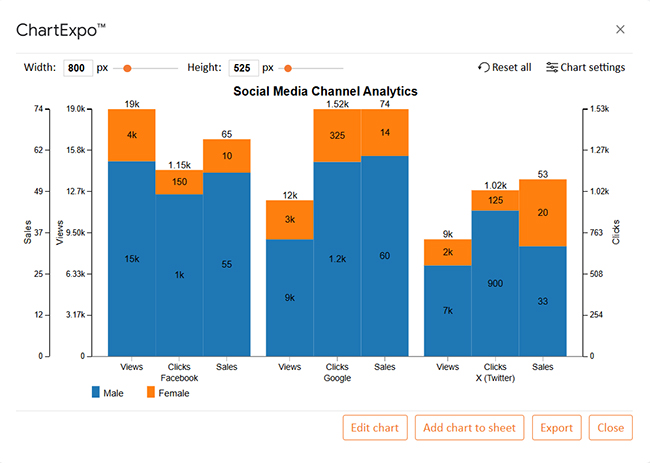
Let’s use this sample data to learn how to create a chart in Google Sheets using ChartExpo.
| Channel | Gender | Views | Clicks | Sales |
| Male | 15000 | 1000 | 55 | |
| Female | 4000 | 150 | 10 | |
| Male | 9000 | 1200 | 60 | |
| Female | 3000 | 325 | 14 | |
| X (Twitter) | Male | 7000 | 900 | 33 |
| X (Twitter) | Female | 2000 | 125 | 20 |
Are you looking to transpose data in Google Sheets from horizontal to vertical? There are a few tricks that can make the process smoother. Whether working with a small list or a massive dataset, these tips will help you transpose quickly and efficiently:


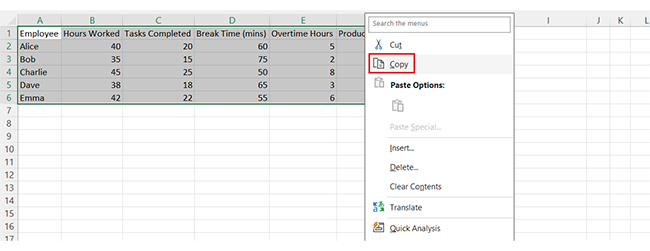
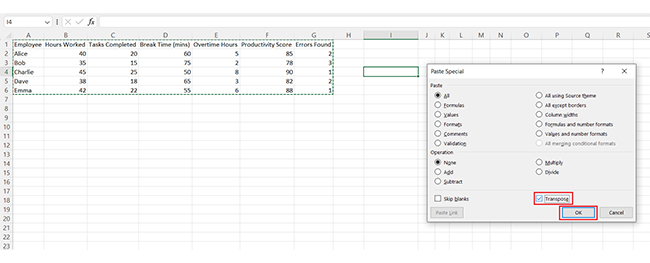
The shortcut for transposing in Google Sheets is Ctrl + Shift + V. First, copy the data, then select the destination cell. Use the shortcut to paste and automatically transpose the data into the new location.
Google Sheets Transpose does exactly that. It is an easy and powerful tool for spinning data values in a row or column. You can efficiently rotate rows and columns, improving how you organize and view your data.
Google Sheets Functionality is essential for data management. The TRANSPOSE function quickly arranges your data to give you a new angle. It condenses your third-party libraries into a more readable format and only takes a few clicks. So, whether you are working on financial reports or inventory tracking, transposing can help you save time and effort.
Using a Google Sheets Extension can further enhance the power of this tool. Extensions provide features that integrate seamlessly with Google Sheets, making tasks even easier. They can help automate complex processes or add new functionality that boosts productivity.
Lastly, knowing how to share a Google Sheet makes collaboration simple. Whether working solo or with a team, sharing your work becomes effortless. Transposing data, paired with sharing features, helps streamline your projects and ensures everyone is on the same page.
And what’s the takeaway? Install ChartExpo to easily create and share insightful charts directly from your transposed data in Google Sheets.
How much did you enjoy this article?


SUMPRODUCT in Google Sheets handles multi-condition calculations without extra columns. Master its syntax, uses, and errors. Read on!

An annual budget template in Google Sheets organizes your yearly finances, tracks every dollar, and reveals spending patterns. Read on!

Learn the best graph to show profit and loss with practical examples and use cases. Discover how to visualize your business data, track trends, and make smarter financial decisions.


