• Home
  • Tools dropdown img
    • Spreadsheet Charts

      • ChartExpo for Google Sheets
      • ChartExpo for Microsoft Excel
    • Power BI Charts

      • Power BI Custom Visuals by ChartExpo
    • Word Cloud

  • Charts dropdown img
    • Chart Category

      • Bar Charts
      • Circle Graphs
      • Column Charts
      • Combo Charts
      • Comparison Charts
      • Line Graphs
      • PPC Charts
      • Sentiment Analysis Charts
      • Survey Charts
    • Chart Type

      • Box and Whisker Plot
      • Clustered Bar Chart
      • Clustered Column Chart
      • Comparison Bar Chart
      • Control Chart
      • CSAT Survey Bar Chart
      • CSAT Survey Chart
      • Dot Plot Chart
      • Double Bar Graph
      • Funnel Chart
      • Gauge Chart
      • Likert Scale Chart
      • Matrix Chart
      • Multi Axis Line Chart
      • Overlapping Bar Chart
      • Pareto Chart
      • Radar Chart
      • Radial Bar Chart
      • Sankey Diagram
      • Scatter Plot Chart
      • Slope Chart
      • Sunburst Chart
      • Tornado Chart
      • Waterfall Chart
      • Word Cloud
    • Google Sheets
      Microsoft Excel
  • Services
  • Pricing
  • Contact us
  • Blog
  • Support dropdown img
      • Gallery
      • Videos
      • Contact us
      • FAQs
      • Resources
    • Please feel free to contact us

      atsupport@chartexpo.com

Categories
All Data Visualizations Data Analytics Surveys
Add-ons/
  • Google Sheets
  • Microsoft Excel
  • Power BI
All Data Visualizations Data Analytics Surveys
Add-ons
  • Google Sheets
  • Microsoft Excel
  • Power BI

We use cookies

This website uses cookies to provide better user experience and user's session management.
By continuing visiting this website you consent the use of these cookies.

Ok

ChartExpo Survey


Home > Blog > Surveys

Forced Choice Questions: Types, Use Cases & Insights

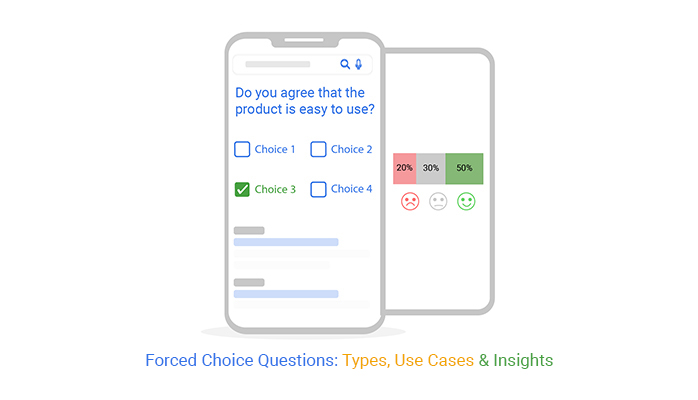
Are you ready to put your decision-making skills to the test? Get ready for a wild ride through the world of forced-choice questions.

Here, you must pick between a rock and a hard place.

Forced Choice Question

Just kidding, it’s not that dramatic, but it’s an exciting topic. And that’s the beauty of it.

How many types of forced-choice questions are there?

You might be surprised to learn that there’s more than meets the eye. From A/B dilemmas to “this or that” conundrums, forced-choice questions come in all shapes and sizes.

These concise and straightforward questions offer respondents a limited set of options. They have to choose from the provided selections.

Without further ado, let’s explore the various types of forced-choice questions to help you gather valuable insights.

We’ll not stop there.

You’ll also learn to analyze and use the responses to inform decisions.

Table of Contents:

  • What is a Forced-Choice Question?
  • Examples of Forced-Choice Questions
  • How to Design Effective Forced-Choice Questions?
  • How to Interpret Forced-Choice Survey Results?
  • Advantages of Forced-Choice Questions
  • Disadvantages of Forced-Choice Questions
  • Wrap Up

Let’s get started.

What is a Forced-Choice Question?

Definition: A Forced-choice question requires respondents to select an answer from a limited set of predefined options. Participants must choose one option and cannot provide a neutral/custom response. This format is designed to elicit specific and easily quantifiable data. Thus, it is useful for gathering preferences, opinions, and comparisons in surveys and assessments.

Examples of Forced-Choice Questions

Here are examples of forced-choice questions:

  1. Dichotomous

Dichotomous forced-choice questions present respondents with only two options. The options typically represent opposite ends of a spectrum or a yes/no scenario. This format is straightforward and helpful in collecting binary data.

Here are some examples:

Satisfaction Level

  • “On a scale of 1 to 5, how satisfied are you with our service? (Very satisfied / Not satisfied)”

Product Usage

  • “Do you use our product on a regular basis? (Yes / No)”

Recommendation

  • “Would you recommend our company to friends or colleagues? (Yes / No)”

Purchase Intent

  • “Are you planning to make another purchase in the next month? (Yes / No)”
  1. Multiple choice

Multiple-choice (forced-choice) questions offer respondents several predefined options. Participants must choose one option that best aligns with their views or preferences. This format is useful when seeking to understand multiple aspects of a topic. Or to quantify preferences in a structured manner.

Here are some examples:

Product Preferences

  • “Which of the following products do you prefer?
    • a) Product A
    • b) Product B
    • c) Product C
    • d) None of the above”

Reasons for Purchase

  • “What influenced your recent purchase decision the most?
    • a) Price
    • b) Product Features
    • c) Brand Reputation
    • d) Recommendations from friends”

Frequency of Use

  • “How often do you use our product or service?
    • a) Daily
    • b) Weekly
    • c) Monthly
    • d) Rarely or never”
  1. Ranking or rating

These types of survey questions require respondents to rank items in order of preference or rate them on a scale. For example, respondents might rank their top three favorite products. Or rate their satisfaction on a scale of 1 to 5. This format provides a deeper understanding of preferences and allows for easy comparison of priorities.

Here are some examples:

Customer Service Experience

  • “On a scale of 1 to 10, how would you rate your recent customer service experience with us?”

Product Satisfaction

  • “Please rate your satisfaction with our product on a scale of 1 to 5, with 5 being highly satisfied.”

Overall Experience

  • “On a scale of 1 to 10, how would you rate your overall experience with our company?”

Likelihood to Repurchase

  • “How likely are you to repurchase our product or service? Please rate on a scale of 1 to 7, with 7 being extremely likely.”

Delivery Time Satisfaction

  • “Rate your satisfaction with the delivery time of our products on a scale of 1 to 5, with 5 being very satisfied.”

How to Design Effective Forced-Choice Questions?

Designing effective forced-choice questions is crucial to gather accurate and valuable data.

    1. Be clear and concise: Use simple language and clearly state the question. Avoid jargon or complex phrasing that might confuse respondents.
    2. Provide meaningful options: Ensure the response options are relevant to the question and cover the range of possible answers. Include all viable choices to avoid biased or limited responses.
    3. Balance options: If using a multiple-choice format, strive to have an equal number of options whenever possible. An imbalance may lead to respondents favoring one category over others.
    4. Use a logical order: Arrange the response options logically (e.g., ascending or descending) to facilitate easy understanding and decision-making.
    5. Avoid overlapping or redundant choices: Ensure the response options are distinct and do not overlap in meaning. Redundant options can confuse respondents and reduce the accuracy of responses.
    6. Use an appropriate scale: Select one that best suits the context when employing ranking or rating questions. Common scales include Likert or numerical scales (e.g., 0-10).
    7. Pilot test and refine: Before using the questions in a survey, pilot test them with a small group of participants. Gather feedback and refine the questions based on the pilot results.
    8. Consider the context: Tailor the questions to the research objective and target audience. What works in one context may not be suitable for another.
    9. Keep the response burden in mind: Limit the number of forced-choice questions in a survey to avoid overwhelming respondents. Balancing forced-choice questions with an Open-Ended Questionnaire can reduce response fatigue.

How to Interpret Forced-Choice Survey Results?

Analyzing survey data can be as exciting as watching paint dry.

We have a solution ChartExpo.

ChartExpo’s power of visualization can turn your dull forced-choice survey results into a vibrant masterpiece. No longer will you have to sift through endless spreadsheets and graphs lost in a sea of data.

Why?

The gleaning of insights becomes as easy as a pie.

Let’s learn how to install ChartExpo in Excel.

  1. Open your Excel application.
  2. Open the worksheet and click the “Insert” menu.
  3. You’ll see the “My Apps” option.
  4. In the office Add-ins window, click “Store” and search for ChartExpo on my Apps Store.
  5. Click the “Add” button to install ChartExpo in your Excel.

ChartExpo charts are available both in Google Sheets and Microsoft Excel. Please use the following CTA’s to install the tool of your choice and create beautiful visualizations in a few clicks in your favorite tool.

Example

Let’s say you operate a store. You have created a feedback survey with the following forced-choice questions.

  • Do you agree that the product meets your expectations in terms of quality?
  • Do you agree that the product provides value for its price?
  • Do you agree that the product is easy to use?

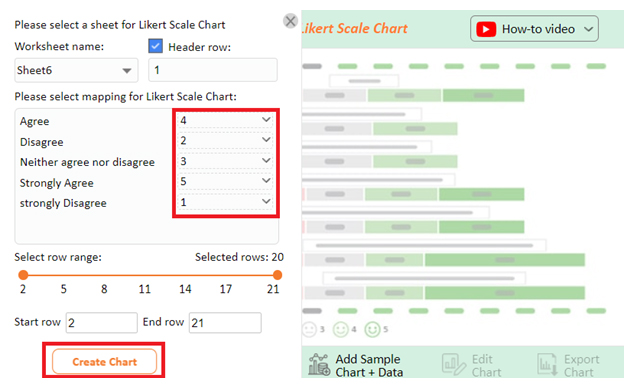
Your customers respond to these questions using the forced-choice scale below.

  1. Strongly Disagree
  2. Disagree
  3. Neither agree nor disagree
  4. Agree
  5. Strongly Agree

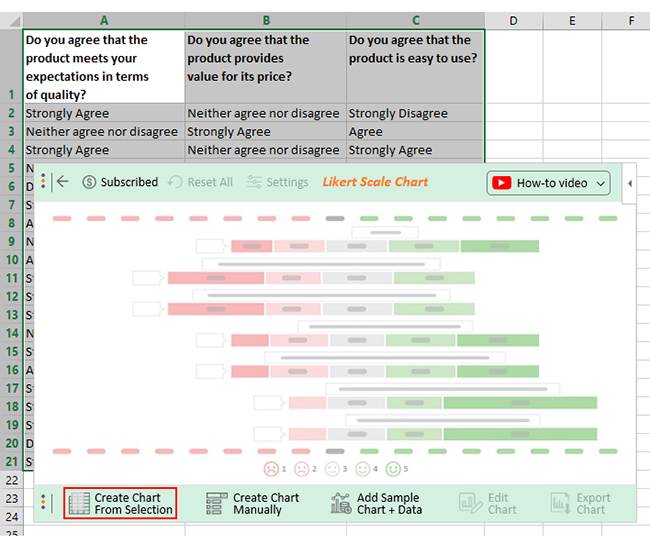
Assume the survey yields the data table below.

Do you agree that the product meets your expectations in terms of quality? Do you agree that the product provides value for its price? Do you agree that the product is easy to use?
Strongly Agree Neither agree nor disagree Strongly Disagree
Neither agree nor disagree Strongly Agree Agree
Strongly Agree Neither agree nor disagree Strongly Agree
Neither agree nor disagree Disagree Agree
Disagree Strongly Disagree Strongly Disagree
Strongly Agree Agree Strongly Agree
Agree Strongly Disagree Agree
Neither agree nor disagree Agree Disagree
Agree Strongly Agree Strongly Agree
Strongly Agree Strongly Agree Strongly Agree
Strongly Disagree Neither agree nor disagree Disagree
Strongly Agree Strongly Agree Strongly Disagree
Neither agree nor disagree Strongly Disagree Disagree
Strongly Agree Strongly Agree Strongly Agree
Agree Agree Agree
Strongly Disagree Neither agree nor disagree Disagree
Strongly Agree Strongly Agree Strongly Agree
Strongly Agree Disagree Strongly Agree
Disagree Strongly Disagree Strongly Agree
Strongly Disagree Disagree  Disagree

This table contains example data. Expect many responses and questions in real life.

  • To get started with ChartExpo, install ChartExpo in Excel.
  • Now Click on My Apps from the INSERT menu.
insert chartexpo in excel
  • Choose ChartExpo from My Apps, then click Insert.
open chartexpo in excel
  • Once it loads, choose the “Likert Scale Chart” from the charts list.
search likert scale chart in excel for Forced Choice Questions
  • Click the “Create Chart From Selection” button after selecting the data from the sheet, as shown.
Create Chart From Selection for Forced Choice Questions
  • When you click the “Create Chart From Selection” button, you have to map responses with numbers manually. The Likert scale has this arrangement:
    • Strongly Disagree=1
    • Disagree=2
    • Neither agree nor disagree=3
    • Agree=4
    • Strongly Agree=5
  • Once all is set, click the “Create Chart” button.
Map Likert Responses to Numbers for Forced Choice Questions
  • ChartExpo will generate the visualization below for you.
Forced Choice Question Design Template
  • If you want to have the chart’s title, click Edit Chart, as shown in the above image.
  • Click the pencil icon next to the Chart Header to change the title.
  • It will open the properties dialog. Under the Text section, you can add a heading in Line 1 and enable Show.
  • Give the appropriate title of your chart and click the Apply button.
apply title on chart for Forced Choice Questions
  • Let’s say you want to add text responses instead of numbers against every emoji.
  • Click the pencil icon next to the respective emoji. Expand the “Label” properties and write the required text. Then click the “Apply All” button.
  • Click the “Save Changes” button to persist the changes.
apply label on chart for Forced Choice Questions
  • Your final chart will appear below.
Final Forced Choice Question

Insights

  • 63% of customers agree with the easy usage of the product, while 37% do not agree.
  • 48% agree with the price of the product due to its value. 32% do not agree, and 21% remain neutral.
  • 58% agree with the quality of the product, 22% do not agree, and 21% maintain neutrality.
  • Overall;
    • 57% of customers gave positive responses to the survey questions.
    • 30% gave negative feedback
    • 14% remained neutral.

Tips for Using a Forced-Choice Question

When designing surveys, interviews, or assessments, forced-choice questions offer valuable insights. Here’s how to use them effectively.

  • Keep it simple: Avoid overly complex or ambiguous language in the options.
  • Provide balanced options: Ensure that the options are comprehensive and cover a range of possibilities.
  • Avoid overlapping options: Make sure that the options are distinct and do not overlap.
  • Use a neutral tone: Frame the options in a neutral and unbiased manner to prevent influencing respondents.
  • Randomize response order: If applicable, consider randomizing the order of response options to avoid order bias.

Advantages of Forced-Choice Questions

Using forced choice questions offers several advantages that enhance the quality and efficiency of data collection:

  • Eliminates ambiguity: Forced-choice questions provide clear and specific answer options, leaving no room for confusion or interpretation. Respondents know what is expected, leading to more accurate and reliable responses.
  • Increases objectivity: Since respondents must choose from predefined options, personal biases, and subjective interpretations are minimized. This ensures that the data collected remains objective and unbiased.
  • Enhances comparability: The standardized format of forced-choice questions enables easy comparison of responses across different participants or groups. This comparability allows for more effective identification of patterns and trends.
  • Saves time: The simplicity of forced-choice questions reduces the time required to complete the survey. It also saves time during data entry and analysis, making it a practical choice for large-scale surveys.
  • Increases response rate: The straightforward nature of forced-choice questions makes respondents more likely to participate and complete the survey. Increased response rates ensure higher sample sizes, leading to more representative data.

Disadvantages of Forced-Choice Questions

Here are some of the disadvantages you should be aware of when using forced choice questions:

  • Limited response options: Forced choice questions restrict respondents to predefined options, potentially leaving out nuanced or diverse responses. This limitation may not fully capture the richness of individual perspectives.
  • Lack of flexibility: Respondents may feel constrained by the predetermined choices, leading to frustration when their desired answer is unavailable. This lack of flexibility can hinder the accurate expression of their genuine opinions.
  • Imposed bias: The wording and structure of forced-choice questions can unintentionally influence respondents’ answers, leading to biased results. Certain options may be more appealing or socially acceptable, impacting the reliability of the data.
  • Insufficient context: Forced-choice questions often lack the context provided by open-ended questions. Without additional information, respondents may struggle to make an accurate choice, resulting in less meaningful data.
  • Guessing or random selection: Respondents may resort to guessing or randomly selecting an option when unsure about the correct choice. This compromises the accuracy of their responses, introducing noise into the data.
  • Difficulty in capturing complexity: Complex issues often require nuanced responses, which limited forced-choice options may not adequately capture. This limitation can hinder a thorough understanding of intricate topics.
  • Potential for response fatigue: When a survey consists mainly of forced-choice questions, respondents may experience survey fatigue. This results in rushed or less thoughtful responses.

FAQs

What is a forced-choice question?

A forced-choice question requires respondents to select an answer from a limited set of predefined options. Participants must choose one option and cannot provide a neutral/custom response.

What is a forced choice example?

An example of a forced-choice question is: “Which flavor do you prefer: chocolate or vanilla?” Respondents must choose one of the two options, leaving no room for additional responses or open-ended answers.

What is the forced choice method?

The forced choice method is a research technique that presents respondents with limited options. Here, respondents choose one option from the given set. As a result, this method elicits specific, standardized responses, allowing easy data analysis and comparison.

Wrap Up

Forced-choice questions are a powerful tool in survey research, enabling efficient collection of specific and structured data.

There are three main types of forced-choice questions; dichotomous, multiple-choice, and ranking or rating. Each type serves distinct purposes, from binary decisions to assessing preferences and priorities. The choice of question type depends on the research objectives and the level of granularity required in the data analysis.

Using forced-choice questions effectively allows you to eliminate ambiguity, increase objectivity, and streamline data processing.

On the other hand, it is essential to be mindful of the limitations. Some limitations include the lack of flexibility and the potential for imposed bias. Combining different question formats and considering the survey context is vital to mitigate these drawbacks.

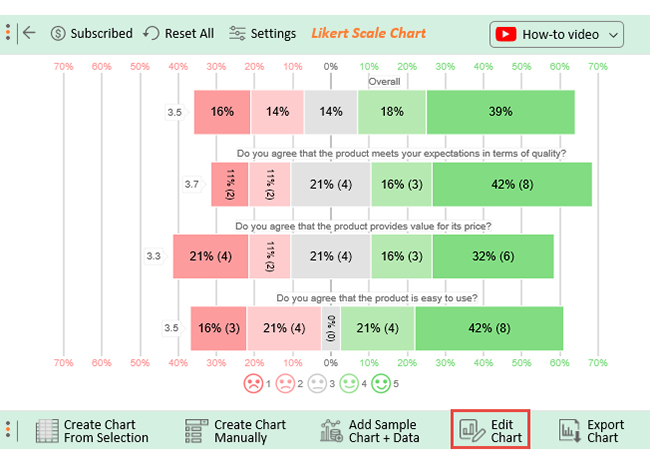
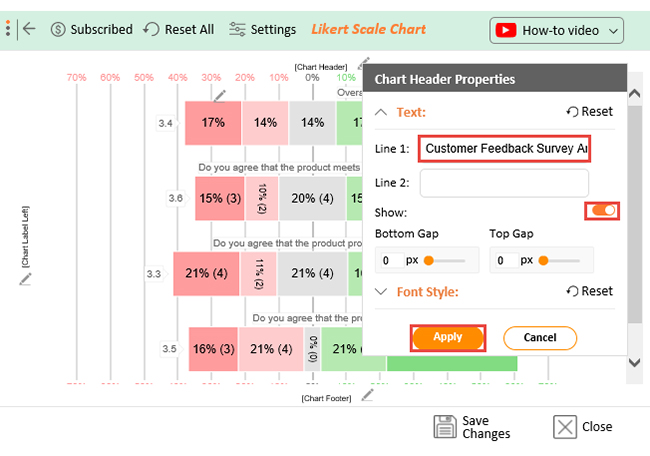
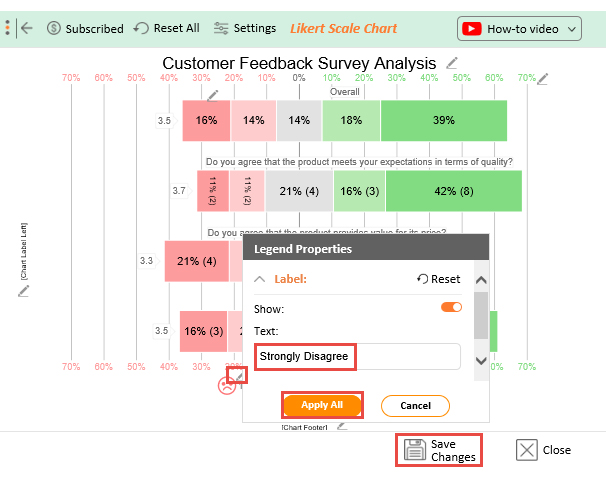
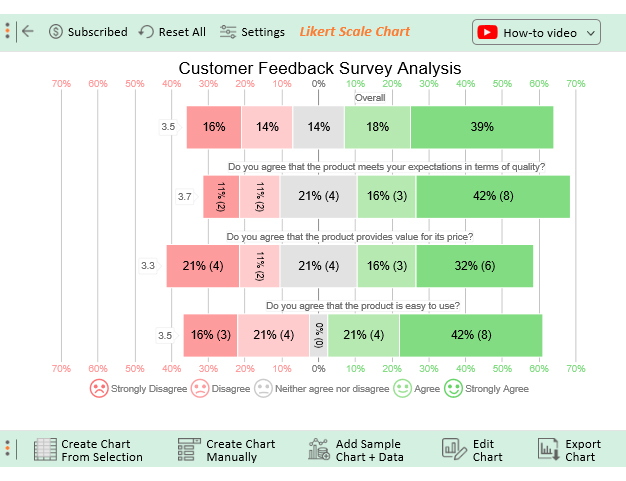
With ChartExpo’s versatile data visualization capabilities, you can seamlessly analyze data from your forced-choice survey. The platform’s user-friendly interface empowers you to create appealing, insightful visualizations of the survey results. Consequently, this simplifies the interpretation of data and facilitates informed decision-making.

Ready to chart-notify your data? Get started with ChartExpo today!

How much did you enjoy this article?

GSAd1
Start Free Trial!
128033

Related articles

next previous
Surveys13 min read

5 Point Likert Scale Analysis, Interpretation & Examples

Dive deep into the realm of 5-point Likert Scale Analysis and Interpretation to unravel the sentiments behind your responses. Gain actionable insights today.

Surveys11 min read

3-Point Likert Scale: Range Interpretation & Analysis

Learn the basics of the 3-point Likert scale, including examples, benefits, and when it's best applied in research and feedback forms.

Surveys16 min read

Survey Data Collection: Definition, Methods and Analysis

Find the best methods of Survey data collection. Elevate your research game with practical tips for gathering, analyzing, and leveraging valuable information.

Surveys11 min read

5-Point Performance Rating Scale With Examples: Quick Guide

Discover how the 5-Point Performance Rating Scale helps organizations evaluate employee performance with clarity, consistency, and fairness across teams.

Surveys11 min read

How to Interpret 4-Point Likert Scale Results?

Click to learn How to Create, Gather and Analyze Data Using the 4-Point Likert Scale? A complete guide with definition, examples, uses, and applications.

ChartExpo logo

Turn Data into Visual
Stories

CHARTEXPO

  • Home
  • Gallery
  • Videos
  • Services
  • Pricing
  • Contact us
  • FAQs
  • Privacy policy
  • Terms of Service
  • Sitemap

TOOLS

  • ChartExpo for Google Sheets
  • ChartExpo for Microsoft Excel
  • Power BI Custom Visuals by ChartExpo
  • Word Cloud

CATEGORIES

  • Bar Charts
  • Circle Graphs
  • Column Charts
  • Combo Charts
  • Comparison Charts
  • Line Graphs
  • PPC Charts
  • Sentiment Analysis Charts
  • Survey Charts

TOP CHARTS

  • Sankey Diagram
  • Likert Scale Chart
  • Comparison Bar Chart
  • Pareto Chart
  • Funnel Chart
  • Gauge Chart
  • Radar Chart
  • Radial Bar Chart
  • Sunburst Chart
  • see more
  • Scatter Plot Chart
  • CSAT Survey Bar Chart
  • CSAT Survey Chart
  • Dot Plot Chart
  • Double Bar Graph
  • Matrix Chart
  • Multi Axis Line Chart
  • Overlapping Bar Chart
  • Control Chart
  • Slope Chart
  • Clustered Bar Chart
  • Clustered Column Chart
  • Box and Whisker Plot
  • Tornado Chart
  • Waterfall Chart
  • Word Cloud
  • see less

RESOURCES

  • Blog
  • Resources
  • YouTube
SIGN UP FOR UPDATES

We wouldn't dream of spamming you or selling your info.

© 2025 ChartExpo, all rights reserved.