Categories
Electric vehicle sales statistics: A hint of what the future holds for transportation.
Imagine a busy day and the city bustles with automobiles that seem to whisk by effortlessly. It is a scene that is rapidly becoming a reality.
The statistics are compelling and provide a good representation of the big-picture shift in electric vehicle sales trends. By 2023, the U.S. had experienced a surge of 60% in sales alone. About 1.6 million EVs were sold by then, and the number is still increasing. Even better are the numbers globally. 2.3 million electric vehicles were sold worldwide in Q1 2023 (up +25% vs.Q1 2022).


China, Europe, and the U.S. are the biggest EV markets in the world. Automakers are taking notice. Jaguar plans to go all-electric by 2025. Mitsubishi anticipates that its lineup of products will be 50% electrified vehicles by the fiscal year 2030. Such audacious goals are reshaping the automotive landscape.
So… why is this gain happening? Factors such as government incentives, environmental issues, and technological progress impact these statistics. The numbers don’t lie EV sales statistics indicate an increasing desire from customers for more environmentally friendly transportation. Moreover, electric vehicles are getting very close to being a practical choice for the average consumer. Why? The charging infrastructure is expanding rapidly, and battery technology is also improving.
EVs have a bright future. Experts expect sales figures for electric vehicles to soar. By 2035, one in four cars on the roads worldwide could be electric. Such a transition would also yield cleaner air and lower CO2 emissions, and life in the city might get less noisy.
The EV age is coming sooner than you think. So, let’s find out what electric vehicle sales statistics tell us about the future of transportation.
First…
Definition: Electric vehicle (EV) sales refer to the number of electric cars sold within a specific period. EVs are powered entirely or partially by electricity, including battery electric vehicles (BEVs) and plug-in hybrid electric vehicles (PHEVs).
These statistics help assess EVs’ growth, market penetration, and adoption rate globally.
Global EV sales surpassed 10 million units in 2023, a significant increase from 6.6 million in 2021. This growth is primarily driven by China, which accounted for over 60% of global EV sales. China sold over 6 million EVs in 2023, reflecting strong government support and consumer demand.
Europe, the second-largest market, saw 2.7 million EVs sold, with countries like Germany and Norway leading the adoption. The U.S. also experienced growth, with over 1 million EVs sold, boosted by federal incentives and increased model availability.
These statistics indicate a rapid shift toward electric mobility. Environmental concerns, advancements in battery technology, and supportive government policies drive this. The increasing sales suggest a significant transformation in the automotive industry, paving the way for a more sustainable future.
Have you ever wondered why there’s so much buzz around electric vehicles (EVs) these days? It’s not just about having a sleek, quiet ride; it’s about the big picture. Electric vehicle sales statistics offer a window into some crucial aspects of our world today:
Ready to charge up your data analysis skills? Let’s plug into the electrifying world of electric vehicle sales graphs! As the EV market accelerates, keeping track of sales trends is crucial.
But here’s the shock: traditional spreadsheets often short-circuit when visualizing this high-voltage data. Excel can leave you feeling stuck in neutral when trying to create dynamic, insightful graphs.
That’s where ChartExpo comes in, revving up your data visualization capabilities. This powerful tool transforms your boring spreadsheets into a showroom of sleek, informative charts.
With ChartExpo, you can effortlessly create electric vehicle sales graphs that spark understanding and drive decision-making. No coding is required – it’s as easy as plugging in your EV overnight.
Let’s learn how to install ChartExpo in Excel.
ChartExpo charts are available both in Google Sheets and Microsoft Excel. Please use the following CTAs to install the tool of your choice and create beautiful visualizations with a few clicks in your favorite tool.
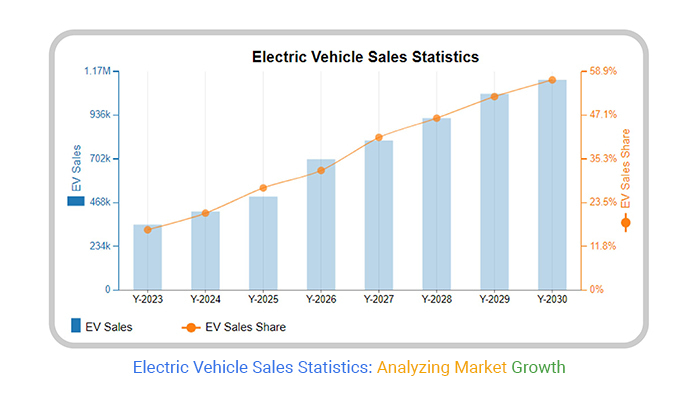
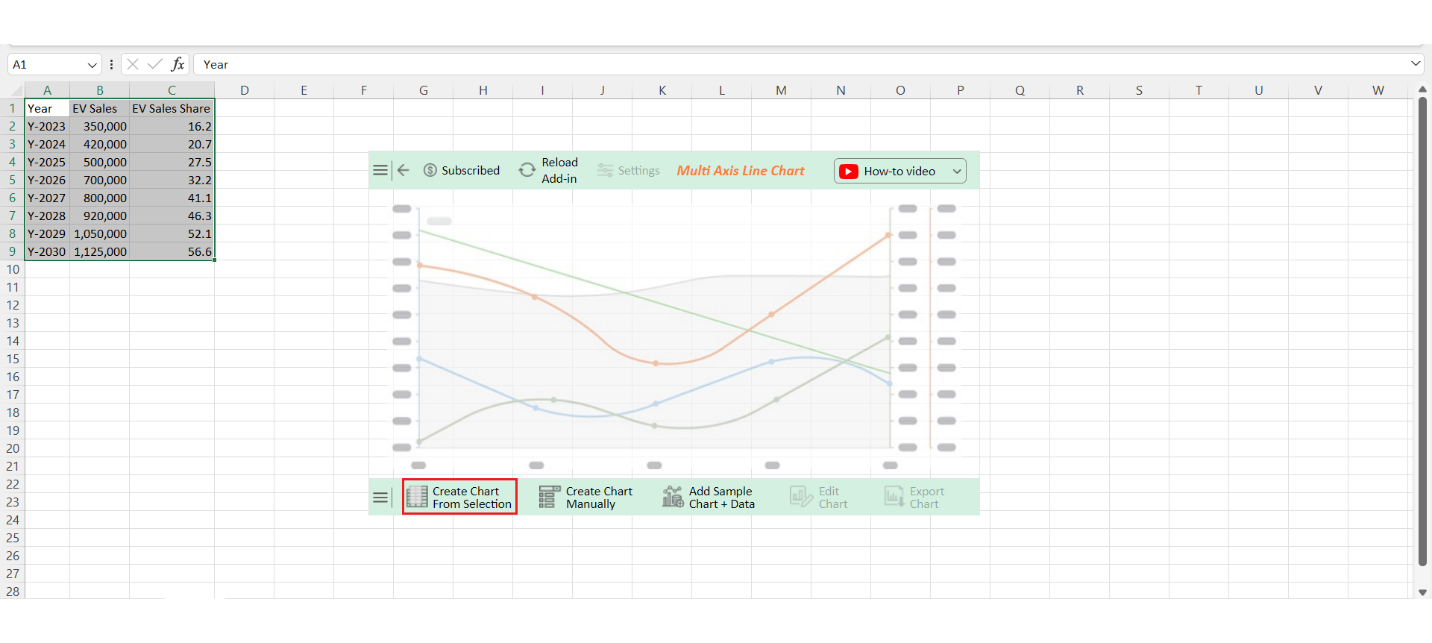
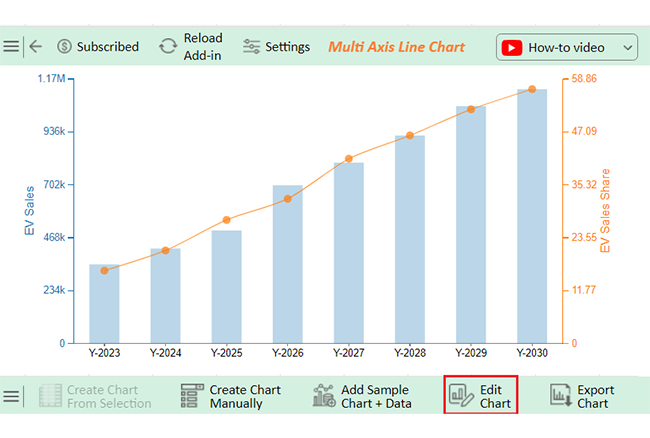
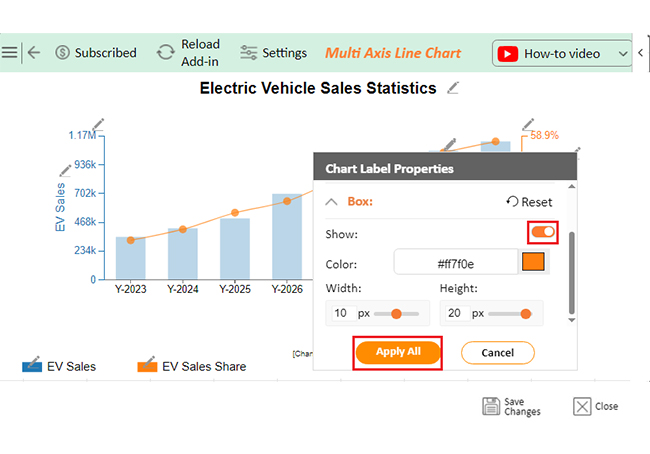
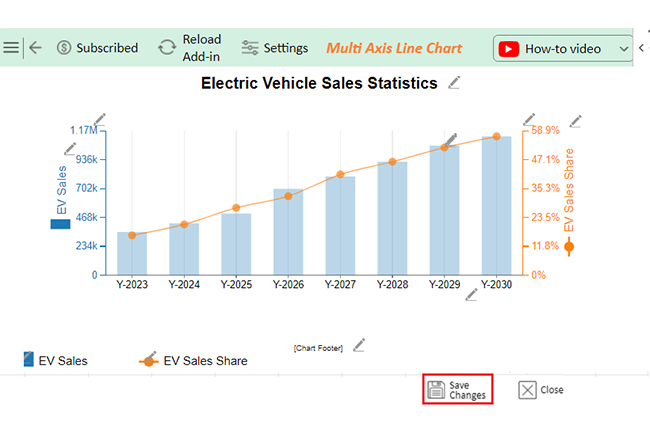
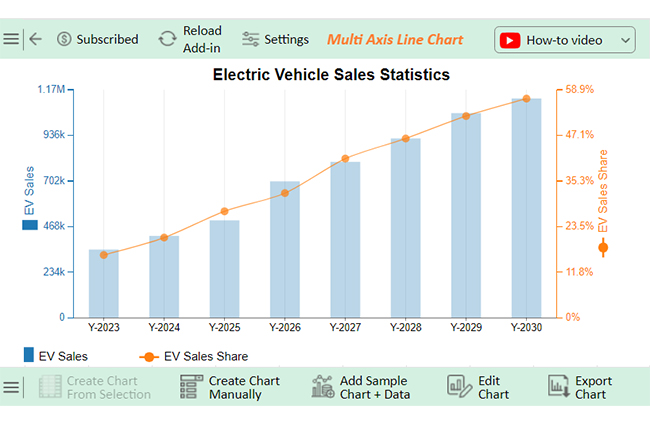
Let’s create an EV sales graph from the data below and analyze it using ChartExpo.
| Year | EV Sales | EV Sales Share |
| Y-2023 | 350,000 | 16.2 |
| Y-2024 | 420,000 | 20.7 |
| Y-2025 | 500,000 | 27.5 |
| Y-2026 | 700,000 | 32.2 |
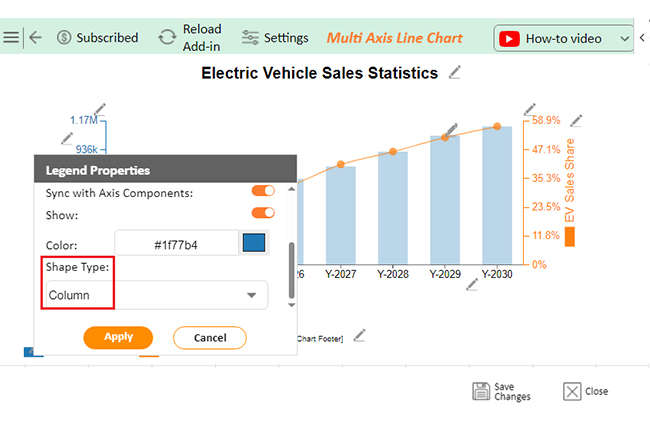
| Y-2027 | 800,000 | 41.1 |
| Y-2028 | 920,000 | 46.3 |
| Y-2029 | 1,050,000 | 52.1 |
| Y-2030 | 1,125,000 | 56.6 |


Electric car selling statistics tell the story of where we’re headed regarding technology, the economy, and the environment. To get the most out of these statistics, there are some best practices to follow:
No, electric vehicle sales are not declining. They have been increasing steadily. Data shows a rise in numbers and market share over recent years. This trend indicates growing demand and interest in electric vehicles.
Projections for electric vehicle sales are positive. Sales are expected to grow significantly in the coming years. Market share is anticipated to rise as adoption increases. Growth trends suggest continued expansion and higher demand for electric vehicles.
EV sales are up. Data shows a steady increase in both sales numbers and market share. This growth indicates rising consumer interest and adoption of electric vehicles. The trend points to a positive outlook for the EV market.
Electric vehicle sales statistics offer crucial insights. They show how fast the EV market is growing. By analyzing these numbers, we can understand market trends and consumer behavior. This helps businesses and governments make informed decisions.
These statistics are essential for economic planning. They guide investments in infrastructure like charging stations. They also help shape policies that support the shift to electric mobility.
Another key factor is the environmental impact. EV sales data helps track progress toward reducing carbon emissions. It shows how quickly we are moving toward a more sustainable future.
Innovation thrives on this data. Strong sales numbers encourage further advancements in EV technology. This leads to better vehicles and charging solutions.
These statistics also reveal consumer behavior. They show what features or incentives drive EV purchases, which is valuable for tailoring marketing strategies.
In conclusion, electric vehicle sales statistics are more than just numbers. They provide a roadmap for the future. Following the best data collection and analysis practices will help us harness this growing market’s full potential.
How much did you enjoy this article?


Calculate accounts receivable turnover ratio to measure credit collection speed, improve cash flow, and strengthen your financial strategy. Read on!

Change Management KPIs are the key to tracking adoption, performance, and ROI during transitions. Find out which metrics matter. Read on!

Data collection methods and techniques determine the quality of every insight you act on. Explore key approaches for gathering reliable data. Read on!


