• Home
  • Tools dropdown img
    • Spreadsheet Charts

      • ChartExpo for Google Sheets
      • ChartExpo for Microsoft Excel
    • Power BI Charts

      • Power BI Custom Visuals by ChartExpo
    • Word Cloud

  • Charts dropdown img
    • Chart Category

      • Bar Charts
      • Circle Graphs
      • Column Charts
      • Combo Charts
      • Comparison Charts
      • Line Graphs
      • PPC Charts
      • Sentiment Analysis Charts
      • Survey Charts
    • Chart Type

      • Box and Whisker Plot
      • Clustered Bar Chart
      • Clustered Column Chart
      • Comparison Bar Chart
      • Control Chart
      • CSAT Survey Bar Chart
      • CSAT Survey Chart
      • Dot Plot Chart
      • Double Bar Graph
      • Funnel Chart
      • Gauge Chart
      • Likert Scale Chart
      • Matrix Chart
      • Multi Axis Line Chart
      • Overlapping Bar Chart
      • Pareto Chart
      • Radar Chart
      • Radial Bar Chart
      • Sankey Diagram
      • Scatter Plot Chart
      • Slope Chart
      • Sunburst Chart
      • Tornado Chart
      • Waterfall Chart
      • Word Cloud
    • Google Sheets
      Microsoft Excel
  • Services
  • Pricing
  • Contact us
  • Blog
  • Support dropdown img
      • Gallery
      • Videos
      • Contact us
      • FAQs
      • Resources
    • Please feel free to contact us

      atsupport@chartexpo.com

Categories
All Data Visualizations Data Analytics Surveys
Add-ons/
  • Google Sheets
  • Microsoft Excel
  • Power BI
All Data Visualizations Data Analytics Surveys
Add-ons
  • Google Sheets
  • Microsoft Excel
  • Power BI

We use cookies

This website uses cookies to provide better user experience and user's session management.
By continuing visiting this website you consent the use of these cookies.

Ok

ChartExpo Survey


Home > Blog > Data Analytics

DevOps Performance Metrics for Chart-Based Insights

What are DevOps performance metrics, and why should any tech team care?

DevOps Performance Metrics

Speed without direction is chaos. That’s why measuring what matters is critical. DevOps performance metrics bring clarity to software delivery. They tell teams where they’re winning—and where they’re wasting time.

Many companies use KPI graphs to visualize delivery speed, change failure rates, and lead times. This visual clarity encourages teams to adopt better habits. Better habits mean fewer bugs, less downtime, and happier users.

But measuring everything doesn’t help. That’s where SMART KPIs Examples come in. Teams that define specific, measurable goals make faster progress. Think “Reduce deployment rollback rate by 15% in Q3” instead of “Improve stability”.

Choosing the right DevOps performance metrics starts with understanding the business impact. Is the team improving release cycles or drowning in rework? Are alerts catching issues before users report them? Numbers reveal patterns. Patterns reveal problems. And problems show opportunities.

Metrics don’t slow teams down. They help them go faster with fewer surprises in a space where every second matters. Ignore them, and you’re flying blind. Use them well, and your team gets better every sprint.

Let’s dive deeper…

Table of Contents:

  1. What are DevOps Performance Metrics?
  2. Why is the KPI for DevOps important?
  3. What are the 10 Critical DevOps Metrics?
  4. How to Implement KPI for DevOps?
  5. How to Analyze DevOps Metrics and KPIs in Google Sheets?
  6. How to Improve DevOps Metrics?
  7. Tips for Choosing Perfect DevOps Metrics
  8. FAQs
  9. Wrap Up

What are DevOps Performance Metrics?

Definition: DevOps performance metrics are measurable indicators that track how well a DevOps team delivers software. They focus on speed, quality, and stability. These metrics highlight strengths and expose weak spots in the delivery pipeline.

Common business metrics include deployment frequency and lead time. Teams also monitor failure rates and recovery times. Precise data drives better performance.

With the right SaaS key performance indicators, teams can improve continuously and quickly respond to change. These metrics turn guesswork into smart decisions.

Why is the KPI for DevOps important?

Have you ever felt like your team is always busy but never sure it’s moving forward? That’s where KPI steps in. In DevOps, being fast isn’t enough. You need to be fast and effective. Tracking the correct numbers gives you proof, not guesswork.

Here’s why KPIs for DevOps are essential:

  • Measuring efficiency and speed: Tracking performance metrics like deployment frequency helps teams understand how fast they deliver value. Faster lead times mean quicker feedback and more opportunities to improve.
  • Ensuring system reliability: Monitoring failure rates and recovery times ensures systems remain stable even with rapid changes. Using business metrics to track these helps maintain user trust and reduces downtime.
  • Enabling continuous improvement: Continuous improvement depends on precise data from financial metrics and operational measurements. Teams can identify trends, address weaknesses, and optimize workflows over time.
  • Promoting transparency and accountability: Sharing KPI graphs openly encourages teams to take ownership of results and challenges. Transparency helps align goals and drives collective responsibility for success.

What are the 10 Critical DevOps Metrics?

Want to know what drives DevOps success? It all comes down to the correct numbers. Tracking key metrics and KPIs keeps teams focused on what matters most. Here are 10 critical metrics every DevOps team should watch closely:

  • Deployment Frequency: This KPI measures how often teams release new code to production. Frequent deployments show a smooth and efficient delivery pipeline.
  • Lead Time for Changes: Lead time tracks how quickly code moves from development to deployment. Short lead times mean faster innovation and quicker fixes.
  • Change Failure Rate: This indicates the percentage of deployments that cause failures in production. A low failure rate reflects higher code quality and reliability.
  • Mean Time to Recovery (MTTR): MTTR measures how fast teams fix problems after a failure. More rapid recovery minimizes the impact on users and business operations.
  • Availability/uptime: This KPI tracks the percentage of time systems are operational and accessible. High uptime ensures a better user experience and trust.
  • Error Rates: Error rates quantify how often errors occur in the software or systems. Lower error rates point to improved stability and performance.
  • Deployment Success Rate: This shows the percentage of deployments completed without issues. A higher success rate reduces rework and speeds up delivery.
  • Cycle Time: Cycle time is the total time taken to complete a task or feature from start to finish. Reducing cycle time boosts team productivity and responsiveness.
  • Customer ticket volume: This counts the number of support requests from users. Fewer tickets often indicate better software quality and user satisfaction.
  • Automated test coverage: This measures how much of the codebase is tested automatically. Greater coverage helps catch defects early and supports continuous delivery.

How to Implement KPI for DevOps?

Setting KPIs in DevOps isn’t about checking boxes. It’s about building a feedback loop that drives real progress. If you want data to work for your team, not against them, start with clarity and keep things practical.

How?

  1. Define clear objectives: Start with the “why”. Know precisely what you want to improve before choosing any performance metrics.
  2. Select relevant metrics: Pick metrics that match your goals. Use SMART KPIs to make them specific, measurable, and realistic.
  3. Establish baselines: Measure where you are now. This gives you context and makes future changes meaningful.
  4. Automate data collection: Manual tracking wastes time. Use tools that collect data continuously and feed it into your systems.
  5. Set targets and thresholds: Set clear goals and limits. This helps teams know what success and risk look like.
  6. Monitor and visualize: Use KPI graphs to track progress in real-time. Visual data keeps teams engaged and informed.
  7. Review and adjust: No metric is forever. Regular reviews keep your KPIs aligned with evolving business needs.

How to Analyze DevOps Metrics and KPIs in Google Sheets?

What are DevOps performance metrics, and why do they matter more than your team’s favorite coffee? Because metrics tell you if you’re building fast or breaking fast. But raw data alone won’t cut it. You need crisp data visualization; data visuals transform confusing numbers into clear insight.

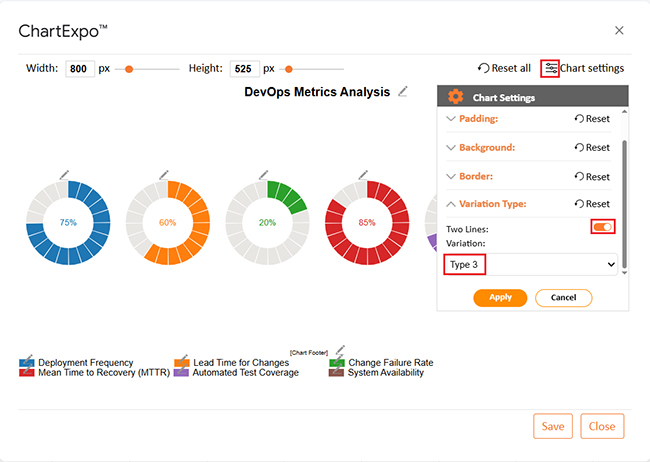
Unfortunately, Google Sheets can’t keep up. It’s great for spreadsheets, not storytelling. That’s where ChartExpo comes in. It turns your DevOps data into powerful visuals—no coding, no clutter. Now, your metrics finally speak your language.

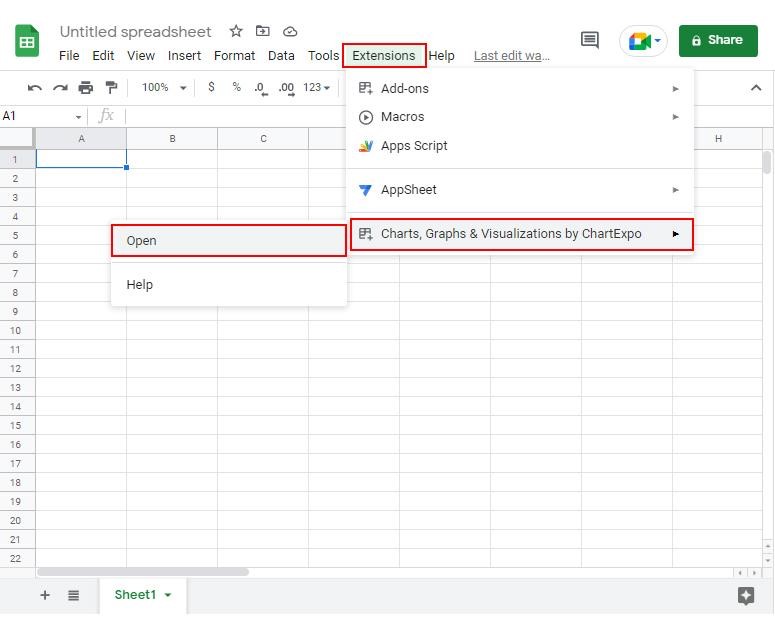
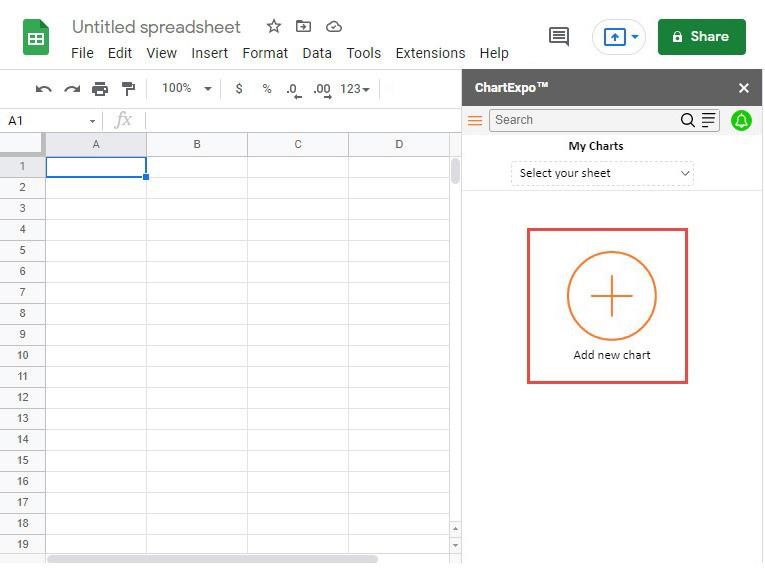
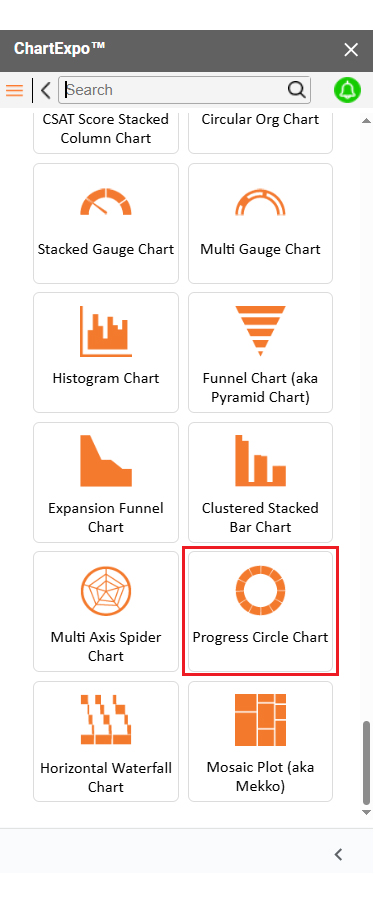
How to Install ChartExpo in Google Sheets?

  1. To start using ChartExpo, download it directly from the Google Sheets program. To do this, select Extensions from the top toolbar.
  2. A menu will appear. Click the Get add-ons option.
  3. Search for ChartExpo, and click on Charts, Graphs & Visualizations by ChartExpo when it appears in the results.
  4. Click the Install button. You will have to confirm your Google account and accept some permissions.

ChartExpo charts are available both in Google Sheets and Microsoft Excel. Please use the following CTAs to install the tool of your choice and create beautiful visualizations in a few clicks in your favorite tool.

Example

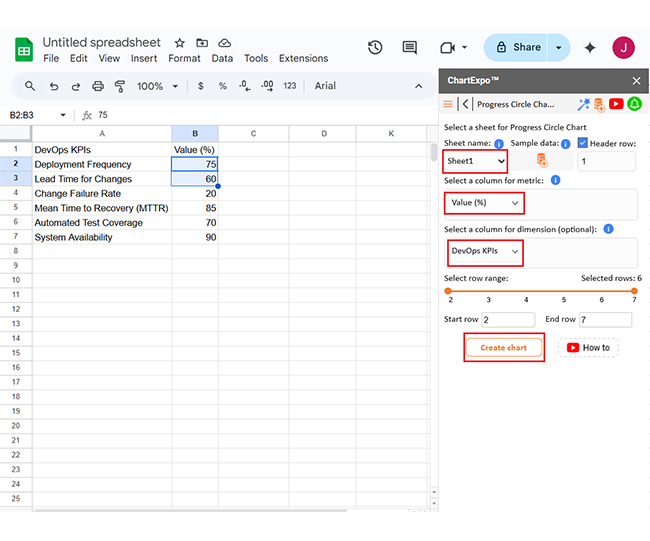
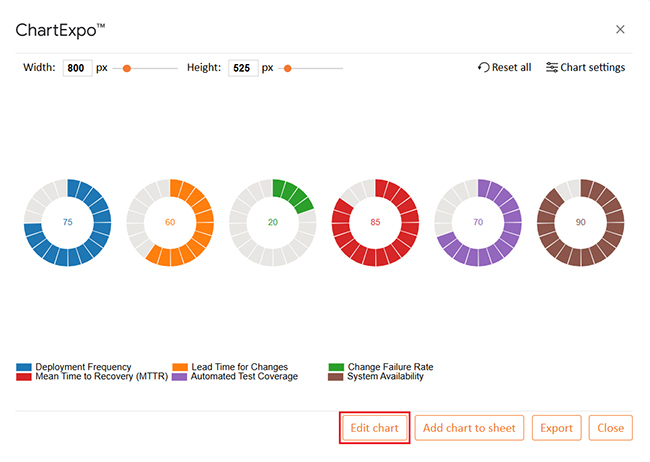
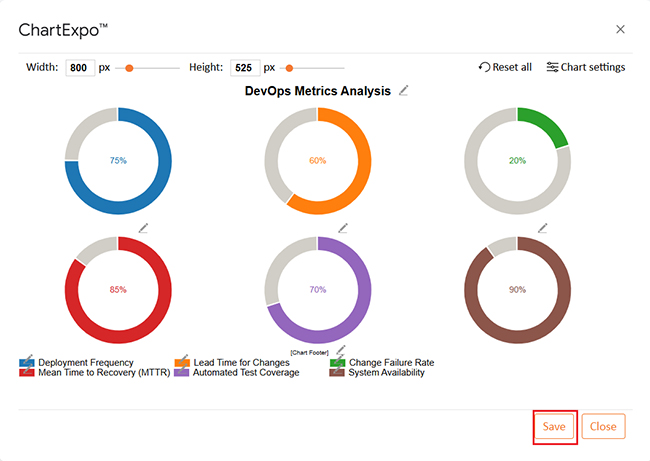
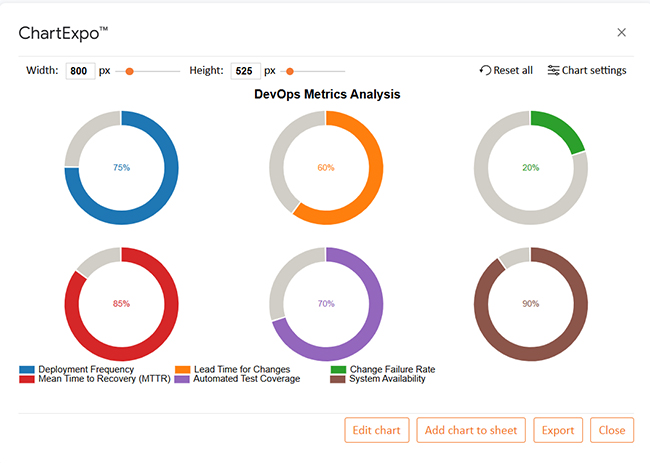
Let’s analyze this sample data in Google Sheets using ChartExpo.

DevOps KPIs Value (%)
Deployment Frequency 75
Lead Time for Changes 60
Change Failure Rate 20
Mean Time to Recovery (MTTR) 85
Automated Test Coverage 70
System Availability 90
  • To get started with ChartExpo, install ChartExpo in Google Sheets.
  • Go to Extensions > Charts, Graphs & Visualizations by ChartExpo > Open.
DevOps Performance Metrics
  • To access the charts library, click the Add new chart button.
DevOps Performance Metrics
  • Once it loads, scroll through the charts list to locate and choose the “Progress Circle Chart”.
DevOps Performance Metrics
  • Put the data table in the sheet first. Then, choose the Sheet name from the drop-down in the ChartExpo section.
  • Select the metric column; metric is the numeric column in your data sheet.
  • Select the dimensions column; the dimension is the categorical column in your datasheet that contains text information.
  • Click the Create chart button to complete the process.
DevOps Performance Metrics
  • If you want to add anything to the chart, click the Edit Chart button:
DevOps Performance Metrics
  • Click the pencil icon next to the Chart Header to change the title.
  • It will open the properties dialog. Under the Text section, you can add a heading in Line 1 and enable Show.
  • Give the appropriate title of your chart and click the Apply button.
DevOps Performance Metrics
  • You can add the percentage sign with all values as follows:
DevOps Performance Metrics
  • You can change the data representation by clicking on Settings as follows:
DevOps Performance Metrics
  • After making all the changes, click on the “Save” button:
DevOps Performance Metrics
  • Your final chart will look like the one below.
DevOps Performance Metrics

Insights

  • System Availability: Strong performance at 90%, indicating high uptime.
  • Mean Time to Recovery (MTTR): Solid at 85%, showing effective recovery processes.
  • Deployment Frequency: Healthy rate at 75%, supporting consistent delivery.
  • Test Coverage: Good coverage at 70% indicates stable code quality.
  • Lead Time for Changes: Needs improvement at 60%, slowing release cycles.
  • Change Failure Rate: High at 20%, signaling a need to boost release quality and stability.

How to Improve DevOps Metrics?

Improving DevOps metrics isn’t about doing more—it’s about working smarter. Teams don’t need more dashboards. They need better habits backed by sharp, focused data. So, how do you level up your numbers and your delivery?

Follow these steps:

  • Automate processes: Automation reduces human error and speeds up delivery. It sharpens SaaS key performance indicators by making workflows more consistent.
  • Enhance monitoring and feedback: Better monitoring means fewer surprises. Real-time feedback leads to faster fixes and stronger performance metrics.
  • Foster collaboration: Dev and Ops can’t live in silos. Shared goals and communication create smoother pipelines and fewer blockers.
  • Invest in testing: More automated tests mean fewer bugs in production. This directly improves business metrics like uptime and customer satisfaction.
  • Analyze and learn from failures: Failures aren’t the enemy—silence is. Dig into what went wrong and turn it into a roadmap for improvement.
  • Continuously review KPIs: Metrics should evolve with your team. Keep them fresh, relevant, and aligned with tangible goals.

Tips for Choosing Perfect DevOps Metrics

Choosing the right DevOps metrics can feel overwhelming. But it doesn’t have to be. The goal is to track what truly drives improvement, not what looks impressive in a report.

Here’s how to make your metrics count without drowning in data.

  • Align with business outcomes: Pick metrics that connect directly to business impact. Business metrics like customer satisfaction or revenue growth show real value, not busy work.
  • Measure results, not motion: Don’t track effort—track outcomes. DevOps performance metrics should reflect progress, not activity.
  • Balance speed with reliability: Quick releases are great, but only if they’re stable. Monitor delivery pace and system health to avoid trade-offs that hurt long-term performance.
  • Keep metrics simple and useful: If a metric can’t drive action, drop it. Focus on precise, actionable data that your team understands and can improve.
  • Revisit and refine regularly: Your goals will evolve, and so will your metrics. Review and adjust them to stay aligned with what matters.

FAQs

What are the 4 metrics of DevOps?

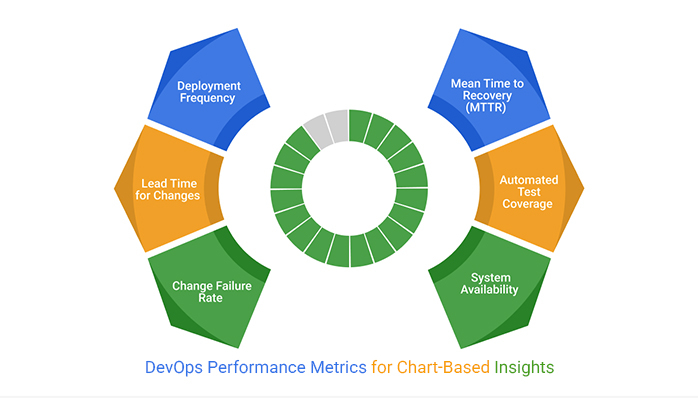
The four key DevOps Performance Metrics are:

  • Deployment Frequency.
  • Lead Time for Changes.
  • Change Failure Rate.
  • Mean Time to Recovery (MTTR).

They measure speed, quality, and system reliability.

How to measure DevOps maturity?

  • Track core Metrics and KPIs
  • Evaluate automation levels
  • Assess collaboration between teams
  • Review deployment consistency
  • Measure incident response time
  • Use KPI Graphs for trends

Wrap Up

DevOps performance metrics help teams measure what matters. They show how fast, stable, and reliable your delivery pipeline is. Without them, you’re guessing.

These metrics aren’t just numbers. They reflect real outcomes—faster releases, fewer bugs, and happier users. That’s why innovative teams track them closely.

Using SMART KPI examples brings clarity. Goals like “reduce MTTR by 20% in Q3” give teams focus. Vague goals don’t drive action—specific ones do.

SaaS key performance indicators add business value. They tie technical efforts to customer success, retention, and uptime. When DevOps aligns with business goals, everyone wins.

Improving these metrics takes effort. It means better testing, automation, and teamwork. But the payoff is worth it—more reliable software and faster innovation.

Conclusively, DevOps performance metrics turn data into direction. They guide decisions, track progress, and build accountability. Measure what matters—and improve what counts.

How much did you enjoy this article?

GSAd1
Start Free Trial!
154875

Related articles

next previous
Data Analytics8 min read

Social Media Dashboard to Improve Marketing Insights

This guide delves into what a social media dashboard is and how to create one. You'll also discover how to use a social media dashboard and more.

Data Analytics10 min read

Consulting Report Template for Better Decision Insights

A consulting report template organizes insights and data for clients. Click here to learn how to write, analyze, and enhance reports with charts and examples.

Data Analytics10 min read

Data Export in Salesforce: Insights Made Simple

Salesforce data export helps you download and use your CRM data. Click here to learn how to export, analyze, and track sales with easy steps and visuals.

Data Analytics10 min read

Analytics in Banking Industry: A Complete Walkthrough

Learn how analytics in the banking industry improves decisions and manages risks. Explore key types, uses, and tips to make data work for your bank.

Data Analytics9 min read

What is a Confusion Matrix? A Quick Guide

Understand what a confusion matrix is and how it helps evaluate the accuracy of predictions, interpret model results, & enhance analysis in classification tasks.

ChartExpo logo

Turn Data into Visual
Stories

CHARTEXPO

  • Home
  • Gallery
  • Videos
  • Services
  • Pricing
  • Contact us
  • FAQs
  • Privacy policy
  • Terms of Service
  • Sitemap

TOOLS

  • ChartExpo for Google Sheets
  • ChartExpo for Microsoft Excel
  • Power BI Custom Visuals by ChartExpo
  • Word Cloud

CATEGORIES

  • Bar Charts
  • Circle Graphs
  • Column Charts
  • Combo Charts
  • Comparison Charts
  • Line Graphs
  • PPC Charts
  • Sentiment Analysis Charts
  • Survey Charts

TOP CHARTS

  • Sankey Diagram
  • Likert Scale Chart
  • Comparison Bar Chart
  • Pareto Chart
  • Funnel Chart
  • Gauge Chart
  • Radar Chart
  • Radial Bar Chart
  • Sunburst Chart
  • see more
  • Scatter Plot Chart
  • CSAT Survey Bar Chart
  • CSAT Survey Chart
  • Dot Plot Chart
  • Double Bar Graph
  • Matrix Chart
  • Multi Axis Line Chart
  • Overlapping Bar Chart
  • Control Chart
  • Slope Chart
  • Clustered Bar Chart
  • Clustered Column Chart
  • Box and Whisker Plot
  • Tornado Chart
  • Waterfall Chart
  • Word Cloud
  • see less

RESOURCES

  • Blog
  • Resources
  • YouTube
SIGN UP FOR UPDATES

We wouldn't dream of spamming you or selling your info.

© 2025 ChartExpo, all rights reserved.