• Home
  • Tools dropdown img
    • Spreadsheet Charts

      • ChartExpo for Google Sheets
      • ChartExpo for Microsoft Excel
    • Power BI Charts

      • Power BI Custom Visuals by ChartExpo
    • Word Cloud

  • Charts dropdown img
    • Chart Category

      • Bar Charts
      • Circle Graphs
      • Column Charts
      • Combo Charts
      • Comparison Charts
      • Line Graphs
      • PPC Charts
      • Sentiment Analysis Charts
      • Survey Charts
    • Chart Type

      • Box and Whisker Plot
      • Clustered Bar Chart
      • Clustered Column Chart
      • Comparison Bar Chart
      • Control Chart
      • CSAT Survey Bar Chart
      • CSAT Survey Chart
      • Dot Plot Chart
      • Double Bar Graph
      • Funnel Chart
      • Gauge Chart
      • Likert Scale Chart
      • Matrix Chart
      • Multi Axis Line Chart
      • Overlapping Bar Chart
      • Pareto Chart
      • Radar Chart
      • Radial Bar Chart
      • Sankey Diagram
      • Scatter Plot Chart
      • Slope Chart
      • Sunburst Chart
      • Tornado Chart
      • Waterfall Chart
      • Word Cloud
    • Google Sheets
      Microsoft Excel
  • Services
  • Pricing
  • Contact us
  • Blog
  • Support dropdown img
      • Gallery
      • Videos
      • Contact us
      • FAQs
      • Resources
    • Please feel free to contact us

      atsupport@chartexpo.com

Categories
All Data Visualizations Data Analytics Surveys
Add-ons/
  • Google Sheets
  • Microsoft Excel
  • Power BI
All Data Visualizations Data Analytics Surveys
Add-ons
  • Google Sheets
  • Microsoft Excel
  • Power BI

We use cookies

This website uses cookies to provide better user experience and user's session management.
By continuing visiting this website you consent the use of these cookies.

Ok

ChartExpo Survey


Home > Blog > Power BI

Database Versus Data Warehouse: The Ultimate Comparison

A database is a system for managing and storing structured data. A data warehouse, on the other hand, aggregates large volumes of historical data for analysis. The primary difference lies in their structure and purpose.

Database versus Data Warehouse

This guide dives deep into the database versus data warehouse debate. It also uncovers the difference between database and data warehouse, and the database vs data warehouse comparison. Furthermore, you’ll discover how to analyze data warehouses vs databases using data visualization tools.

Table of Contents:

  1. What is a Data Warehouse vs Database?
  2. Difference Between Database and Data Warehouse
  3. Database and Data Warehouse Use Cases
  4. How to Analyze Data Warehouses vs Databases Using Power BI?
  5. Database vs Data Warehouse: Which one is Right for you?
  6. FAQs
  7. Wrap Up

What is a Data Warehouse vs Database?

Definition: A database is designed for real-time transactional processing, managing current, operational data with high efficiency for day-to-day business activities.

A data warehouse, on the other hand, aggregates large volumes of historical data from multiple sources for reporting and analysis.

Difference Between Database and Data Warehouse

Here’s a table explaining the differences between a Database and a Data Warehouse:

Aspect Database Data Warehouse
Purpose Handles real-time transactional data Stores large volumes of historical data for analysis and reporting
Data Structure Data is normalized to reduce redundancy Data is often denormalized for fast querying
Data Volume Typically smaller, real-time data Handles large volumes of historical data
Data Update Data is updated frequently in real-time Data is updated in batches, typically periodically (e.g., nightly)
Usage Used by operational users for daily tasks Used by analysts and decision-makers for reporting and analysis
Query Complexity Handles simple queries and updates Supports complex queries and aggregations
Performance Focus Optimized for fast transaction processing Optimized for fast querying and reporting
Example Customer orders, inventory management Business intelligence reports, historical analysis
Data Integration Typically contains data from a single source Integrates data from multiple sources for comprehensive analysis

Database and Data Warehouse Use Cases

Database Use Cases:

  1. Customer Relationship Management (CRM): Databases are used in CRM systems to store real-time customer data like purchase history, interaction logs, and contact information.
  2. Inventory Management: Manufacturers and retailers use databases to track inventory in real-time. The database stores data related to product details, sales, and stock levels.
  3. Online Transaction Processing (OLTP): Online platforms and E-commerce websites rely on databases to manage customer orders, user interactions, and payments. The system provides instant updates to support real-time operations.

Data Warehouse Use Cases:

  1. Business Reporting and Intelligence: Organizations use data warehouses to consolidate data from multiple sources (like external systems and databases) for reporting and analysis.
  2. Sales and Marketing Analytics: Marketing teams use data warehouses to analyze customer behavior, marketing campaign performance, and sales trends.
  3. Financial Reporting and Forecasting: Financial departments use data warehouses to track trends, analyze historical financial data, and generate reports for strategic planning.

How to Analyze Data Warehouses vs Databases Using Power BI?

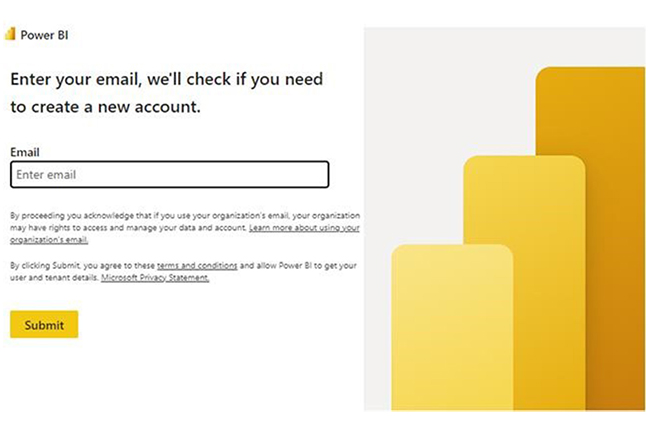
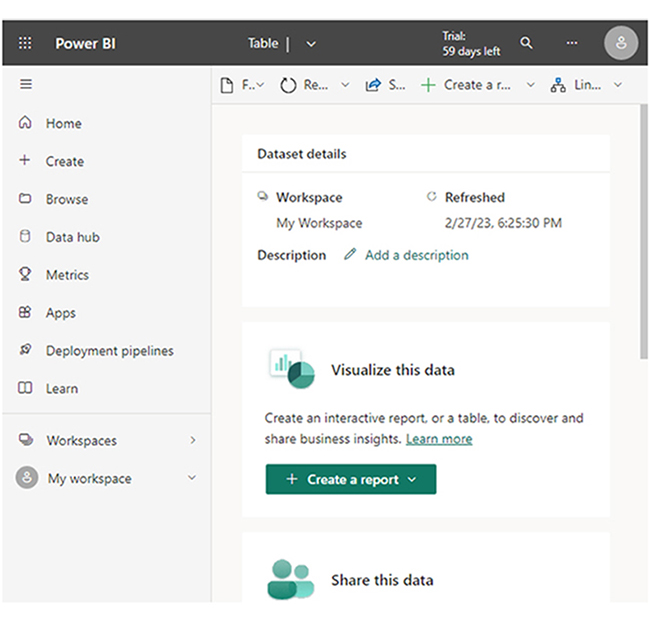
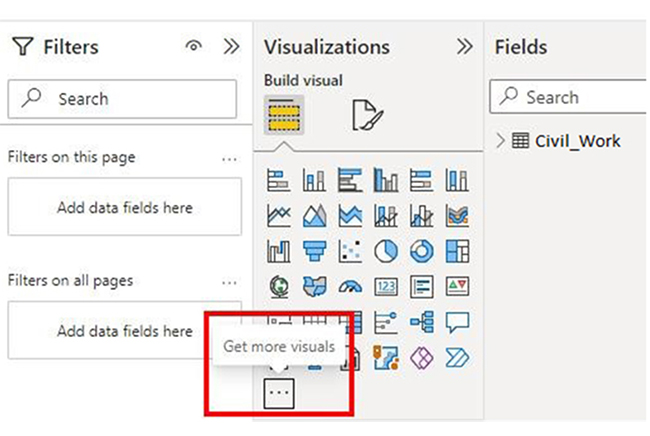
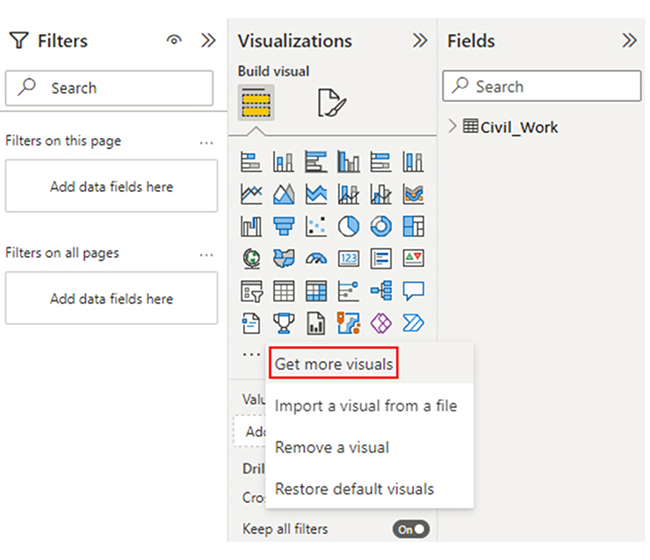
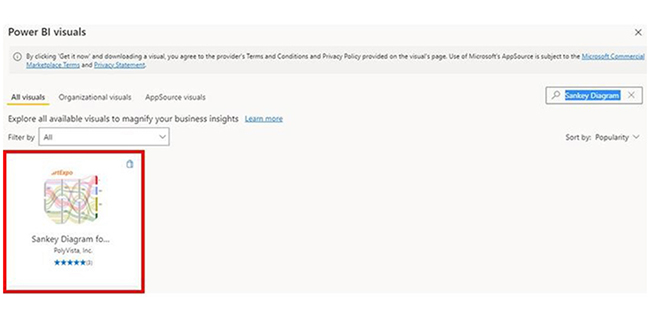
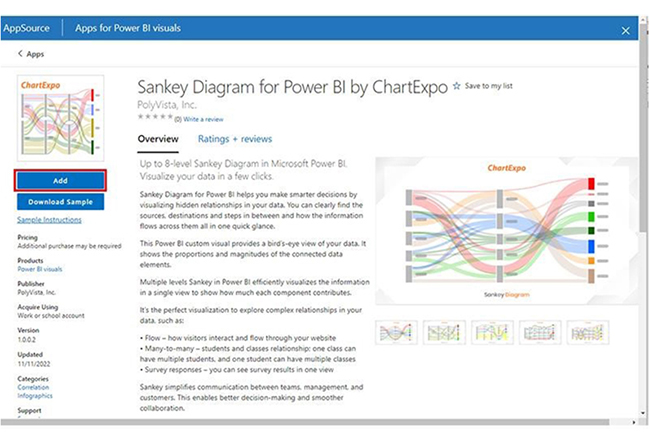
Whether you’re using Power BI for Mac or the regular Power BI for PC, this section shows you how to perform data analysis. You’ll also discover some Power BI design ideas, and how to use Power BI.

  • Stage 1: Log into Power BI, enter your email address, and click the “Submit” button.
Database versus Data Warehouse
  • You’ll be redirected to a Microsoft account. Enter your password, and click “Sign in.”
Database versus Data Warehouse
  • You can opt to stay signed in.
Database versus Data Warehouse
  • Stage 2: Create a Data Set and Select the Data Set to Use in the Chart
  • Navigate to the left-side menu, and click the “Create” button. After that, select “Paste or manually enter data.”
Database versus Data Warehouse
  • The data table below will be used for this illustration.
Database versus Data Warehouse
  • Paste the data table above into the “Power Query” window. Next, select the “Create a dataset only” option.
Database versus Data Warehouse
  • Navigate to the left-side menu, and click on the “Data Hub” option. Power BI will populate the data set list. If no data set has been created, you’ll get an error message.
Database versus Data Warehouse
  • Choose the data set to be used for the creation of the Sankey diagram in Power BI. Power BI will populate the screen as shown below.
Database versus Data Warehouse
  • From the dropdown, click “Create a report.” After that, select “Start from scratch.”
Database versus Data Warehouse
  • The Report Canvas is displayed as shown below.
Database versus Data Warehouse
  • Stage 3: Add the Power BI Sankey Diagram Extension by ChartExpo
  • To create the Sankey Diagram, you’ll need an add-in or Power BI visual from AppSource. You’ll have to navigate to the right side of the Power BI dashboard and open the Power BI Visualizations panel.
  • After that, click the ellipsis symbol (…) to import the Power BI Sankey Diagram extension by ChartExpo.
Database versus Data Warehouse
  • From the menu that opens, select the “Get more visuals” option.
Database versus Data Warehouse
  • In the window that opens, enter “Sankey Diagram for Power BI by ChartExpo” in the highlighted search box. You’ll see the “Sankey Diagram for Power BI by ChartExpo.”
Database versus Data Warehouse
  • Click the highlighted “Add” button.
Database versus Data Warehouse
  • The “Sankey Diagram for Power BI by ChartExpo” icon will be added to the visualization panel.
Database versus Data Warehouse
  • Stage 4: Draw a Sankey Diagram with ChartExpo’s Power BI extension.
  • Select the “Sankey Diagram for Power BI by ChartExpo” icon from the visualization panel. A window similar to the one below will open in the report section of your dashboard.
Database versus Data Warehouse
  • There’s the option of resizing the visual. You’ll have to navigate to the right side of the Power BI dashboard, and look out for “Fields” next to “Visualizations.”
Database versus Data Warehouse
  • You’ll have to select the fields to be used in the Sankey chart. Fields should be selected in the following sequence:
  • Total Cost
  • Company Type
  • Company Name
  • Expertise Categories
  • Expertise
  • Cost
Database versus Data Warehouse
  • You’ll have to provide the ChartExpo License Key or an email address.
Database versus Data Warehouse
  • Stage 5: Apply a Subscription Key or Activate the ChartExpo Trial.
  • Select the ChartExpo visual, and look out for the three icons below “Build Visual” in the Visualizations panel.
Database versus Data Warehouse
  • Select the middle icon, “Format visual.” You’ll see the visual properties populated as shown below.
Database versus Data Warehouse
  • New users should enter their email address in the textbox under the “Trial Mode” section. The license key will be sent to the email. After that, toggle “Enable Trial” to activate the 7-day trial.
Database versus Data Warehouse
  • The Sankey Diagram created under the 7-day trial comes with the ChartExpo watermark.
Database versus Data Warehouse
  • If you have a license key, enter it in the “ChartExpo License Key” textbox in the “License Settings” section. After that, slide the toggle switch next to “Enable License” to “On.”
Database versus Data Warehouse
  • The Sankey diagram created will not have a watermark.
Database versus Data Warehouse
  • You can add a Prefix (like the $ sign) with the numeric values in the chart. To do that, expand the “Stats” properties and include the Prefix value.
Database versus Data Warehouse
  • To add colors to each node, expand the “Level Colors” properties and select the colors.
Database versus Data Warehouse
  • Changes will be saved automatically.
Database versus Data Warehouse

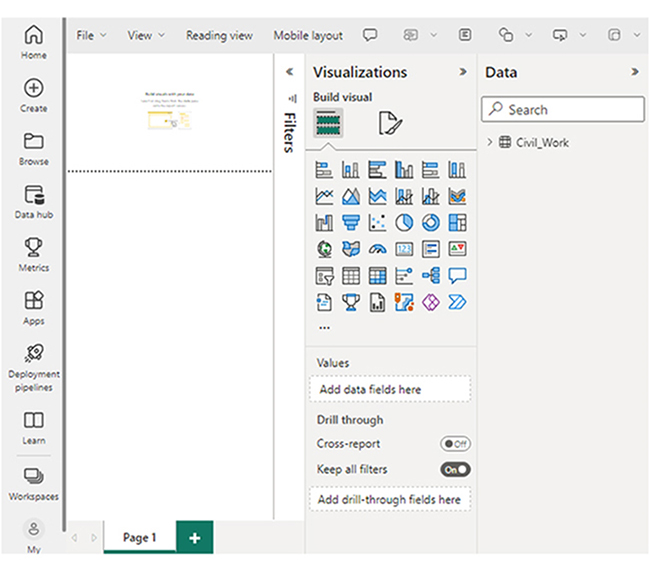
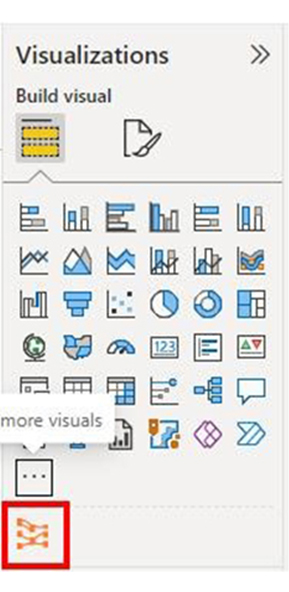
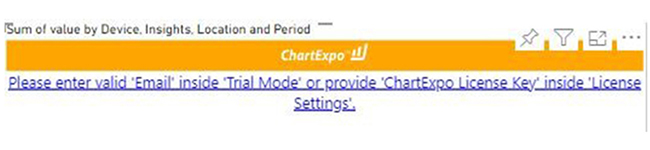
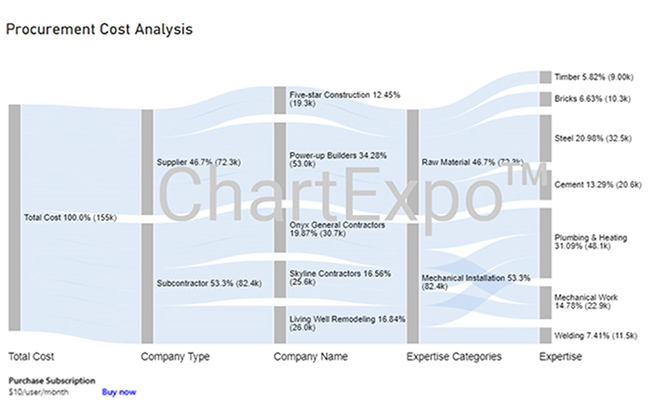
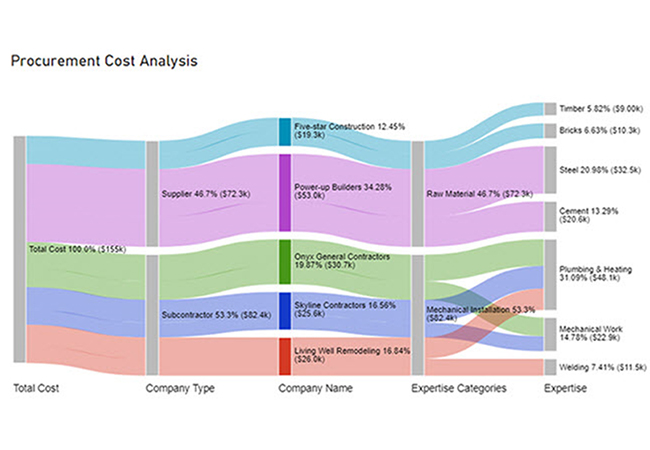
The Power BI report example above shows how the Power BI field parameter is used to perform a comprehensive data mining. To get the most out of the predictive analytics, you need to be familiar with Power BI advanced features like slicers in Power BI.

Insights

Here are key data interpretations you should know.

  • At Level 1 (Total Cost), the procurement cost is $155K.
  • At Level 2 (Company Type), out of the $155K cost, $72.3K (46.7%) was allocated to the supplier, while $82.4K (53.3%) was spent on subcontractors.
  • At Level 3 (Company Name), the $72.3K supplier cost was divided between two companies: Power-up Builder and Five-star Construction, with charges of $53.0K and $19.3K, respectively.
  • The subcontractor cost of $82.4K was distributed among three companies: Skyline Contractors, Living Well Remodeling, and Onyx General Contractors. They charged $25.6K, $26.0K, and $30.7K, respectively, for their services.

Database vs Data Warehouse: Which one is Right for you?

Choose a Database if you need:

  • Real-Time Transactions: Good fit for managing operational data like customer orders, financial transactions, and inventory management.
  • Frequent Updates: Databases support continuous data updates, and ensure information is current.
  • Small to Medium-Sized Data: Ideal for handling day-to-day operational tasks and moderate data volume.

Choose a Data Warehouse if you need:

  • Complex Data Analysis: Suitable for consolidating data from various sources to perform historical analysis and generate business intelligence insights.
  • Large Data Volume: They’re optimized to handle vast amounts of historical data.
  • Batch Processing: Great for analyzing large data sets. Unlike a database that’s updated in real-time, a data warehouse is updated periodically.

Conclusion:

  • Databases are great for real-time transactional needs and managing daily operations.
  • Data Warehouses are suitable for analyzing and reporting on large datasets over time. It supports business intelligence and data-driven decision-making.

FAQs:

What is the difference between database and data warehouse performance?

Databases are optimized for real-time transactional performance with quick updates and queries. Data Warehouses, on the other hand, are designed for high-performance analytical queries. It handles large volumes of historical data for insights and reporting.

Is SQL a database or data warehouse?

SQL (Structured Query Language) is neither a data warehouse nor a database. It’s a programming language used to manage and query relational databases and data warehouses for manipulating and retrieving data.

Is a data warehouse bigger than a database?

Yes, a data warehouse is larger than a database. It stores vast amounts of historical data for analysis and reporting. Databases, on the other hand, handle smaller, real-time transactional data for daily operations.

Wrap Up:

A database stores real-time transactional data for daily operations. It’s optimized for quick updates and queries. A data warehouse aggregates a large volume of historical data for reporting and analysis. It’s optimized for complex queries and decision-making.

One of the most common use cases of a database is in the banking systems. Banks use databases to manage and store transaction data for their customers. Databases handle everything from loan information to account balances, and that enables banks to offer services like payments, balance updates, and transfers.

A data warehouse is usually used in supply chain management. It helps companies in the supply chain industry analyze historical and real-time data, predict demand patterns, and optimize inventory management.

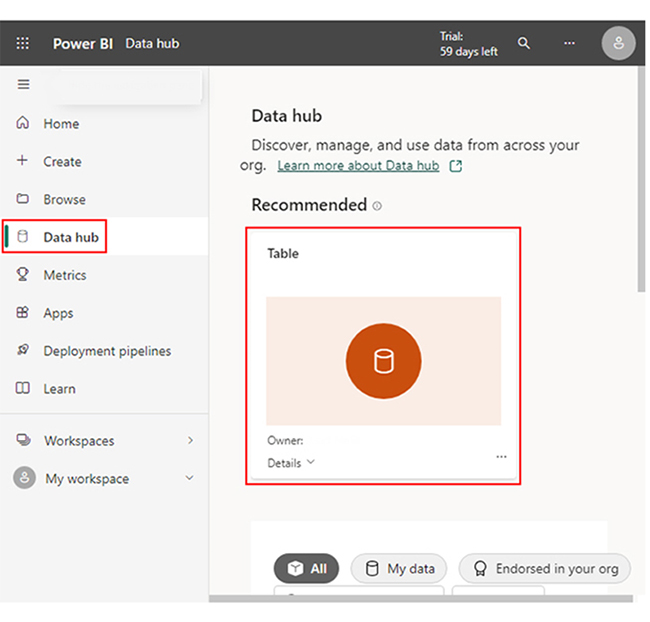
As an analyst, the Power BI service offers a robust toolkit to help you handle Power BI datasets. This will, in turn, elevate your data and analytics service offerings.

Now you have a good grasp of the database versus data warehouse, how will it impact your data visualization process?

How much did you enjoy this article?

PBIAd2
Start Free Trial!
148006

Related articles

next previous
Power BI12 min read

Power BI Group By Guide for Effective Data Insights

Learn how Power BI Group By helps you aggregate data, clarify trends, and create reports by grouping values to make large datasets manageable & insightful.

Power BI12 min read

How to Create Sankey Diagram in Microsoft Power BI?

Learn How to Create Sankey Diagram in Microsoft Power BI using Desktop & Web Service. What they are and how to use them effectively.

Power BI8 min read

Power BI Artificial Intelligence: Insights Using Visuals

Discover all there is to know about the Power BI artificial intelligence. You'll also discover how AI is used in Power BI, and how to use it for analysis and more.

Power BI9 min read

Budgeting in Healthcare: Use Visuals to Spot Budget Gaps

This guide helps you discover what budgeting in healthcare is. You'll also discover the factors that affect hospital budgets and types of budgeting in healthcare.

Power BI9 min read

Predictive Analytics in Power BI for Making Insightful Visuals

This guide shows you everything you need to know about Predictive Analytics in Power BI. It also shows you how it works, and how to interpret the results.

ChartExpo logo

Turn Data into Visual
Stories

CHARTEXPO

  • Home
  • Gallery
  • Videos
  • Services
  • Pricing
  • Contact us
  • FAQs
  • Privacy policy
  • Terms of Service
  • Sitemap

TOOLS

  • ChartExpo for Google Sheets
  • ChartExpo for Microsoft Excel
  • Power BI Custom Visuals by ChartExpo
  • Word Cloud

CATEGORIES

  • Bar Charts
  • Circle Graphs
  • Column Charts
  • Combo Charts
  • Comparison Charts
  • Line Graphs
  • PPC Charts
  • Sentiment Analysis Charts
  • Survey Charts

TOP CHARTS

  • Sankey Diagram
  • Likert Scale Chart
  • Comparison Bar Chart
  • Pareto Chart
  • Funnel Chart
  • Gauge Chart
  • Radar Chart
  • Radial Bar Chart
  • Sunburst Chart
  • see more
  • Scatter Plot Chart
  • CSAT Survey Bar Chart
  • CSAT Survey Chart
  • Dot Plot Chart
  • Double Bar Graph
  • Matrix Chart
  • Multi Axis Line Chart
  • Overlapping Bar Chart
  • Control Chart
  • Slope Chart
  • Clustered Bar Chart
  • Clustered Column Chart
  • Box and Whisker Plot
  • Tornado Chart
  • Waterfall Chart
  • Word Cloud
  • see less

RESOURCES

  • Blog
  • Resources
  • YouTube
SIGN UP FOR UPDATES

We wouldn't dream of spamming you or selling your info.

© 2025 ChartExpo, all rights reserved.