• Home
  • Tools dropdown img
    • Spreadsheet Charts

      • ChartExpo for Google Sheets
      • ChartExpo for Microsoft Excel
    • Power BI Charts

      • Power BI Custom Visuals by ChartExpo
    • Word Cloud

  • Charts dropdown img
    • Chart Category

      • Bar Charts
      • Circle Graphs
      • Column Charts
      • Combo Charts
      • Comparison Charts
      • Line Graphs
      • PPC Charts
      • Sentiment Analysis Charts
      • Survey Charts
    • Chart Type

      • Box and Whisker Plot
      • Clustered Bar Chart
      • Clustered Column Chart
      • Comparison Bar Chart
      • Control Chart
      • CSAT Survey Bar Chart
      • CSAT Survey Chart
      • Dot Plot Chart
      • Double Bar Graph
      • Funnel Chart
      • Gauge Chart
      • Likert Scale Chart
      • Matrix Chart
      • Multi Axis Line Chart
      • Overlapping Bar Chart
      • Pareto Chart
      • Radar Chart
      • Radial Bar Chart
      • Sankey Diagram
      • Scatter Plot Chart
      • Slope Chart
      • Sunburst Chart
      • Tornado Chart
      • Waterfall Chart
      • Word Cloud
    • Google Sheets
      Microsoft Excel
  • Services
  • Pricing
  • Contact us
  • Blog
  • Support dropdown img
      • Gallery
      • Videos
      • Contact us
      • FAQs
      • Resources
    • Please feel free to contact us

      atsupport@chartexpo.com

Categories
All Data Visualizations Data Analytics Surveys
Add-ons/
  • Google Sheets
  • Microsoft Excel
  • Power BI
All Data Visualizations Data Analytics Surveys
Add-ons
  • Google Sheets
  • Microsoft Excel
  • Power BI

We use cookies

This website uses cookies to provide better user experience and user's session management.
By continuing visiting this website you consent the use of these cookies.

Ok

ChartExpo Survey


Home > Blog > Data Analytics

Calculating Revenue Growth for Better Growth Analysis

Revenue data tells a story, but only those who know how to read it gain a real competitive edge. Calculating revenue growth converts raw financial numbers into a clear picture of business momentum, showing whether a company is gaining ground or losing pace over time.

Calculating Revenue Growth

For leaders and analysts, this metric shapes every strategic conversation about sustainable scaling. From monthly check-ins to annual board reviews, revenue growth figures drive investment priorities, sales targets, and market expansion plans.

Businesses that track this consistently are better positioned to spot financial risk early, seize opportunity before competitors, and build long-term strategies grounded in data rather than guesswork.

What is Revenue Growth?

Definition: Calculating revenue growth is the process of measuring the percentage change in a company’s total income between two defined periods. It quantifies how effectively a business is expanding sales and deepening its market position.

Put simply, calculating revenue growth places two time periods side by side, whether monthly, quarterly, or annually, to express the difference as a percentage. That figure tells stakeholders whether the business is accelerating, holding steady, or contracting.

Teams across finance, sales, and leadership use the result to benchmark performance, confirm that strategies are producing returns, and flag areas where adjustments are needed to stay on track with long-term goals.

Key Components of Revenue Growth

Before applying the steps for calculating revenue growth, it helps to know which underlying variables actually move the numbers. Recognizing each one gives businesses the context to explain why their totals shifted, not just by how much.

Core factors to examine include:

  • Total revenue (current period): The combined income earned across all channels during the most recent reporting window.
  • Total revenue (previous period): The baseline income figure from the earlier period that serves as the reference point for comparison.
  • Revenue streams segmentation: Separating income by product line, service tier, or channel strengthens sales analytics and pinpoints which sources deliver the most value.
  • Pricing strategy impact: Any change in unit price, discount structure, or bundling directly shifts total revenue, often before volume changes take effect.
  • Customer acquisition rate: The pace at which new customers enter the business during a period adds fresh revenue that supplements existing income.
  • Customer retention rate: Keeping existing customers active produces recurring income and protects the revenue base from sudden drops.
  • Market demand and expansion factors: Shifts in consumer demand, competitive dynamics, and entry into new markets all affect velocity. Reviewing gross annual sales gives teams a broader lens for interpreting these movements over longer horizons.

Explaining the Revenue Growth Formula

Calculating revenue growth relies on a single, repeatable formula that converts two revenue figures into a meaningful percentage. Once that percentage is in hand, performance becomes directly comparable across any time period the business chooses to examine.

Revenue Growth Formula:

Revenue Growth = Previous Revenue (Current Revenue − Previous Revenue) ×100

Start by subtracting the earlier period’s revenue from the current period’s total to isolate the change. Divide that figure by the prior revenue to produce a ratio, then multiply by 100 to convert it into a percentage that is easy to communicate and compare.

Consistently applying this approach to calculating revenue growth across reporting cycles gives teams a reliable benchmark and makes it far easier to set defensible targets for the periods ahead.

Types of Revenue Growth Calculations

Businesses choose from several approaches when applying the process of calculating revenue growth, each suited to different reporting windows and analytical goals.

The most widely used methods include:

  • Year-over-Year (YoY) growth: Measures income from a given period against the same period twelve months prior, with results often mapped on a year-over-year growth chart for stakeholder reporting.
  • Quarter-over-Quarter (QoQ) growth: Tracks revenue shifts across consecutive three-month windows, surfacing short-cycle trends that annual data tends to smooth over.
  • Month-over-Month (MoM) growth: Compares one month’s totals to the previous month’s, making it straightforward to detect seasonal swings or the early impact of a campaign.
  • Compound Annual Growth Rate (CAGR): Smooths out year-to-year volatility to express a single, consistent rate of increase across a multi-year span, useful for long-range planning.
  • Absolute revenue growth: States the raw dollar amount gained between two periods. When calculating revenue growth for executive summaries, this figure often accompanies the percentage to provide context for the rate.

How to Calculate Revenue Growth?

Accurately calculating revenue growth starts with a consistent process. Each step below reduces the risk of errors and ensures the resulting figure reflects true financial performance.

Apply these steps in sequence:

  • Identify the comparison time periods: Decide on a consistent window, whether monthly, quarterly, or annual, before pulling any data to keep the resulting figure comparable across cycles.
  • Gather revenue data for both periods: Pull confirmed financial records, invoices, or reports for each period. Organizing these in a spreadsheet for sales tracking keeps the dataset clean and auditable.
  • Subtract previous revenue from current revenue: Deduct the earlier period’s total from the current one to isolate the net change, whether that figure is positive or negative.
  • Divide the difference by the previous revenue: Express the change as a proportion of the starting baseline. This ratio makes the shift meaningful regardless of the business’s overall size, and supports planning with a sales projection template.
  • Multiply the result by 100: Convert the ratio to a percentage so the output is immediately readable in reports, dashboards, and stakeholder presentations.

Revenue Growth Examples

Applying the process of calculating revenue growth to real scenarios shows how different reporting windows produce distinct insights for business decision-making.

  • Year-over-Year Revenue Comparison

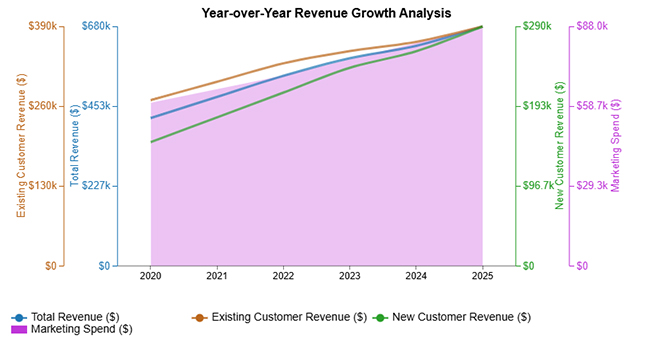
This year-over-year revenue analysis shows consistent income expansion from 2020 to 2025, with rising contributions from both new and existing customers alongside a growing marketing investment each year.

Calculating Revenue Growth
  • Quarterly Revenue Increase

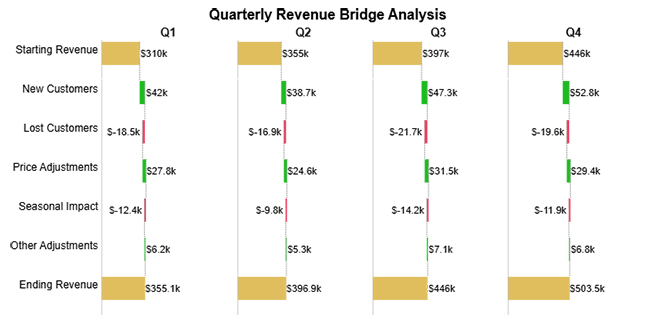
The quarterly revenue bridge illustrates how individual Q1 through Q4 gains and losses combine to produce the net movement from the period’s opening figure to its final total.

Calculating Revenue Growth
  • CAGR Over Multiple Years

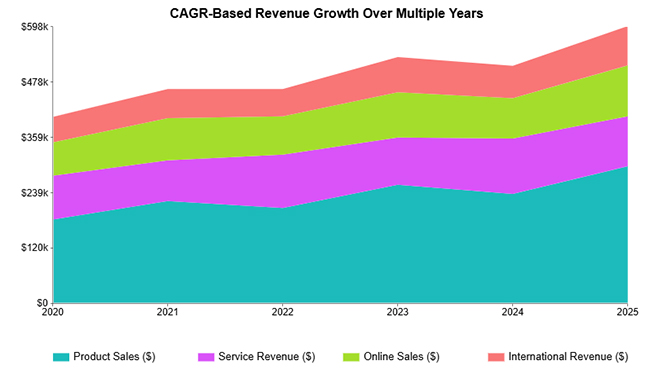
This multi-year view captures how several distinct revenue streams drive combined growth from 2020 to 2025, with visible fluctuations across the period that a single annual snapshot would miss.

Calculating Revenue Growth
  • Revenue Increase Breakdown by Business Drivers

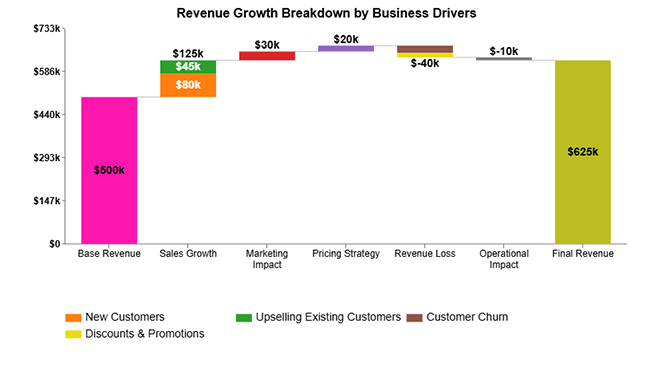
This breakdown traces how sales expansion, marketing activity, and pricing decisions push revenue from $500K to $625K, while also accounting for the minor losses that partially offset those gains.

Calculating Revenue Growth
  • Month-over-Month Revenue Trends by Source

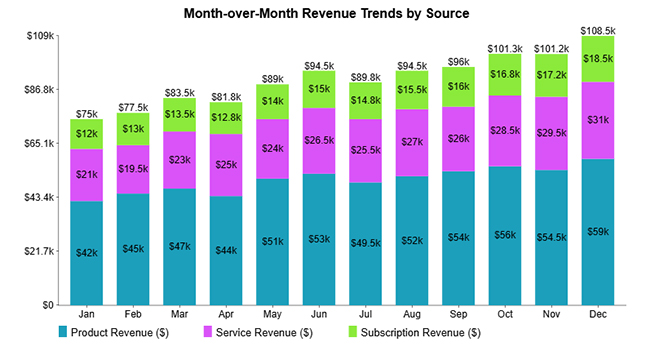
This month-by-month view separates product, service, and subscription income streams to show how each source contributes to total monthly performance across the full calendar year.

Calculating Revenue Growth

How to Analyze Revenue Growth in Google Sheets?

Google Sheets gives teams a practical environment for calculating revenue growth and tracking financial patterns without specialist software. With the right structure and formulas in place, income data becomes far easier to interpret and act on across reporting periods.

  • Organize revenue data

Enter income figures by month, quarter, or year so the dataset has a consistent structure that supports reliable formula application.

  • Apply the revenue growth formula

Use built-in spreadsheet formulas to subtract the prior period’s total from the current one, divide by the earlier figure, and multiply by 100 to get the growth percentage.

  • Create visual charts

Add a line or column chart to the sheet so revenue shifts are immediately visible without requiring readers to scan rows of figures.

  • Use advanced visualization tools

Pairing your spreadsheet with a dedicated charting add-on produces interactive visuals that surface patterns that standard chart types can obscure.

  • Compare financial metrics

Placing income vs profit vs revenue side by side within the same sheet adds depth to the analysis and flags whether top-line gains are translating into real profitability.

  • Track cash flow efficiency

Including a column that uses calculated days’ sales outstanding alongside revenue totals shows how quickly earned income converts into cash that the business can actually use.

  • Final Insights

The waterfall chart shows revenue increasing from a $500k base through sales growth (+$125k), marketing (+$30k), and pricing strategy (+$20k), driven by new customers and upselling.

However, losses from churn, discounts, and operations (-$50k total) reduce gains, resulting in a final revenue of $625k.

Calculating Revenue Growth

Key Insights

  • Total revenue advanced from $500K to $625K across the period, producing a net gain of $125K.
  • The $125K in sales growth, generated through new customer wins and upselling to existing accounts, was the single largest driver of the overall increase.
  • Combined revenue losses of $50K, stemming from customer churn, discount activity, and delayed operations, partially offset the top-line gains without eliminating them.

Best Practices for Sustainable Revenue Growth

Tracking and calculating revenue growth is only half the equation. Sustaining that growth requires deliberate, repeatable operating habits that build the conditions for consistent upward momentum over time rather than isolated wins.

High-impact approaches include:

  • Diversify revenue streams: Broadening the mix of products, services, or sales channels means no single source carries the entire risk of a market downturn.
  • Focus on customer retention strategies: Keeping current customers engaged generates recurring income and reduces the cost-per-revenue-dollar compared to acquiring new accounts from scratch.
  • Optimize pricing models: Reviewing marginal revenue vs marginal cost at regular intervals ensures that pricing decisions support profitability rather than quietly eroding it.
  • Invest in high-performing marketing channels: Directing budget toward the channels that consistently convert attention into revenue avoids wasteful spending and compounds results over time.
  • Monitor key performance indicators regularly: Frequent review of growth metrics gives teams early warning of slowdowns and confirms whether current strategies are producing the intended results.
  • Use data-driven forecasting and planning: Structured tools such as a sales pipeline template let teams project future revenue with a consistent methodology rather than relying on intuition alone.

Revenue Growth Challenges and How to Avoid Them

Even when the process of calculating revenue growth produces a positive number, companies often encounter obstacles that make those results unreliable or hard to sustain. Several recurring pitfalls can undermine accuracy or limit long-term performance.

Watch for these common pitfalls:

  • Inaccurate data collection: Figures pulled from inconsistent sources or incomplete records produce calculations that misrepresent true performance and can mislead strategic decisions.
  • Overreliance on a single revenue source: Concentrating income in one product, client, or channel amplifies exposure when that source contracts or disappears.
  • Misinterpreting revenue vs profitability: A growing top line does not always mean a healthier business; conflating the two figures can lead teams to celebrate growth that is actually costing them money.
  • Short-term growth focus: Chasing rapid revenue spikes without a supporting operational plan often creates instability that is harder to recover from than slow, compounding growth.
  • Delayed payment cycles: When customers pay late, reported revenue and available cash diverge, creating a false sense of financial health that obscures real liquidity constraints.

FAQs

How to calculate 3 years’ revenue growth?

Start by identifying the revenue figure from year one and the revenue figure from year three. Calculating revenue growth across that span means subtracting the starting amount from the ending amount, dividing by the starting amount, and multiplying by 100 to express the total change as a percentage.

How to calculate revenue growth year over year?

Pull the revenue total from the current year and the equivalent figure from the prior year. Subtract last year’s amount from this year’s, divide the difference by last year’s total, and multiply by 100 to arrive at the year-over-year growth rate.

Is 12% revenue growth good?

In most industries, a 12% rate when calculating revenue growth signals solid momentum. Whether it is strong or merely adequate depends on the company’s stage, the competitive landscape, and the benchmarks that are standard for its particular market.

Wrap Up

Calculating revenue growth is one of the most direct ways a business can verify that its strategy is producing real results. When tracked with consistent data, the right formula, and meaningful time comparisons, the metric turns abstract financial activity into a clear progress signal that every level of leadership can act on.

Understanding how to calculate revenue growth is the first step, but the real advantage comes from building it into every reporting cycle as a consistent habit. Organizations that develop more than a number. They build the institutional discipline to catch problems early, validate what is working, and make resource decisions grounded in evidence rather than assumptions.

How much did you enjoy this article?

PBIAd1
Start Free Trial!
160970

Related articles

next previous
Data Analytics9 min read

Consulting Report Template: A Complete Guide

Consulting Report Template: structure insights, drive decisions, and deliver standout results. Discover how to build better reports now!

Data Analytics10 min read

Event Budget Template for Event Budget Insights

Event budget template keeps event finances clear and controlled. Use one to track costs, compare spending, and stay on budget. Learn more!

Data Analytics8 min read

MySQL ODBC Connector: Connect, Analyze, and Visualize

MySQL ODBC connector bridges MySQL databases and BI tools for secure, reliable data access across platforms. Set up yours today. Read on!

Data Analytics8 min read

Vanity Metrics: From Data Noise to Clear Insights

Vanity metrics can mislead teams into tracking numbers that never drive results. Discover what makes a metric truly actionable. Read on!

Data Analytics9 min read

Vertical Analysis and Horizontal Analysis: A Complete Guide

Vertical analysis and horizontal analysis reveal how financial statements shift over time and within a period. Learn both methods now!

ChartExpo logo

Turn Data into Visual
Stories

CHARTEXPO

  • Home
  • Gallery
  • Videos
  • Services
  • Pricing
  • Contact us
  • FAQs
  • Privacy policy
  • Terms of Service
  • Sitemap

TOOLS

  • ChartExpo for Google Sheets
  • ChartExpo for Microsoft Excel
  • Power BI Custom Visuals by ChartExpo
  • Word Cloud

CATEGORIES

  • Bar Charts
  • Circle Graphs
  • Column Charts
  • Combo Charts
  • Comparison Charts
  • Line Graphs
  • PPC Charts
  • Sentiment Analysis Charts
  • Survey Charts

TOP CHARTS

  • Sankey Diagram
  • Likert Scale Chart
  • Comparison Bar Chart
  • Pareto Chart
  • Funnel Chart
  • Gauge Chart
  • Radar Chart
  • Radial Bar Chart
  • Sunburst Chart
  • see more
  • Scatter Plot Chart
  • CSAT Survey Bar Chart
  • CSAT Survey Chart
  • Dot Plot Chart
  • Double Bar Graph
  • Matrix Chart
  • Multi Axis Line Chart
  • Overlapping Bar Chart
  • Control Chart
  • Slope Chart
  • Clustered Bar Chart
  • Clustered Column Chart
  • Box and Whisker Plot
  • Tornado Chart
  • Waterfall Chart
  • Word Cloud
  • see less

RESOURCES

  • Blog
  • Resources
  • YouTube
SIGN UP FOR UPDATES

We wouldn't dream of spamming you or selling your info.

© 2026 ChartExpo, all rights reserved.