• Home
  • Tools dropdown img
    • Spreadsheet Charts

      • ChartExpo for Google Sheets
      • ChartExpo for Microsoft Excel
    • Power BI Charts

      • Power BI Custom Visuals by ChartExpo
    • Word Cloud

  • Charts dropdown img
    • Chart Category

      • Bar Charts
      • Circle Graphs
      • Column Charts
      • Combo Charts
      • Comparison Charts
      • Line Graphs
      • PPC Charts
      • Sentiment Analysis Charts
      • Survey Charts
    • Chart Type

      • Box and Whisker Plot
      • Clustered Bar Chart
      • Clustered Column Chart
      • Comparison Bar Chart
      • Control Chart
      • CSAT Survey Bar Chart
      • CSAT Survey Chart
      • Dot Plot Chart
      • Double Bar Graph
      • Funnel Chart
      • Gauge Chart
      • Likert Scale Chart
      • Matrix Chart
      • Multi Axis Line Chart
      • Overlapping Bar Chart
      • Pareto Chart
      • Radar Chart
      • Radial Bar Chart
      • Sankey Diagram
      • Scatter Plot Chart
      • Slope Chart
      • Sunburst Chart
      • Tornado Chart
      • Waterfall Chart
      • Word Cloud
    • Google Sheets
      Microsoft Excel
  • Services
  • Pricing
  • Contact us
  • Blog
  • Support dropdown img
      • Gallery
      • Videos
      • Contact us
      • FAQs
      • Resources
    • Please feel free to contact us

      atsupport@chartexpo.com

Categories
All Data Visualizations Data Analytics Surveys
Add-ons/
  • Google Sheets
  • Microsoft Excel
  • Power BI
All Data Visualizations Data Analytics Surveys
Add-ons
  • Google Sheets
  • Microsoft Excel
  • Power BI

We use cookies

This website uses cookies to provide better user experience and user's session management.
By continuing visiting this website you consent the use of these cookies.

Ok

ChartExpo Survey


Home > Blog > Microsoft Excel

Days Sales Outstanding (DSO): Step by Step Guide

How to calculate days sales outstanding (DSO) might sound as exhilarating as watching grass grow. But fear not because mastering this essential metric can be your secret weapon in the financial arena.

calculate days sales outstanding

DSO guides you through the treacherous terrain of unpaid invoices and revenue streams. Think of it as the “Netflix and chill” of the business world. It’s about understanding the timing and flow of your company’s cash, but with less popcorn and more spreadsheets.

To put it into perspective, let’s take an example of Company A and Company B. Company A has a DSO of 40 days, while Company B has a DSO of 60 days.

What does this imply? Company A typically collects payments from its customers more efficiently than Company B. This gives them a healthier cash flow and potentially a competitive edge.

Now, prepare for an illuminating journey into how to calculate days sales outstanding.

As we embark on this quest to calculate days sales outstanding, remember that patience is our trusty companion. We’ll scrutinize payment patterns and customer behaviors like a skilled detective to crack the DSO code.

Table of Content:

  1. What is Days Sales Outstanding (DSO)?
  2. What are the Good Days of Sales Outstanding Ratio?
  3. Why are Days Sales Outstanding Important?
  4. How to Use Days Sales Outstanding?
  5. How to Calculate Days Sales Outstanding?
  6. How to Examine Days Sales Outstanding (DSO)?
  7. Wrap Up

Let’s get started.

What is Days Sales Outstanding (DSO)?

Definition: Days sales outstanding (DSO) measures the average days it takes to collect payments after a sale. It is a key indicator of a company’s receivables management efficiency.

To calculate days sales outstanding, you divide accounts receivable by average daily sales. Then, multiply the result by the number of days in the period.

A higher DSO suggests a longer cash conversion cycle, indicating potential liquidity challenges. Conversely, a lower DSO reflects quicker cash collection, enhancing cash flow.

Moreover, monitoring DSO helps you evaluate credit and collection policies and identify areas for improvement. Utilizing tools such as Slope Charts can enhance this evaluation by visualizing trends and changes over time. It is crucial for assessing financial health, managing working capital, and deciding credit terms and collections strategies.

What are the Good Days of Sales Outstanding Ratio?

A good day of sales outstanding (DSO) ratio varies by industry and company norms. Generally, a lower DSO is favorable, indicating efficient credit management and faster cash conversion. For many industries, a DSO below 45 days is considered good, reflecting prompt sales conversion into cash.

A low DSO implies effective receivables management, ensuring steady cash flow and financial stability. It can also indicate strong customer relationships and credit policies. However, what constitutes a “good” DSO depends on factors like industry standards, business models, and economic conditions.

Comparing DSO to industry benchmarks or historical performance provides valuable context. A declining trend in DSO over time is generally positive, signaling improvements in cash collection efficiency. Monitoring DSO alongside other financial metrics helps optimize credit terms, enhance liquidity, and maintain a robust financial position.

Why are Days Sales Outstanding Important?

Calculating a day’s sales outstanding (DSO) is more than just a financial metric. It serves as a compass guiding businesses through the labyrinth of financial health. Its importance spans from managing cash flow to strategic decision-making, influencing every facet of your company’s financial strategy.

  • Cash flow management: DSO is a linchpin in cash flow management. It measures how quickly your company can convert its sales into cash. A lower DSO means faster cash collection. This ensures a steady cash flow that you can use for operations, investments, and growth initiatives.
  • Working capital efficiency: DSO is a vital component of working capital management. It directly impacts the cash tied up in receivables. A shorter DSO indicates efficient working capital utilization, preventing excess capital from immobilizing in the accounts receivable cycle.
  • Customer credit evaluation: DSO offers insights into customer payment behaviors. Analyzing trends helps in evaluating the effectiveness of credit policies. A rising DSO may indicate potential credit risks, prompting a reassessment of credit terms and collection strategies.
  • Performance monitoring: Calculating days sales outstanding (DSO) acts as a performance barometer. When you calculate days’ sales outstanding and compare it against industry benchmarks or historical data, it provides valuable context. A declining trend in DSO over time reflects improved efficiency in receivables management, signaling positive financial performance.
  • Strategic decision-making: Beyond day-to-day operations, it influences strategic decisions. When you calculate days of sales outstanding, it aids in setting credit terms, defining collection policies, and determining optimal cash conversion cycles. You can use DSO insights to align financial strategies with broader business objectives.

How to Use Days Sales Outstanding?

Days sales outstanding involve a strategic blend of monitoring, analysis, and action. Here is a guide to help you navigate this terrain of cash flow management and financial efficiency.

  1. Set benchmarks: Start by establishing industry benchmarks for DSO. Compare your DSO to these benchmarks to gauge your performance. Deviations can highlight areas for improvement or areas where your company excels.
  2. Monitor trends: Track DSO trends over time. A rising DSO might indicate potential issues with receivables, credit policies, or customer payment behaviors. On the other hand, a declining trend signals improved cash conversion efficiency.
  3. Consumer segmentation: Use DSO to segment customers based on their payment behaviors. Identify which customer segments contribute to longer DSO and tailor credit terms or collection strategies accordingly. This targeted approach enhances overall efficiency.
  4. Optimize credit policies: DSO is a valuable tool for optimizing credit policies. Evaluate the impact of credit terms on DSO and adjust accordingly. Striking the right balance ensures credit policies align with your company’s risk tolerance while facilitating timely cash collection.
  5. Enhance collection strategies: Calculate the day’s sales outstanding to refine collection strategies. A deep dive into receivables aging can identify overdue accounts. Implement proactive collection measures for aged receivables, ensuring a more assertive approach to managing outstanding payments.
  6. Align with working capital goals: Calculate days sales outstanding to align with working capital goals. Efficient working capital management involves optimizing DSO to prevent unnecessary capital immobilization in receivables. This ensures that capital is available for operational needs and growth initiatives.
  7. Inform strategic decision-making: Leverage DSO insights to inform strategic decision-making. The data can guide decisions on credit terms, collection policies, and overall financial strategies. Aligning these decisions with DSO trends ensures a holistic approach to financial management.

How to Calculate Days Sales Outstanding?

Here is the DSO calculation formula:

DSO= (Accounts Receivable )/Net Credit Sales — Number of Days

Example: Suppose your company has $500,000 in accounts receivable and $1,000,000 in net credit sales over a quarter. Assuming a quarter consists of 90 days.

To calculate DSO:

DSO= $500,000/1,000,000 —90 = 45

So, the days sales outstanding for this example is 45 days. On average, your company takes 45 days to collect payments after a sale. Monitoring this metric helps assess the efficiency of your company’s credit and collection processes.

How to Examine Days Sales Outstanding (DSO)?

Days sales outstanding (DSO) holds the keys to unlocking the secrets of accounts receivable. However, deciphering the mysteries hidden within columns and rows can feel like finding a needle in a haystack.

But don’t worry. The superhero capes of data visualization rescue us from drowning in a sea of digits. Yet, poor Excel, noble as it is, falls short in dynamic and impactful data visualization.

This is where ChartExpo swoops in to rescue us from the limitations of Excel. It guides us to the promised land of stunning, insightful data visuals, making DSO analysis a breeze.

So, buckle up let’s embark on a quest to conquer DSO with the power of visualization.

Let’s learn how to Install ChartExpo in Excel.

  1. Open your Excel application.
  2. Open the worksheet and click the “Insert” menu.
  3. You’ll see the “My Apps” option.
  4. In the Office Add-ins window, click “Store” and search for ChartExpo on my Apps Store.
  5. Click the “Add” button to install ChartExpo in your Excel.

ChartExpo charts are available both in Google Sheets and Microsoft Excel. Please use the following CTA’s to install the tool of your choice and create beautiful visualizations in a few clicks in your favorite tool.

Example

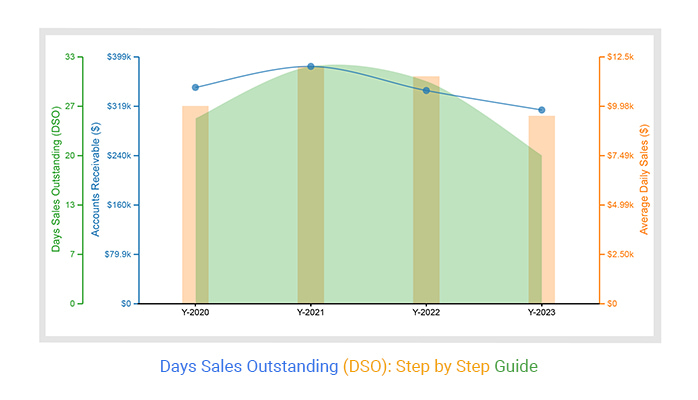
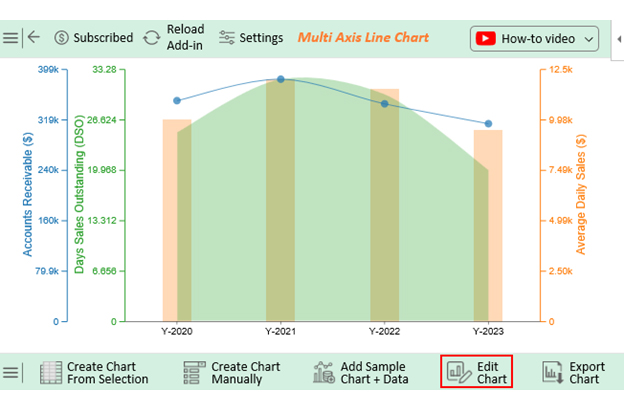
Let’s say you want to analyze the DSO sample data below.

Year Days Sales Outstanding (DSO) Average Daily Sales ($) Accounts Receivable ($)
Y-2020 25 10000 350000
Y-2021 32 12000 384000
Y-2022 30 11500 345000
Y-2023 20 9500 313500

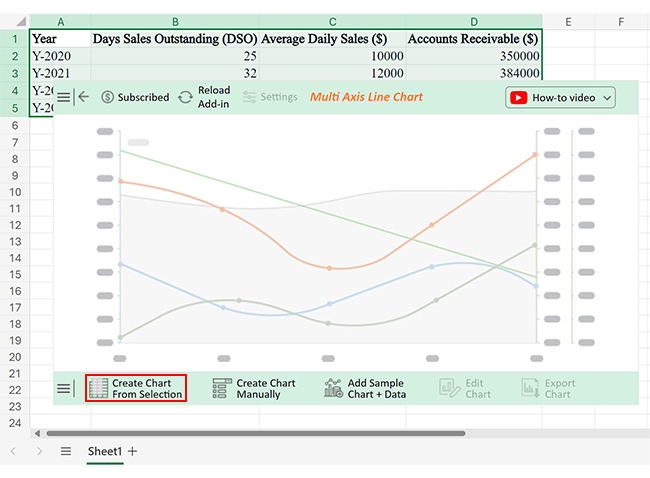
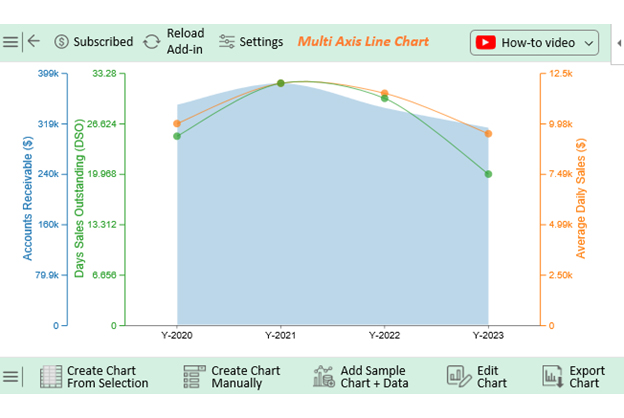
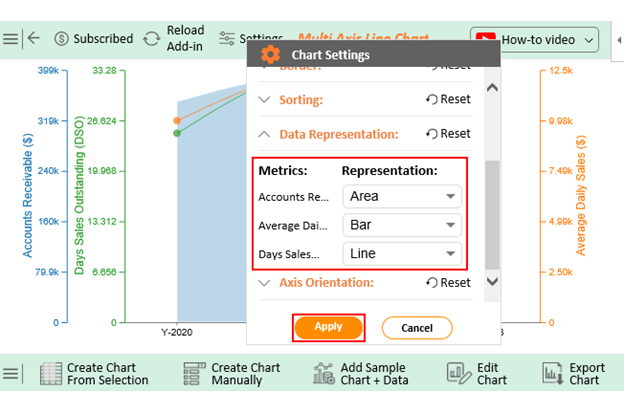
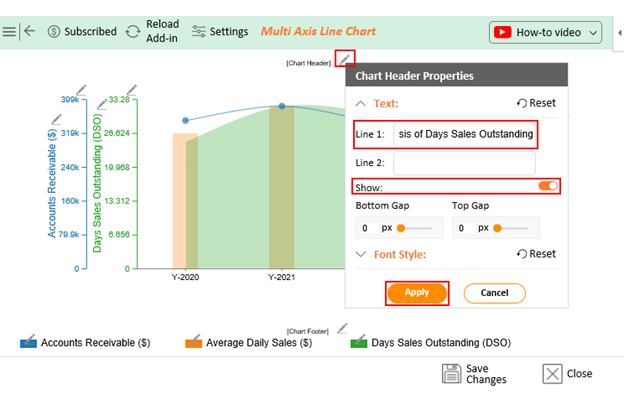
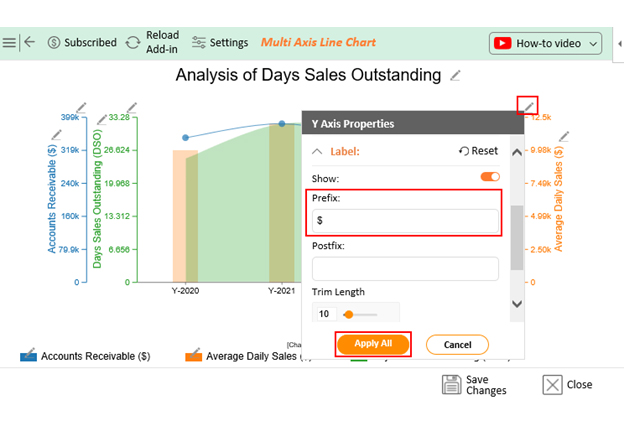
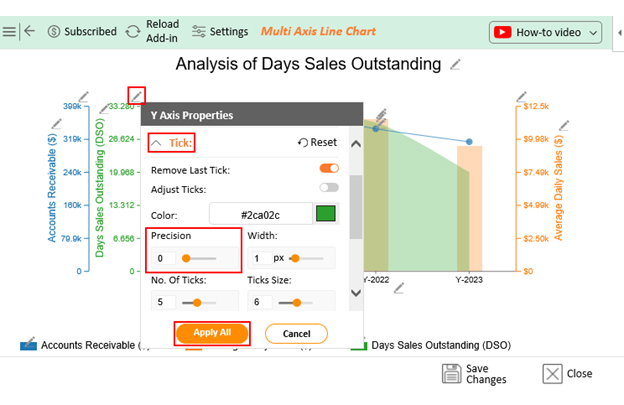
Follow these steps to visualize this data in Excel using ChartExpo and glean valuable insights.

  • To get started with ChartExpo, install ChartExpo in Excel.
  • Now Click on My Apps from the INSERT menu.
insert chartexpo in excel
  • Choose ChartExpo from My Apps, then click Insert.
open chartexpo in excel
  • Once it loads, scroll through the charts list to locate and choose the “Multi-Axis Line Chart”.
search multi axis line chart in excel
  • Click the “Create Chart From Selection” button after selecting the data from the sheet, as shown.
Create Chart From Selection ce530
  • ChartExpo will generate the visualization below for you.
days sales outstanding design template
  • Click on Settings and change the “Data Representation” as follows.
Data Representation ce532
  • If you want to add anything to the chart, click the Edit Chart button:
Edit Chart ce532
  • Click the pencil icon next to the Chart Header to change the title.
  • It will open the properties dialog. Under the Text section, you can add a heading in Line 1 and enable Show.
  • Give the appropriate title of your chart and click the Apply button.
Apply Tittle on Chart ce532
  • Change the precision value of Average Daily Sales to zero and add the dollar sign:
Change precision value Average Daily Sales
  • Change the precision value of Days Sales Outstanding to zero:
Change precision value Days Sales Outstanding
  • Change the precision value of Account Receivable to zero and add the dollar sign:
Change precision value Account Receivable
  • Change the Legend shape of Account Receivable into Line and Circle and click the “Apply” button.
Change Legend shape of Account Receivable
  • Click the “Save Changes” button to persist the changes made to the chart.
Save Changes ce532
  • Your final Multi Axis Line Chart will look like the one below.
final calculate days sales outstanding

Insights

  • Over the years, there have been fluctuations in days sales outstanding (DSO), reflecting shifts in efficiency in managing receivables.
  • In 2020, the DSO stood at 25 days, with $350,000 in accounts receivable.
  • By 2023, the DSO decreased to 20 days, indicating a more rapid collection of receivables.
  • Average daily sales fluctuated between $9,500 and $12,000, highlighting variations in sales performance.
  • Collectively, there is a discernible trend toward enhanced efficiency in managing receivables.

FAQs

What is days sales outstanding (DSO)?

Days sales outstanding (DSO) measures the average days a company takes to collect payments after a sale. It gauges receivables management efficiency, indicating how quickly a business converts sales into cash. A lower DSO is favorable for cash flow.

What does DSO tell you? Is high DSO good or bad?

DSO provides insights into how efficiently a company collects payments after a sale. A high DSO suggests a longer cash conversion cycle, potentially indicating cash flow challenges. Generally, a lower DSO is considered good, reflecting prompt cash collection and effective receivables management.

What is the average DSO by industry?

The average day’s sales outstanding (DSO) varies by industry. Industries with longer payment cycles, like manufacturing, may have higher DSO. Service-oriented industries often aim for lower DSO. Benchmarks can range from 30 to 60 days, but industry specifics influence averages.

Wrap Up

Calculating days sales outstanding (DSO) is more than a mathematical exercise it’s a strategic tool for financial management. You break down the process into identifying accounts receivable, determining net credit sales, and applying the formula. This provides a tangible metric for assessing how efficiently your company collects payments after a sale.

Choosing a period and interpreting the resulting DSO is akin to deciphering a financial heartbeat. A lower DSO signifies agile receivables management, translating into faster cash collection and bolstering liquidity.

The example above illustrates a practical application, emphasizing DSO as a tangible metric with real-world implications. Its importance extends beyond mathematics it’s a compass guiding financial decisions.

Regular recalibration and monitoring of DSO offers a dynamic pulse on your business’s financial health. It is a proactive indicator, informing decisions on credit terms, collection strategies, and overall cash flow management.

Conclusively, DSO emerges as a key player in the landscape of financial metrics. It connects sales to cash and charts a course for sustained success in the ever-evolving business environment.

Therefore, learning to calculate days sales outstanding (DSO) is more than just a skill. It’s a strategic advantage in the ever-evolving dance of financial dynamics.

Embrace the DSO metric with ChartExpo today to navigate the complex waters of financial management smoothly.

How much did you enjoy this article?

ExcelAd2
Start Free Trial!
133977

Related articles

next previous
Microsoft Excel8 min read

Excel Task Tracker Template for Smarter Task Insights

Task tracker template in Excel organizes tasks, tracks deadlines, and boosts efficiency. Learn its benefits, and explore expert tips to simplify task management.

Microsoft Excel10 min read

Invoice Tracker Template in Excel for Better Insights

An invoice tracker Excel template helps track invoices, due dates, and payments. Learn how to use this template for better financial management.

Microsoft Excel12 min read

Key Performance Indicators in Healthcare for Better Insights

Key Performance Indicators in healthcare track patient care and efficiency. Learn about these KPIs, top examples, and how to use them to improve outcomes.

Microsoft Excel10 min read

BMI Calculation Formula in Excel for Better Fitness Insights

The BMI calculation formula in Excel helps track and analyze body mass index. Explore step-by-step instructions and tips to simplify BMI tracking in Excel.

Microsoft Excel29 min read

How to Create a Tornado Chart in Excel? A Complete Guide

Click to learn how to plot a Tornado Chart in Excel using easy-to-follow steps. Also, we’ll address the following question: what is a Tornado Diagram?

ChartExpo logo

Turn Data into Visual
Stories

CHARTEXPO

  • Home
  • Gallery
  • Videos
  • Services
  • Pricing
  • Contact us
  • FAQs
  • Privacy policy
  • Terms of Service
  • Sitemap

TOOLS

  • ChartExpo for Google Sheets
  • ChartExpo for Microsoft Excel
  • Power BI Custom Visuals by ChartExpo
  • Word Cloud

CATEGORIES

  • Bar Charts
  • Circle Graphs
  • Column Charts
  • Combo Charts
  • Comparison Charts
  • Line Graphs
  • PPC Charts
  • Sentiment Analysis Charts
  • Survey Charts

TOP CHARTS

  • Sankey Diagram
  • Likert Scale Chart
  • Comparison Bar Chart
  • Pareto Chart
  • Funnel Chart
  • Gauge Chart
  • Radar Chart
  • Radial Bar Chart
  • Sunburst Chart
  • see more
  • Scatter Plot Chart
  • CSAT Survey Bar Chart
  • CSAT Survey Chart
  • Dot Plot Chart
  • Double Bar Graph
  • Matrix Chart
  • Multi Axis Line Chart
  • Overlapping Bar Chart
  • Control Chart
  • Slope Chart
  • Clustered Bar Chart
  • Clustered Column Chart
  • Box and Whisker Plot
  • Tornado Chart
  • Waterfall Chart
  • Word Cloud
  • see less

RESOURCES

  • Blog
  • Resources
  • YouTube
SIGN UP FOR UPDATES

We wouldn't dream of spamming you or selling your info.

© 2025 ChartExpo, all rights reserved.