• Home
  • Tools dropdown img
    • Spreadsheet Charts

      • ChartExpo for Google Sheets
      • ChartExpo for Microsoft Excel
    • Power BI Charts

      • Power BI Custom Visuals by ChartExpo
    • Word Cloud

  • Charts dropdown img
    • Chart Category

      • Bar Charts
      • Circle Graphs
      • Column Charts
      • Combo Charts
      • Comparison Charts
      • Line Graphs
      • PPC Charts
      • Sentiment Analysis Charts
      • Survey Charts
    • Chart Type

      • Box and Whisker Plot
      • Clustered Bar Chart
      • Clustered Column Chart
      • Comparison Bar Chart
      • Control Chart
      • CSAT Survey Bar Chart
      • CSAT Survey Chart
      • Dot Plot Chart
      • Double Bar Graph
      • Funnel Chart
      • Gauge Chart
      • Likert Scale Chart
      • Matrix Chart
      • Multi Axis Line Chart
      • Overlapping Bar Chart
      • Pareto Chart
      • Radar Chart
      • Radial Bar Chart
      • Sankey Diagram
      • Scatter Plot Chart
      • Slope Chart
      • Sunburst Chart
      • Tornado Chart
      • Waterfall Chart
      • Word Cloud
    • Google Sheets
      Microsoft Excel
  • Services
  • Pricing
  • Contact us
  • Blog
  • Support dropdown img
      • Gallery
      • Videos
      • Contact us
      • FAQs
      • Resources
    • Please feel free to contact us

      atsupport@chartexpo.com

Categories
All Data Visualizations Data Analytics Surveys
Add-ons/
  • Google Sheets
  • Microsoft Excel
  • Power BI
All Data Visualizations Data Analytics Surveys
Add-ons
  • Google Sheets
  • Microsoft Excel
  • Power BI

We use cookies

This website uses cookies to provide better user experience and user's session management.
By continuing visiting this website you consent the use of these cookies.

Ok

ChartExpo Survey


Home > Blog > Power BI

Business Intelligence Consulting Firm for Unlocking Insights

In today’s data-centric world, businesses are faced with an unparalleled abundance of information.

However, the real potential of this data resides in its capacity to be transformed into actionable insights. This is precisely where business intelligence (BI) comes into play.

Business Intelligence Consulting Firm

Business intelligence consulting firms are the architects of informed decision-making. They comprise professionals who establish new software systems and improve existing ones for more efficient information management.

They assist businesses in gathering, analyzing, and presenting the necessary data for informed and strategic business decisions.

Their expertise lies at the intersection of technology and business management. They work diligently to boost profitability, increase operational efficiency, and reduce costs.

BI consulting ensures that data becomes a valuable asset, not just a collection of numbers and figures.

Table of Contents:

  1. What is a Business Intelligence Consulting Firm?
  2. Why is Business Intelligence Important for Businesses Today?
  3. A Step-by-Step Guide on Crafting an Effective Dashboard
  4. Benefits of Working with a Business Intelligence Consulting Firm
  5. Wrap Up

What is a Business Intelligence Consulting Firm?

Definition: A business intelligence consulting firm focuses on helping businesses leverage data for decision-making and improve performance.

These firms provide a spectrum of services, including:

  • Data collection
  • Data analysis
  • Data visualization

A business intelligence consulting firm guides businesses into embracing and learning new data-organization methodologies.

These companies establish diverse frameworks and procedures to enhance data management and processing. This enables businesses to extract valuable insights from their data assets.

Why is Business Intelligence Important for Businesses Today?

Businesses need to be able to interpret their data and derive insights from it. This necessitates the use of business intelligence.

Here are the reasons why business intelligence is important for businesses today:

Informed Decision Making

BI gives businesses the tools and insights they need to make data-driven choices. This results in more informed and strategic decisions that can lead to improved performance and competitive advantage.

Better Visibility

Hiring business intelligence consulting services may result in better visibility into numerous business functions.

This can help you better optimize your business processes. You can also choose more effective KPI monitoring techniques. Additionally, this can also help you identify business opportunities for growth.

Competitive Advantage

By analyzing business data, BI enables organizations to identify market trends, opportunities, and threats. This gives them a competitive advantage.

Forecasting

BI tools provide predictive analytics that help businesses forecast future trends and market shifts. This aids them in planning and strategizing effectively.

Employee Productivity

BI tools make data more accessible to employees across the organization. This reduces the time and effort required to gather and analyze information. This, in turn, boosts productivity and enables employees to focus on higher-value tasks.

Data Integration

BI tools can consolidate data from various data sources, including internal and external data. This helps create a comprehensive view of an organization’s operations. This integrated data can provide a holistic perspective on business performance.

Cost Reduction

BI can contribute to cost reduction and improved financial performance. This is because it’s an effective tool for identifying inefficiencies and cost-saving opportunities through data analysis.

A Step-by-Step Guide on Crafting an Effective Dashboard

We shall break down the process into five stages.

Stage 1: Logging in to Power BI

  • Log in to Power BI.
  • Enter your email. Click the “Submit” button.
Enter email to login to Power BI
  • You are redirected to your Microsoft account.
  • Enter your password and click “Sign in“.
Enter Password to login to Power BI
  • You can choose whether to stay signed in.
Click on stay signed in
  • Once done, the Power BI home screen will open.

Stage 2: Creating a Data Set and Selecting the Data Set to Use in Your Sankey Chart

  • Go to the left-side menu and click the “Create” button.
  • Select “Paste or manually enter data“.
select Paste or manually enter data in Power BI ce458
  • We’ll use the following cash flow data for this example.
Total Cost Company Type Company Name Expertise Categories Expertise Cost
Total Cost Subcontractor Skyline Contractors Mechanical Installation Plumbing & Heating 15456
Total Cost Subcontractor Skyline Contractors Mechanical Installation Mechanical Work 10159
Total Cost Subcontractor Onyx General Contractors Mechanical Installation Plumbing & Heating 18045
Total Cost Subcontractor Onyx General Contractors Mechanical Installation Mechanical Work 12695
Total Cost Subcontractor Living Well Remodeling Mechanical Installation Plumbing & Heating 14589
Total Cost Subcontractor Living Well Remodeling Mechanical Installation Welding 11456
Total Cost Supplier Power-up Builders Raw Material Cement 20561
Total Cost Supplier Power-up Builders Raw Material Steel 32456
Total Cost Supplier Five-star Construction Raw Material Bricks 10253
Total Cost Supplier Five-star Construction Raw Material Timber 9000
  • Paste the above data table in the Power Query Window.
  • Select the “Create a dataset only” option.
Create Dataset in Power BI ce465
  • On the left-side menu, click “Data Hub“.
  • Power BI populates the data set list. (If you have not created a data set, refer to the Error! Reference source not found section).
Click on Data Hub ce477
  • Choose a data set for the Sankey chart.
  • PBI populates the screen as shown below:
Workspace in Power BI ce465
  • Click on the “Create a report” dropdown.
  • Select “Start from scratch“.
click on to get more visuals ce482
  • A Report Canvas screen appears as below:
Report Canvas screen in Power BI ce465

Stage 3: Adding the Power BI Sankey Diagram Extension by ChartExpo

  • Creating the Sankey Diagram requires us to use an add-in or Power BI visual from AppSource.
  • Navigate to the right side of the Power BI dashboard.
  • Open the Power BI Visualizations panel.
  • Click the ellipsis symbol (…) as highlighted in the diagram below. This will import the Power BI Sankey Diagram extension by ChartExpo.
click on to get more visuals ce465
  • The following menu opens:
  • Select the “Get more visuals” option.
get more visuals in Power BI ce465
  • The following window opens.
  • Enter “Sankey Diagram for Power BI by ChartExpo” in the highlighted search box.
  • You should see the “Sankey Diagram for Power BI by ChartExpo”, as shown in the image below…
Sankey Diagram for Power BI by ChartExpo
  • Click the highlighted “Add” button.
Click the Add button
  • Power BI will add the “Sankey Diagram for Power BI by ChartExpo” in the visualization panel.
Click on Sankey Diagram Icon

Stage 4: Drawing a Sankey Diagram with ChartExpo’s Power BI extension

  • Select the “Sankey Diagram for Power BI by ChartExpo” icon in the visualization panel.
  • The following window opens in the report section of your dashboard:
Report Section in Dashboard ce465
  • You can resize the visual as needed.
  • Navigate to the right side of your Power BI dashboard.
  • You should see “Fields” next to “Visualizations“.
Fields next to visualizations ce465
  • You’ll select the fields to use in your Sankey chart here.
  • The ChartExpo visual needs to be selected, though. Select the field in the following sequence:
    • Total Cost
    • Company Type
    • Company Name
    • Expertise Categories
    • Expertise
    • Cost
Select fields for Sankey diagram ce465
  • You’ll be asked for a ChartExpo license key or email address.
enter email for ChartExpo license ce430

Stage 5: Activate your ChartExpo Trial or Apply a Subscription Key

  • Select the ChartExpo visual.
  • You should see three icons below “Build Visual” in the Visualizations panel.
Build visual panel in Power BI
  • Select the middle icon, “Format visual“.
  • The visual properties will be populated as shown below.
visual properties in Power BI
  • If you are a new user,
    • Type in your email under the section titled “Trial Mode”.
    • This should be the email address that you used to subscribe to the ChartExpo add-in. It is where your ChartExpo license key will be sent.
    • Ensure that your email address is valid.
    • Click “Enable Trial.” You’ll get a 7-day trial.
enter email id
  • You should receive a welcome email from ChartExpo.
  • If you do not find the email in your inbox, kindly check your spam folder.
  • The Sankey Diagram you create under the 7-day trial contains the ChartExpo watermark.
Data Gateway in Power BI 1
  • If you have obtained a license key:
    • Enter your license key in the “ChartExpo License Key” textbox in the “License Settings” section (see below).
    • Slide the toggle switch next to “Enable License” to “On“.
enter license key
  • Your Sankey Diagram will then appear without a watermark.
Data Gateway in Power BI 2
  • Let’s add the Prefix (e.g., $ sign) to the chart’s numeric values.
  • Expand the “Stats” properties. Add the Prefix value (e.g., $ sign).
Add Prefix Value ce465
  • Let’s add colors to each node. Expand the “Level Colors” properties and select the colors.
Coloring Sankey Diagram ce465
  • Automatically, all changes will be saved.
Final-Data Gateway in Power BI

Insights

  • The procurement cost at Level 1 amounts to $155K.
  • At Level 2, of the total cost of $155K, $72.3K (46.7%) was allocated to the supplier, while $82.4K (53.3%) was spent on subcontractors.
  • Moving to Level 3, the $72.3K supplier cost was divided between two companies: Power-up Builder and Five-star Construction, charging $53.0K and $19.3K, respectively.
  • The subcontractor cost of $82.4K was distributed among three companies: Skyline Contractors, Onyx General Contractors, and Living Well Remodeling. They charged $25.6K, $30.7K, and $26.0K, respectively, for their services.
  • At Level 4, the supplier companies provided raw materials for procurement, totaling $72.3K. The companies specializing in Mechanical Installations accounted for approximately $82.4K.
  • Among the $72.3K raw material cost, cement, steel, bricks, and timber accounted for $20.6K, $32.5K, $10.3K, and $9K, respectively.

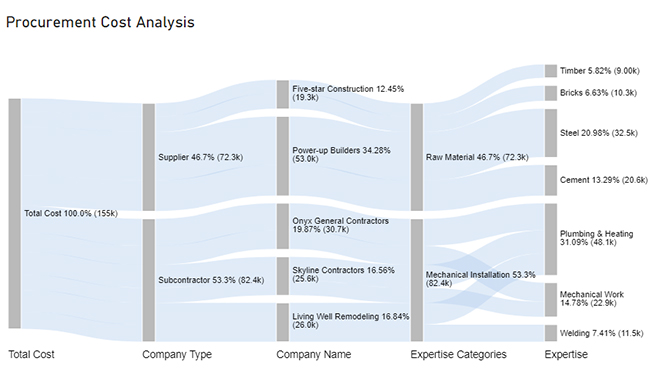
From the $82.4K mechanical installation cost, Plumbing Heating, Mechanical Work, and Welding accounted for $48.1K, $22.9K, and $11.5K, respectively.

What are the Benefits of Working with a Business Intelligence Consulting Firm?

BI consulting firms empower businesses by transforming their data into meaningful information. Here are the benefits of working with a BI consulting firm:

Expertise and Experience

BI consultants are well-versed in data analysis, data reporting, and data management. They help you choose tools and technologies that align with your business needs. This helps your business make the most of its data.

Identification of Key Performance Indicators (KPIs)

A BI consulting firm helps you identify KPIs more easily. The firm helps you select the right software and tools to identify KPIs.

Accelerated Implementation

BI consultants can speed up the implementation of BI systems. This saves you time and enables you to get your data analytics initiatives up and running faster.

Data Quality Improvement

BI consulting firms can assist you in improving the quality and accuracy of your data. Decision-makers can trust the information they are using. This reduces the likelihood of making incorrect or misguided choices.

Improved Profitability

A BI firm delivers expertise and experience that play a key role in increasing a company’s profitability. They help streamline KPIs and data processes that could impact a business’s revenue and profitability.

Compliance and Security

BI consulting firms help ensure that your data handling and reporting meet industry regulations. They also ensure the security of your data.

Increased Customer Satisfaction

A BI firm can be quite useful in tracking consumer behavior and purchasing trends. This provides you with insights into your customers’ needs and preferences. You can therefore make the necessary changes to improve consumer satisfaction.

FAQs

What is the Role of a Business Intelligence Consultant?

A BI consultant plays a major role in refining data to optimize business processes.

Here are some key roles that a BI consultant plays:

  • Analyzing data
  • Creating data models
  • Creating reports and dashboards
  • Selecting appropriate BI tools
  • Integrating data
  • Implementing data governance
  • Providing user training
  • Formulating strategic plans
  • Addressing issues and offering support
  • Enhancing BI performance

A BI consultant bridges the gap between raw data and actionable insights. They help businesses leverage data to enhance their decision-making processes and achieve their business objectives.

What does a Business Intelligence Firm Do?

BI firms consist of teams of BI professionals responsible for transforming business data into meaningful insights.

BI firms can help businesses implement and use BI software. BI software helps businesses automate many of the tasks involved in data collection, analysis, and reporting.

These BI consulting services comprise:

  • Data warehousing
  • Data cleaning and preparation
  • Data analysis and visualization
  • Business strategy alignment
  • Consulting and advisory services

Wrap-Up

In a rapidly evolving and data-rich landscape, BI consulting is the compass that guides businesses toward sustainable goals.

Business intelligence consulting firms provide a vital service that helps with informed decision-making.

Selecting the optimal BI provider elevates your business and enables you to achieve your intended outcomes.

They assist businesses in making well-considered decisions across different domains.

A business intelligence consulting firm facilitates a comprehensive analysis of decision options, allowing businesses to weigh the pros and cons effectively.

At its core, a business intelligence consulting firm is about ensuring organizations access high-quality data for informed decisions.

By taking advantage of our services, you’re investing in your business’s future. Contact us for a business intelligence consulting firm today and embark on a journey of growth and success.

How much did you enjoy this article?

PBIAd1
Start Free Trial!
131704

Related articles

next previous
Power BI12 min read

How to Create Sankey Diagram in Microsoft Power BI?

Learn How to Create Sankey Diagram in Microsoft Power BI using Desktop & Web Service. What they are and how to use them effectively.

Power BI8 min read

Power BI Artificial Intelligence: Insights Using Visuals

Discover all there is to know about the Power BI artificial intelligence. You'll also discover how AI is used in Power BI, and how to use it for analysis and more.

Power BI9 min read

Budgeting in Healthcare: Use Visuals to Spot Budget Gaps

This guide helps you discover what budgeting in healthcare is. You'll also discover the factors that affect hospital budgets and types of budgeting in healthcare.

Power BI9 min read

Predictive Analytics in Power BI for Making Insightful Visuals

This guide shows you everything you need to know about Predictive Analytics in Power BI. It also shows you how it works, and how to interpret the results.

Power BI8 min read

Quarterly Business Review Template for Optimum Reports

Discover what the quarterly business review template is. This guide also shows you the best practices to consider when using the QBR template.

ChartExpo logo

Turn Data into Visual
Stories

CHARTEXPO

  • Home
  • Gallery
  • Videos
  • Services
  • Pricing
  • Contact us
  • FAQs
  • Privacy policy
  • Terms of Service
  • Sitemap

TOOLS

  • ChartExpo for Google Sheets
  • ChartExpo for Microsoft Excel
  • Power BI Custom Visuals by ChartExpo
  • Word Cloud

CATEGORIES

  • Bar Charts
  • Circle Graphs
  • Column Charts
  • Combo Charts
  • Comparison Charts
  • Line Graphs
  • PPC Charts
  • Sentiment Analysis Charts
  • Survey Charts

TOP CHARTS

  • Sankey Diagram
  • Likert Scale Chart
  • Comparison Bar Chart
  • Pareto Chart
  • Funnel Chart
  • Gauge Chart
  • Radar Chart
  • Radial Bar Chart
  • Sunburst Chart
  • see more
  • Scatter Plot Chart
  • CSAT Survey Bar Chart
  • CSAT Survey Chart
  • Dot Plot Chart
  • Double Bar Graph
  • Matrix Chart
  • Multi Axis Line Chart
  • Overlapping Bar Chart
  • Control Chart
  • Slope Chart
  • Clustered Bar Chart
  • Clustered Column Chart
  • Box and Whisker Plot
  • Tornado Chart
  • Waterfall Chart
  • Word Cloud
  • see less

RESOURCES

  • Blog
  • Resources
  • YouTube
SIGN UP FOR UPDATES

We wouldn't dream of spamming you or selling your info.

© 2025 ChartExpo, all rights reserved.