Categories
People don’t buy what they don’t notice. Awareness sits upstream from every click, call, and demo request. Yet most dashboards obsess over leads and ignore whether the name is even sticking.
That’s where awareness signals earn their keep. They show if the market can find the brand, recognize it, and talk about it without being prompted. When those signals climb, demand gets cheaper.
When they stall, the funnel turns into a treadmill. B2B or B2C, same rule. A logo isn’t awareness. A repeatable mental shortcut is. Skip vanity counts and focus on what changes behavior. Track it early, before budgets get burned on invisible work.
Definition: Brand Awareness Metrics show whether people recognize the brand and connect it to the category. They sit above conversion because they measure attention and memory, not purchase intent.
Signals come from search, traffic, social chatter, media mentions, and surveys. One question gets answered: Does the market notice the brand?
Measuring brand awareness isn’t one magic score. Watch reach, frequency, and sentiment, then compare change over time. Awareness can move before revenue does, so it works as an early warning sign.
Brand Awareness Metrics explain why a campaign can feel loud and still underperform. Leads show who acted. Awareness shows who noticed. Track it to diagnose the message, channel, and timing before money keeps leaking.
Tie awareness lift to spend and compare it to financial metrics. Cheap attention beats expensive noise.
When awareness rises, and performance metrics rise, the channel is pulling its weight.
Use awareness trends to support business metrics like pipeline quality and win rate.
Compare visibility to peers to see who owns the conversation.
Familiarity reduces friction, and customer success metrics often improve as trust grows.
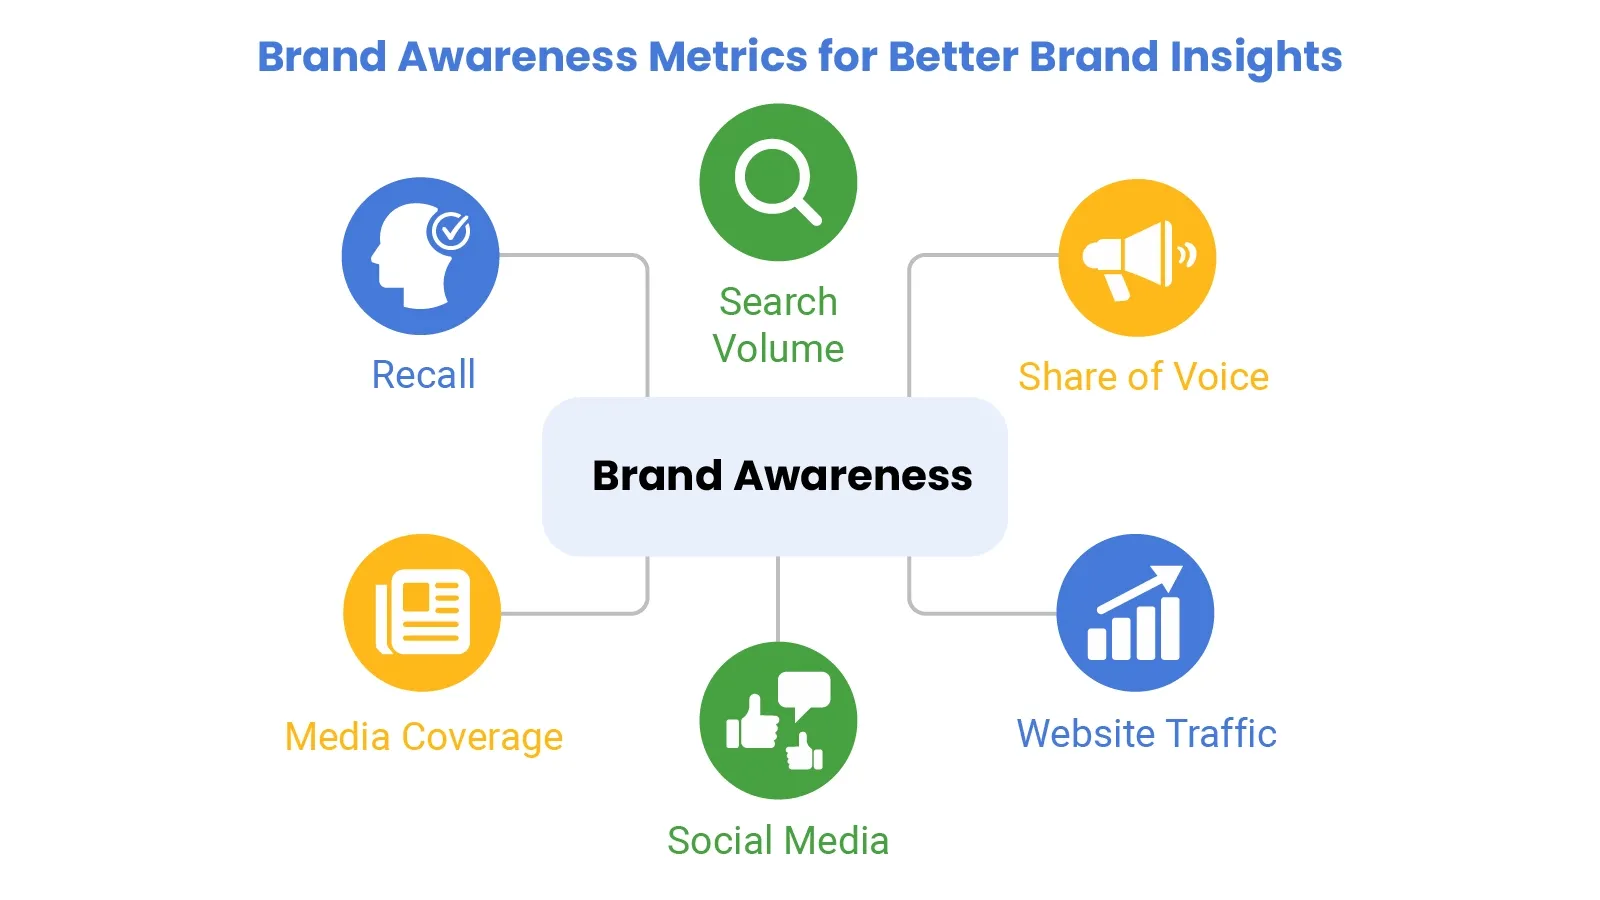
Picking the right brand awareness KPIs helps ensure honest reporting. Brand awareness metrics should reflect recognition, recall, and conversation, not just exposure.
Counts intentional searches for the brand name. Growth means the brand is top of mind.
Shows how much category talk includes the brand. Rising share often tracks brand awareness metrics.
Brand-driven direct and organic sessions show active interest and repeat visits.
Comments, saves, and shares show the message landed. Likes alone are cheap.
Unpaid coverage adds credibility. More quality mentions often lift brand awareness metrics.
Surveys test memory directly, with and without prompts.
High NPS creates word of mouth, which expands awareness without extra budget.
Volume plus tone shows whether attention helps or hurts.
Quality links boost discovery and authority.
Tracks what ideas people attach to the brand and whether positioning is sticking.
Use impressions to confirm distribution, not to claim impact.
Unique exposure count. Pair with frequency to avoid false comfort.
Growth rate shows whether the audience is expanding beyond current fans.
Direct visits signal familiarity. Rising direct traffic often means brand awareness metrics are improving.
Organic hashtag use shows people spreading brand language on their own.
Brand Awareness Metrics pull from multiple sources. Align time windows across search, web, social, surveys, and monitoring. Measuring brand awareness works when the sources agree on direction.
Google Sheets can track brand awareness KPIs when inputs stay tidy. Brand Awareness Metrics read better when trends and segments live in one view.
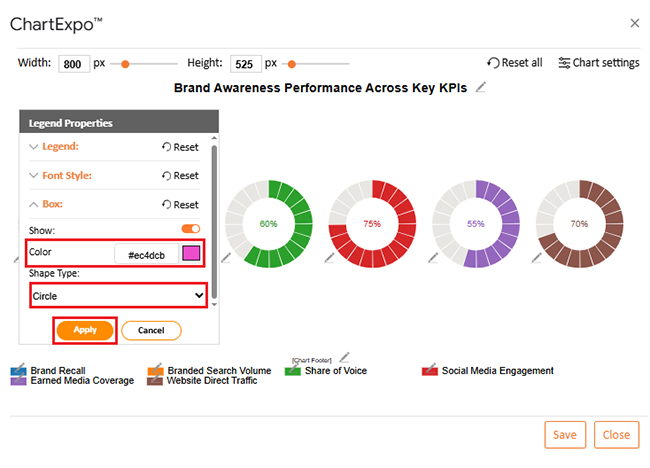
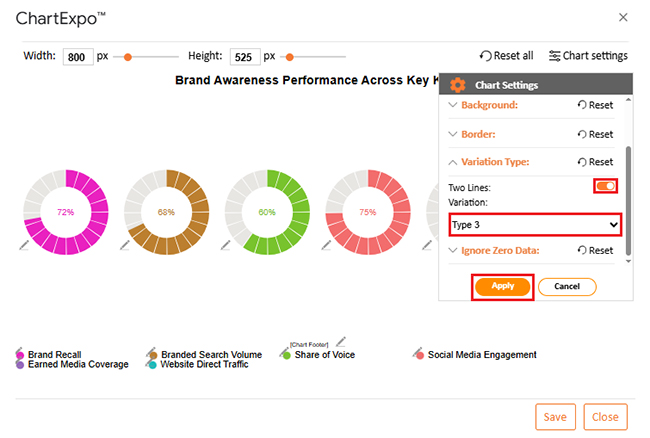
ChartExpo adds quick charting inside Google Sheets and saves time on setup and styling.
Why use ChartExpo?
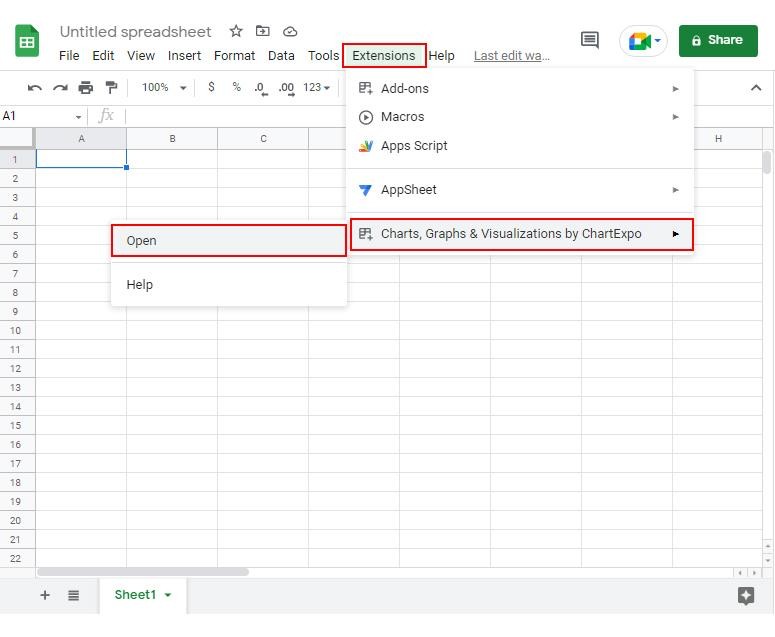
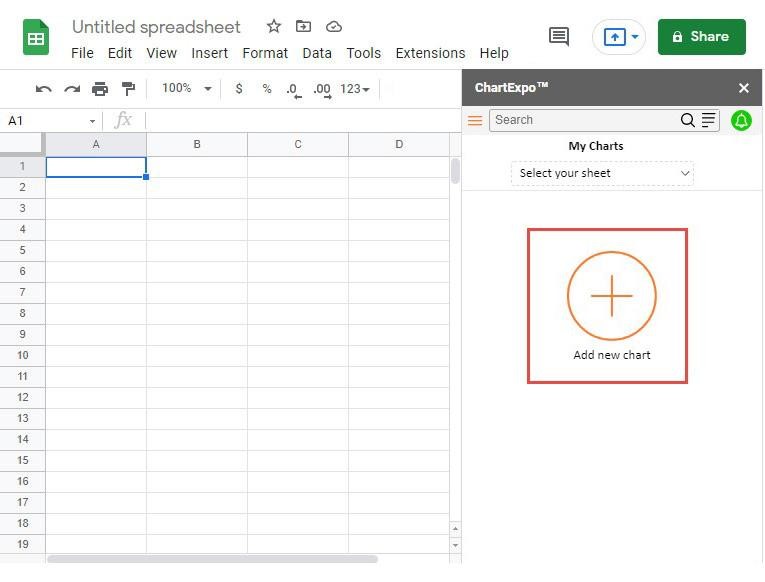
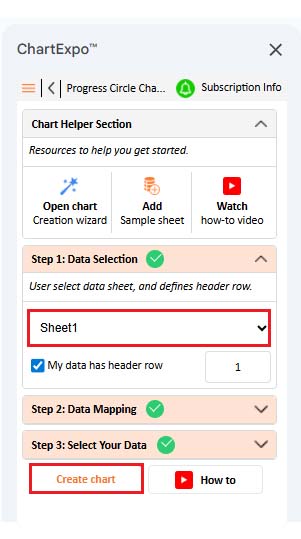
How to install ChartExpo in Google Sheets?
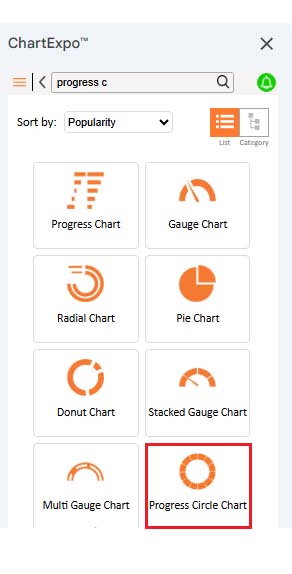
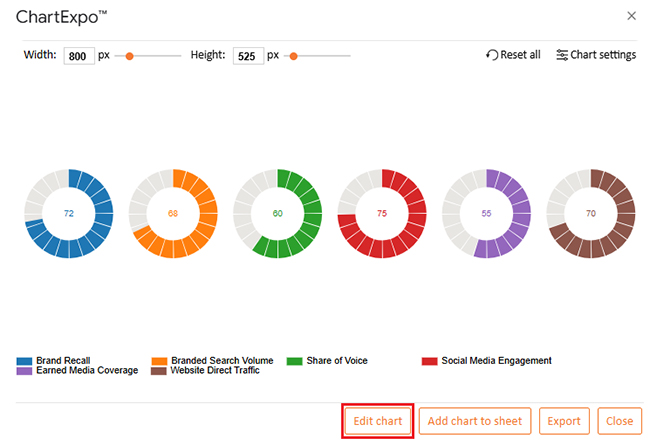
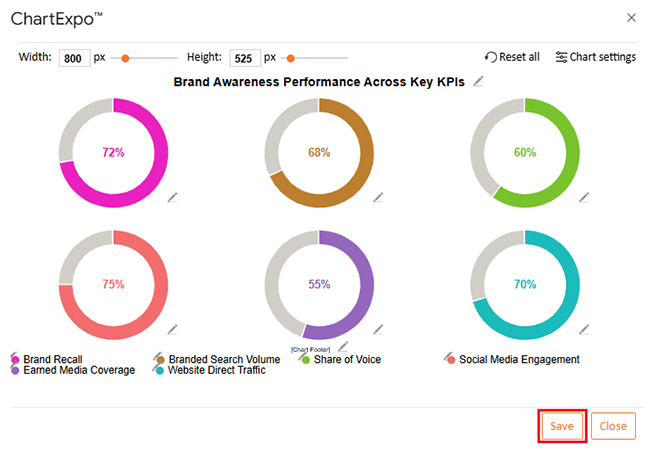
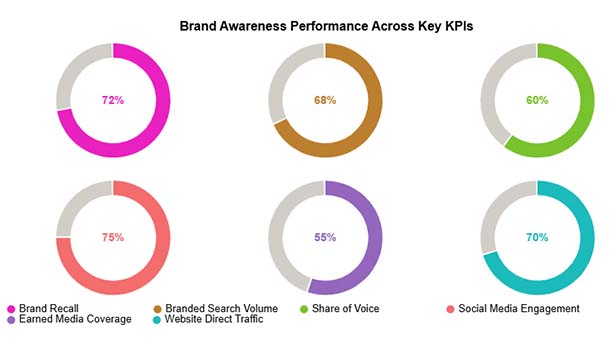
The table below shows sample scores for a Progress Circle Chart.
|
Brand Awareness KPI |
Awareness Score (%) |
| Brand Recall | 72 |
| Branded Search Volume | 68 |
| Share of Voice | 60 |
| Social Media Engagement | 75 |
| Earned Media Coverage | 55 |
| Website Direct Traffic | 70 |
Brand Awareness Metrics keep teams honest about market pull and trust.
Pick metrics that match the goal. Ignore the rest.
Early on, watch reach, impressions, branded search volume, social mentions, and recall surveys. Those signals show visibility and memory before the conversion data has a chance to mature.
The best set depends on the goal, but a solid mix includes share of voice, direct traffic, brand mentions with sentiment, survey recall, and earned media coverage. Together, they cover attention, interest, and perception.
Monthly reviews catch drift without overreacting to daily noise. Quarterly reviews help confirm direction and link awareness changes to broader outcomes and budgets.
Brand Awareness Metrics don’t exist to decorate a report. They tell whether the market can find the brand, name it, and trust it.
Track visibility signals like search and share of voice, then balance them with perception signals like recall surveys and sentiment.
Watch movement over time, not one-week spikes. When Brand Awareness Metrics rise, demand work gets cheaper, and sales conversations start to warm up.
When they fall, stop pushing more budget into the same channel and fix the message. No drama. Just steady, repeatable progress. Keep the system simple, review it on a steady cadence, and act on what the numbers say.
How much did you enjoy this article?


Calculate accounts receivable turnover ratio to measure credit collection speed, improve cash flow, and strengthen your financial strategy. Read on!

Change Management KPIs are the key to tracking adoption, performance, and ROI during transitions. Find out which metrics matter. Read on!

Data collection methods and techniques determine the quality of every insight you act on. Explore key approaches for gathering reliable data. Read on!


