Categories
Analytics in the banking industry—what does it mean? Banks are no longer buildings with tellers and vaults. They’re data engines. Every transaction, login, and swipe tells a story. The question is: Are banks listening?


Analytics in the banking industry now means more than reports and charts. It’s about turning raw numbers into real-time decisions. From approving loans faster to predicting credit defaults before they happen. Consider how CRM analytics can track customers’ journeys from their first inquiry to their final loan payment. Personalized service isn’t a luxury anymore—it’s expected.
Then there’s Business analytics—the fuel behind a more innovative strategy. Should a bank expand into a new region? Which service is draining resources? The answers come from data. Fast. Clean. Actionable. That’s the new standard.
Consumers expect their banks to be brighter than ever. Meanwhile, regulations grow tighter, and efficiency is no longer optional. Banks must analyze, predict, and act every day. This is where analytics in the banking industry rises to the top. It helps banks forecast credit losses, map fund flows, and precisely compare gross profit vs. net income. It’s not fluff. Its function. And it’s already reshaping finance.
So what exactly is banking analytics, and why does it matter now more than ever?
Let’s find out.
Definition: Banking analytics means using data to make better decisions in banks. It helps track patterns, spot risks, and improve services. Tools like digital analytics and self-service analytics make this possible. Banks can study past trends and real-time activity. This helps them act faster and smarter. They can cut fraud, improve loans, and serve customers better.
Banking analytics gives clear answers from complex data. It turns raw numbers into valuable insights. Every move becomes sharper—every choice, more informed.
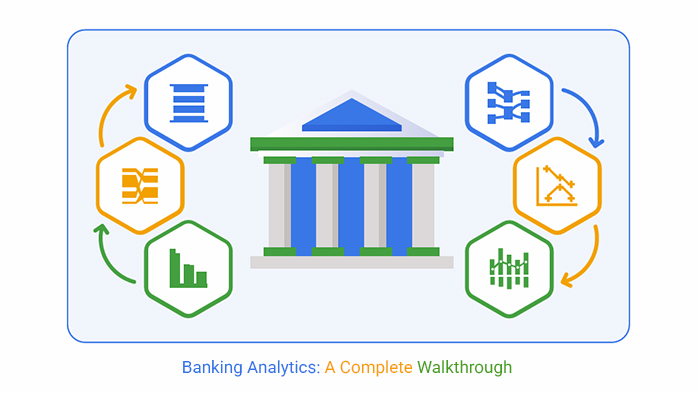
Here are the top charts you can use to visualize and glean insights from your banking analytics. These charts were created using ChartExpo for Excel.
Banks sit on mountains of data. Something new is added every second—a payment, a login, a request. But raw data means nothing without action. That’s where data analytics steps in. It brings clarity, driving smart moves. And in banking, speed and accuracy are everything.
Data tells a story—but only if you know how to read it. In banking, different types of analytics give different answers. Some explain what happened. Others show what’s next. Together, they power smarter, faster decisions:
Data is no longer just a backup for banking decisions—it’s now at the center. Banks can predict, respond, and optimize in real time with the right analytics. From fighting fraud to improving service, analytics touches every corner of operations.
How?
Spreadsheets are great—until they aren’t. Sure, Excel handles numbers well, but visuals? Not so much. When banks need to spot trends, risks, or customer patterns fast, clunky charts won’t cut it.
That’s where banking analytics steps in. It turns raw data into smart decisions, and data visualization plays a bigger role than most think. Seeing patterns beats reading rows.
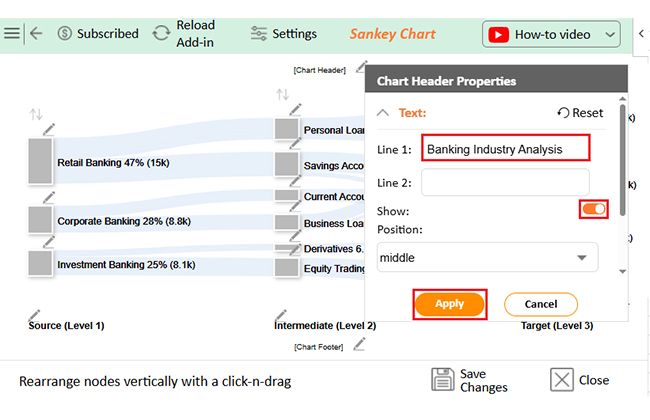
But Excel doesn’t always deliver that clarity. It relies on tools like ChartExpo to turn dull spreadsheets into powerful visuals. With a Sankey diagram generator in the mix, banking data becomes easier to interpret at a glance.
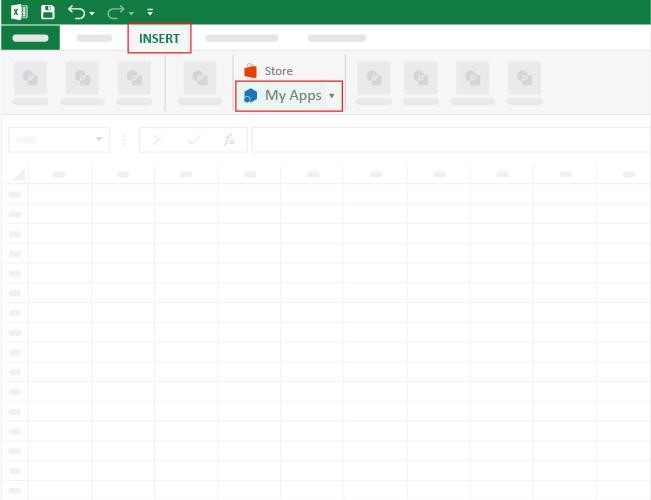
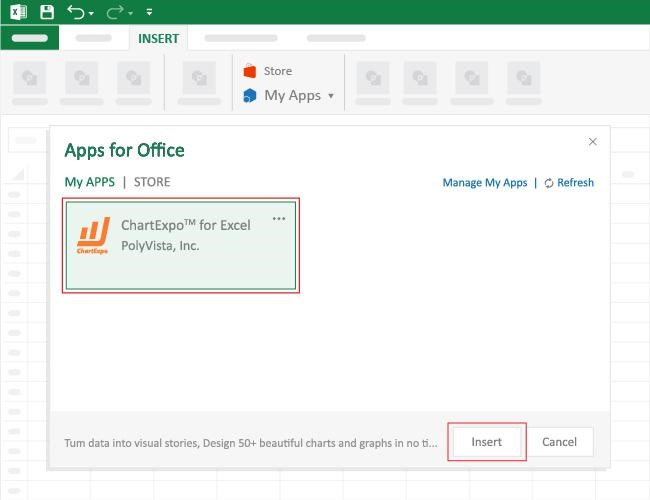
How to Install ChartExpo in Excel?
ChartExpo charts are available both in Google Sheets and Microsoft Excel. Please use the following CTAs to install the tool of your choice and create beautiful visualizations with a few clicks in your favorite tool.
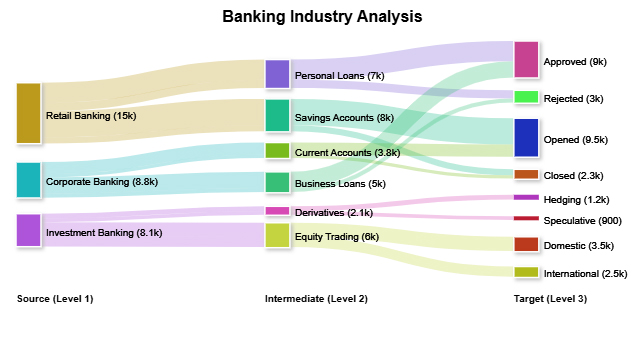
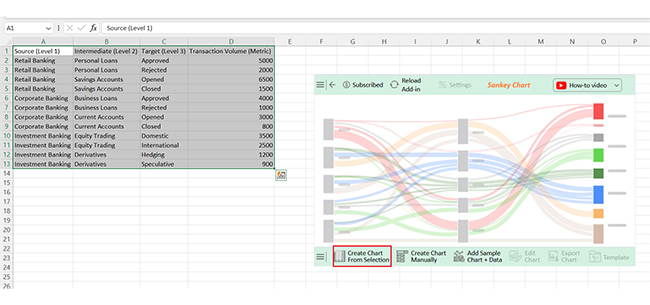
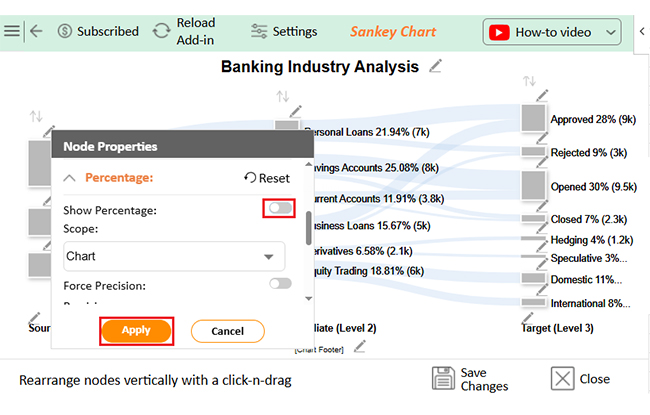
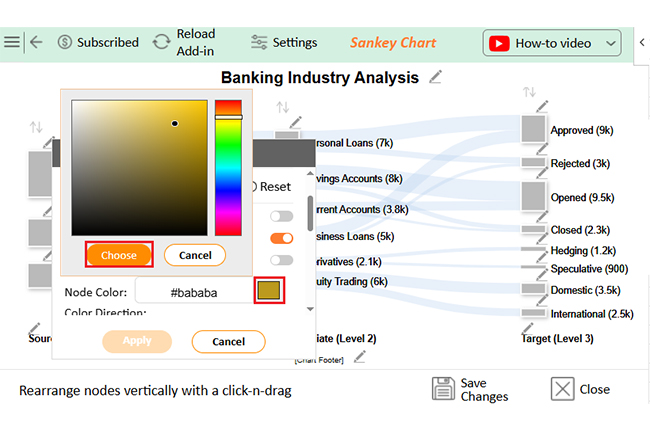
Let’s analyze this sample data in Excel using a Sankey chart in Excel with ChartExpo.
|
Source (Level 1) |
Intermediate (Level 2) | Target (Level 3) |
Transaction Volume (Metric) |
| Retail Banking | Personal Loans | Approved | 5000 |
| Retail Banking | Personal Loans | Rejected | 2000 |
| Retail Banking | Savings Accounts | Opened | 6500 |
| Retail Banking | Savings Accounts | Closed | 1500 |
| Corporate Banking | Business Loans | Approved | 4000 |
| Corporate Banking | Business Loans | Rejected | 1000 |
| Corporate Banking | Current Accounts | Opened | 3000 |
| Corporate Banking | Current Accounts | Closed | 800 |
| Investment Banking | Equity Trading | Domestic | 3500 |
| Investment Banking | Equity Trading | International | 2500 |
| Investment Banking | Derivatives | Hedging | 1200 |
| Investment Banking | Derivatives | Speculative | 900 |
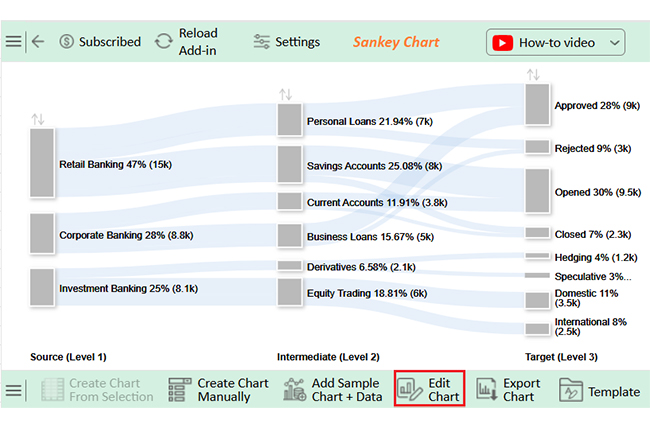
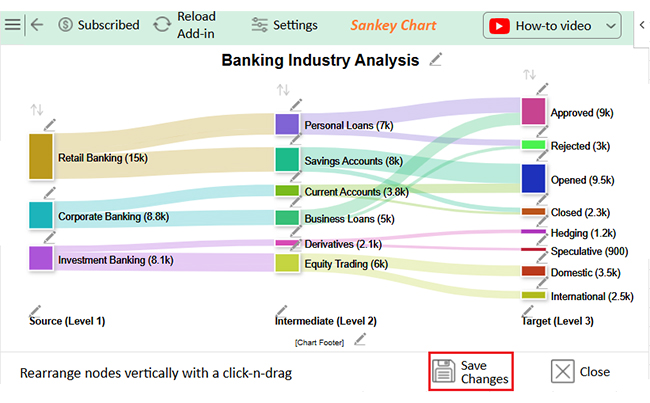
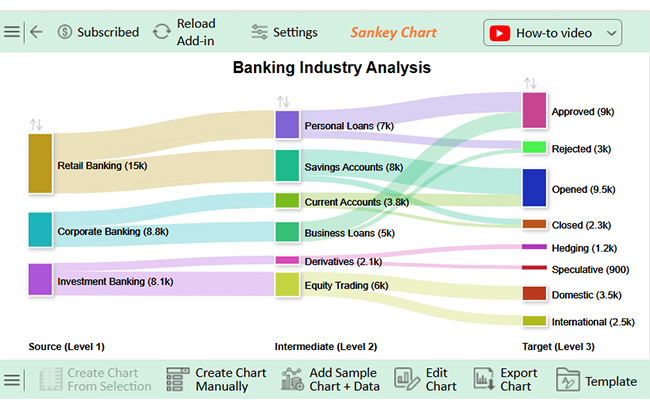
Retail Banking
Corporate Banking
Investment Banking
Derivatives
Data is powerful—if you use it right. Many banks collect it, and fewer turn it into action. The approach must be innovative, focused, and flexible to get real results.
Here are practical tips for using data analytics that drive value.
Data can transform banking—but only if the hurdles are handled well. From protecting customer trust to finding the right talent, each challenge can slow progress or stall it entirely. Here’s what banks must confront to make analytics truly work.
Data analysts in banking collect, clean, and analyze financial data. They spot trends and risks to support decision-making. Moreover, they help improve services and ensure compliance with regulations. Their insights boost profits and reduce fraud.
Banking analytics is the process of analyzing data to improve banking decisions. It helps banks manage risks and spot opportunities. By using analytics, banks can better understand their customers and markets.
One key use is monitoring the capital adequacy ratio. This ratio shows how much capital a bank has compared to its risks. Analytics makes tracking this ratio easier and more accurate.
Banks also use analytics to forecast the provision for credit losses. This means estimating how much money they might lose from bad loans. Accurate predictions help banks prepare and stay stable.
Another tool banks use is profit and loss templates in Excel. These templates organize financial data. When combined with analytics, they help banks understand their true profitability.
In short, banking analytics turns raw data into valuable insights. It supports better planning, risk management, and customer service. Banks that use it stay competitive in a changing market.
As the banking world grows more complex, analytics becomes more vital. It’s no longer optional—it’s essential for success. Install ChartExpo for Excel today to make banking data analysis a breeze.
How much did you enjoy this article?


Calculate accounts receivable turnover ratio to measure credit collection speed, improve cash flow, and strengthen your financial strategy. Read on!

Change Management KPIs are the key to tracking adoption, performance, and ROI during transitions. Find out which metrics matter. Read on!

Data collection methods and techniques determine the quality of every insight you act on. Explore key approaches for gathering reliable data. Read on!


