Categories
Organizational change fails far more often than it succeeds, and the cause is rarely the strategy itself. Most transformations collapse because leaders lack visibility into what is actually happening on the ground.
Adoption stalls, resistance builds, and by the time the problem is visible, it is already expensive. Change Management KPIs close that gap by converting behavior and performance into data that teams can act on without delay.
This guide walks through what these KPIs measure, why each one carries weight, how to track them in a structured way, and how to interpret the data once it is in front of you. Practical examples are included throughout.
Definition: Change Management KPIs are quantifiable indicators that reveal how well an organization is executing a planned transition. They convert employee behavior, system usage, and operational output into measurable data.
These indicators sit within a broader set of organizational KPIs covering the full arc of a transformation, from the first day of rollout through to stable, sustained adoption. Their core purpose is to confirm that change is moving in the direction the business intended.
Key areas covered include adoption rate, employee engagement, training outcomes, and productivity shifts. When a company deploys new software, for example, these indicators show whether employees are using it as intended and whether output is improving as a result.
Without measurable feedback, leaders are left guessing whether a change initiative is gaining traction or quietly failing. These indicators provide the visibility needed to act early and adjust course. Key reasons they matter include:
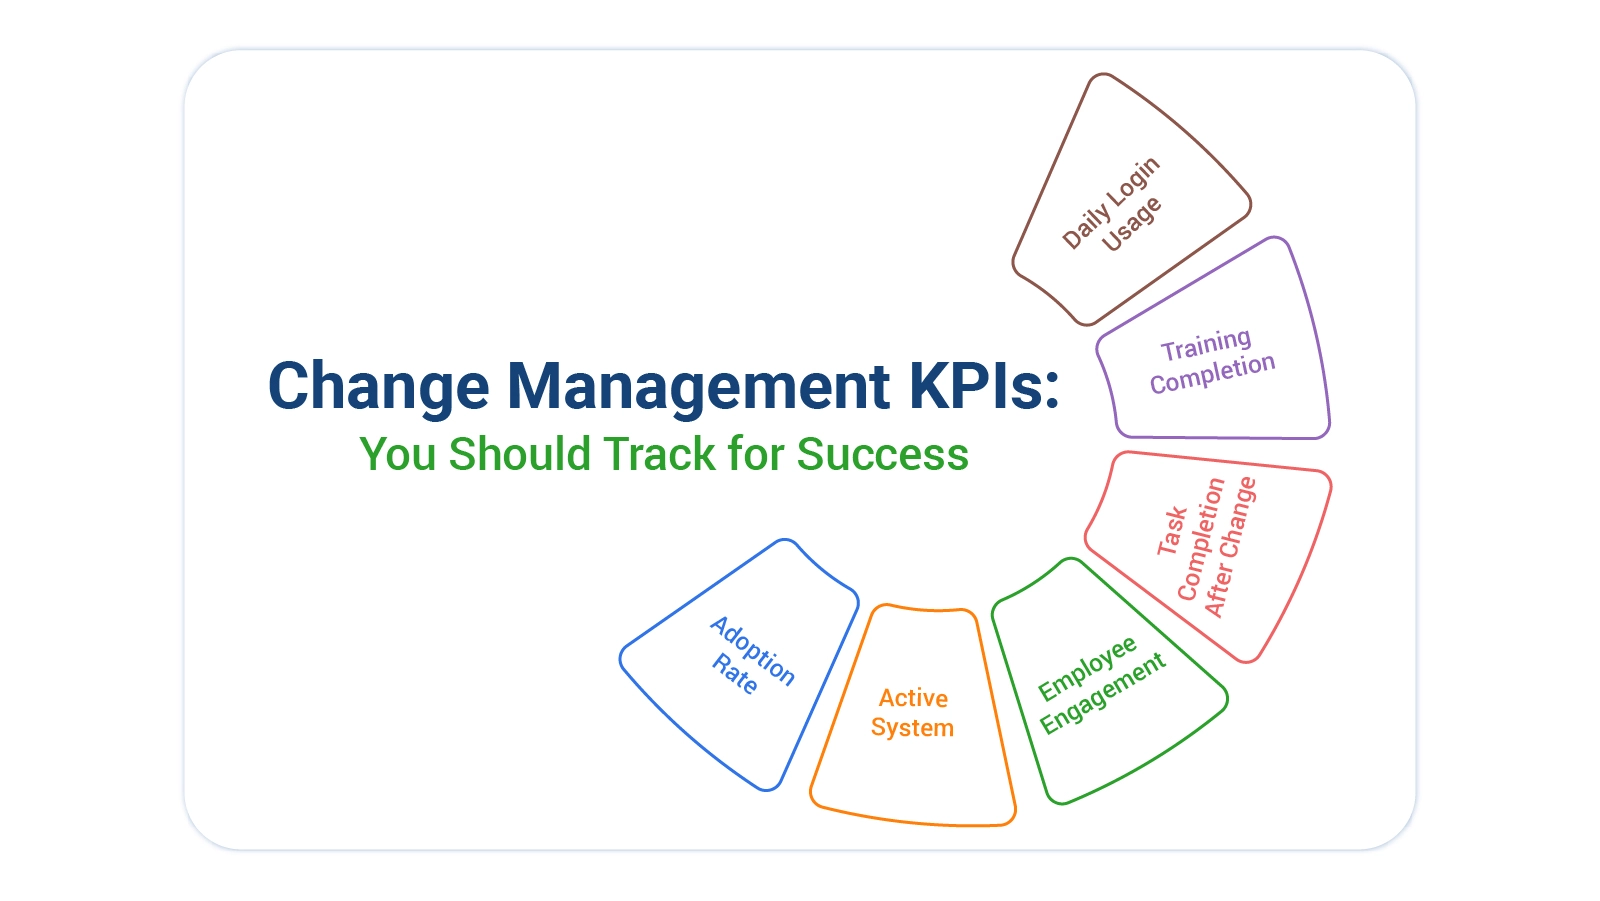
Grouping these indicators into categories makes it easier to evaluate performance across each dimension of a transformation. These categories give leaders a complete picture of what is working and what needs attention. Main categories include:
Tracking adoption and performance during a transition requires tools that can gather data, surface patterns, and present results in a usable format. The right combination allows teams to monitor multiple indicators at the same time. Main tools include:
Consistent tracking is what turns KPIs from passive records into decision-making tools. Gauging success requires combining system performance data with employee input, much the same way customer success KPIs connect operational output to real-world outcomes. Key measures include:
These KPIs allow organizations to assess employee adoption, system performance, and business outcomes across all phases of a change initiative.
Tracks the proportion of employees who are actively using the new system or following the updated process after the transition.
Measures whether training content is equipping employees with the knowledge and skills needed to work effectively with new tools or processes.
Reflects the degree to which employees are contributing to the change through communication, feedback submissions, and regular usage.
Gathers employee perspectives on satisfaction and pain points, providing qualitative context that complements quantitative data.
Gauges the extent to which managers and senior leaders are visibly guiding, advocating for, and sustaining the change initiative.
Monitors the proportion of employees who received and accurately understood communications sent about the change.
Evaluates the time, cost, or effort involved in completing tasks before and after the change to determine whether the process improved.
Verifies that planned change activities are being delivered on schedule and that project milestones are being met.
Assesses output improvements resulting from the change, using the same measurement logic applied when sales KPIs are used to evaluate performance and operational results.
Calculates the net benefit of the change relative to the total investment required to plan, execute, and sustain it.
Quantifies reductions in operating costs that result from improved processes, systems, or workflows introduced by the change.
Monitors how frequently employees are using the new software, tool, or workflow in their day-to-day activities.
Real-world scenarios make these KPIs more concrete. The following examples show how organizations use performance indicators to evaluate specific aspects of a transition.
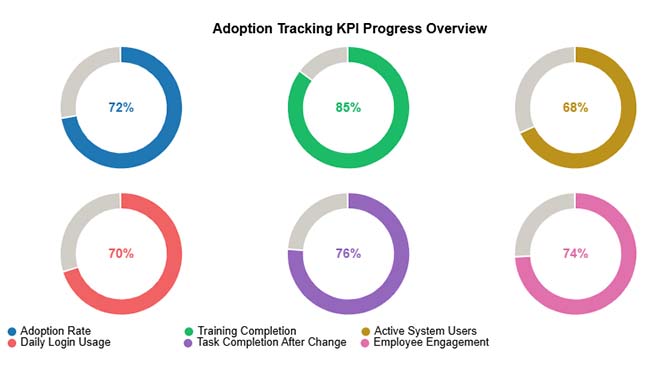
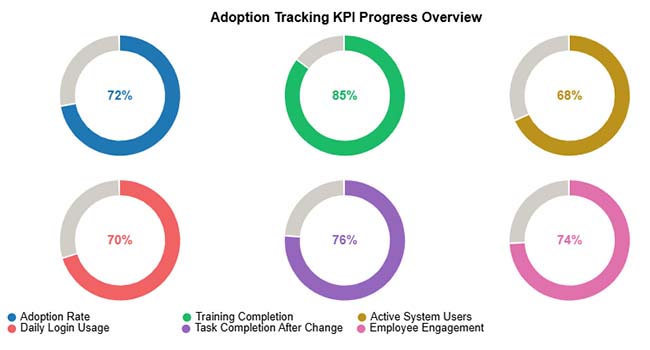
The Adoption Tracking KPI chart presents the metrics that determine whether a system implementation is succeeding, giving teams the data to identify where employees are engaged and where gaps in adoption remain.
Example Insight: Pinpoints adoption gaps to help teams prioritize support and improve system usage rates.
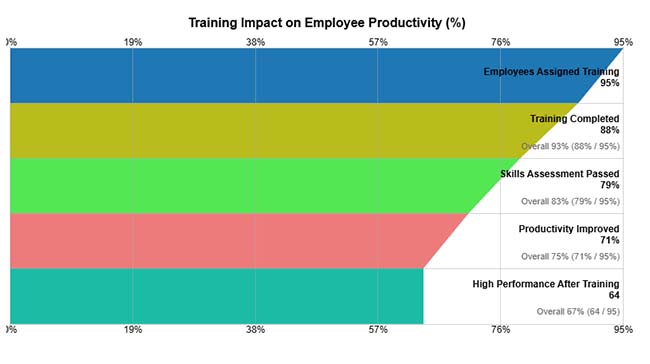
The Training Impact chart maps the relationship between training completion, assessment results, and productivity levels, making it possible to see where training is converting into on-the-job performance and where it is not.
Example Insight: Reveals the gap between completing training and achieving productivity improvement.
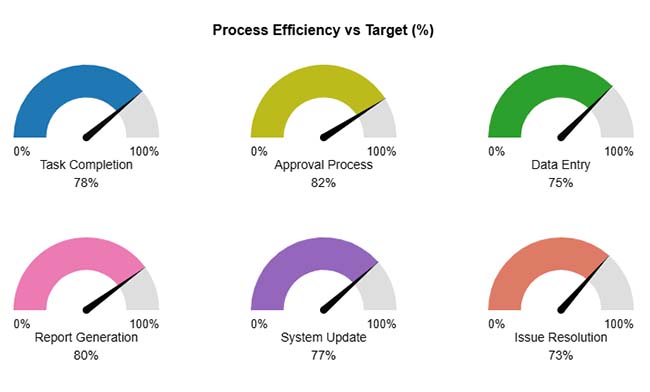
The Process Efficiency chart plots actual task performance against the 100% target benchmark across multiple process areas, highlighting where execution is falling short of expected standards after the change.
Example Insight: Identifies which process areas need further improvement to reach target efficiency levels.
These scenarios demonstrate the same diagnostic approach used when software development KPIs are applied to evaluate the performance of new tools after they are introduced.
By using Google Sheets to track adoption, performance, and risk indicators, teams can monitor progress in real time and identify problems before they become setbacks.
Follow these steps to analyze these KPIs effectively:
Start by organizing your dataset so that every change activity is recorded clearly. A structured sheet makes KPI analysis more accurate and easier to manage.
Common columns may include:
Keeping all KPI data in one place allows organizations to track change progress consistently across teams.
The first goal of change management is adoption. Measure how many employees are actually using the new system or process.
Examples of useful calculations:
These metrics help detect low adoption and training gaps early.
Change success should be measured by performance improvement. Compare results before and after implementation.
You can analyze:
This comparison shows whether the change is delivering real benefits.
Segmenting KPI data helps identify where change is working and where support is needed.
Data can be grouped by:
Segmentation makes it easier to understand performance differences across the organization.
Charts make KPI results easier to understand than raw numbers. Visualizing change management metrics and KPIs helps managers quickly see trends and performance.
Common charts include:
Google Sheets supports basic charts, but tools like ChartExpo can create more advanced visualizations, making KPI reports clearer and easier to present to management.
Tracking these indicators on an ongoing basis gives organizations the evidence they need to act with confidence throughout a transformation. Main benefits include:
These KPIs deliver value only when they are chosen with care. Selecting the right indicators from the outset gives organizations a reliable foundation for managing change with precision and achieving the results they set out to reach.
They improve project outcomes by delivering measurable data on adoption, performance levels, and emerging risks. This visibility allows teams to identify and resolve problems before they affect the timeline or the result.
They should be reviewed weekly while a change initiative is active, then shifted to a monthly cadence once the transition is complete, to confirm that performance and adoption remain stable.
Common obstacles include poorly defined goals, incomplete or inconsistent data, and employee resistance to being measured. Regular reviews and clear metric definitions reduce all three of these risks.
Sustained, successful transformation depends on visibility into what is actually changing and what is not. When organizations know precisely where adoption is stalling, where training gaps exist, and where ROI is beginning to materialize.
They can intervene before small setbacks become costly failures. Change Management KPIs provide that visibility in a form that is consistent, comparable, and actionable.
The metrics covered in this guide span the full arc of a transition, from early adoption signals through to long-term performance outcomes. Tracking them consistently, visualizing the data clearly, and reviewing results at regular intervals gives every change initiative a structured path toward measurable success.
How much did you enjoy this article?


Calculate accounts receivable turnover ratio to measure credit collection speed, improve cash flow, and strengthen your financial strategy. Read on!

Data collection methods and techniques determine the quality of every insight you act on. Explore key approaches for gathering reliable data. Read on!

Measuring Workforce Productivity helps businesses track performance and boost efficiency. Explore key methods, formulas, and metrics. Read on!