• Home
  • Tools dropdown img
    • Spreadsheet Charts

      • ChartExpo for Google Sheets
      • ChartExpo for Microsoft Excel
    • Power BI Charts

      • Power BI Custom Visuals by ChartExpo
    • Word Cloud

  • Charts dropdown img
    • Chart Category

      • Bar Charts
      • Circle Graphs
      • Column Charts
      • Combo Charts
      • Comparison Charts
      • Line Graphs
      • PPC Charts
      • Sentiment Analysis Charts
      • Survey Charts
    • Chart Type

      • Box and Whisker Plot
      • Clustered Bar Chart
      • Clustered Column Chart
      • Comparison Bar Chart
      • Control Chart
      • CSAT Survey Bar Chart
      • CSAT Survey Chart
      • Dot Plot Chart
      • Double Bar Graph
      • Funnel Chart
      • Gauge Chart
      • Likert Scale Chart
      • Matrix Chart
      • Multi Axis Line Chart
      • Overlapping Bar Chart
      • Pareto Chart
      • Radar Chart
      • Radial Bar Chart
      • Sankey Diagram
      • Scatter Plot Chart
      • Slope Chart
      • Sunburst Chart
      • Tornado Chart
      • Waterfall Chart
      • Word Cloud
    • Google Sheets
      Microsoft Excel
  • Services
  • Pricing
  • Contact us
  • Blog
  • Support dropdown img
      • Gallery
      • Videos
      • Contact us
      • FAQs
      • Resources
    • Please feel free to contact us

      atsupport@chartexpo.com

Categories
All Data Visualizations Data Analytics Surveys
Add-ons/
  • Google Sheets
  • Microsoft Excel
  • Power BI
All Data Visualizations Data Analytics Surveys
Add-ons
  • Google Sheets
  • Microsoft Excel
  • Power BI

We use cookies

This website uses cookies to provide better user experience and user's session management.
By continuing visiting this website you consent the use of these cookies.

Ok

ChartExpo Survey


Home > Blog > Data Analytics

Software Development KPIs to Share the Project Progress

What is a software development KPI, and why does it matter? In today’s tech-driven market, measuring performance isn’t optional—it’s expected. A software development KPI tells the story behind the code.

Software Development KPIs

It shows how efficiently teams work, how fast bugs are fixed, and how products improve over time. Without them, you’re working blind; with them, you can track cycle times, deployment frequency, and mean time to recovery. All these are critical for staying competitive.

Still, not all metrics lead to smarter decisions. Some distract more than they inform. That’s why companies are shifting toward more SMART KPIs—specific, Measurable, Achievable, Relevant, and Time-bound. These aren’t vanity stats; these are signals.

If you think measuring lines of code or story points alone is enough, think again. High-performing engineering teams measure what drives outcomes, not activity. And the smartest ones visualize it. That’s where KPI graphs come in—quick, precise, and actionable.

So, how do you decide which metrics to follow? Start by asking what success looks like. Then pick KPIs that track it. It’s about tracking what matters.

Let me guide you through tracking these KPIs…

Table of Contents:

  1. What are Software Development KPIs?
  2. Why Should You Measure Software Development KPIs?
  3. 15 Essential Software Development KPIs
  4. How to Select Software Development Key Performance Indicators (KPIs)?
  5. How to Analyze Software Development KPI Templates in Google Sheets?
  6. Tips for Tracking Software Engineering KPIs
  7. FAQs
  8. Wrap Up

What are Software Development KPIs?

Definition: Software development KPIs are measurable values that track how efficiently a development team achieves its goals. These metrics help monitor code quality, team productivity, and delivery timelines. Customer success metrics can also overlap when features affect user satisfaction.

Common examples include sprint velocity, deployment frequency, and bug resolution time. Teams use these KPIs to improve performance and identify bottlenecks.

KPI graphs make trends easier to spot and decisions easier to make. The right KPIs keep projects on track.

Why Should You Measure Software Development KPIs?

Without metrics and KPIs, you’re running on assumptions, and that’s risky. Tracking software development KPIs gives you complex data. It turns guesswork into clarity.

How?

  • Improve team performance: Tracking KPIs reveals slowdowns, inefficiencies, and process gaps that may not be noticeable day-to-day. With precise data, teams can adjust quickly and focus on high-impact tasks.
  • Ensure timely delivery: KPIs like cycle time and sprint completion rate help teams stay on schedule. Spotting delays early will help you reduce missed deadlines and better manage stakeholder expectations.
  • Maintain code quality: Monitoring code-related KPIs, such as bug count or code churn, helps identify recurring issues. This leads to cleaner, more stable code and fewer post-release problems.
  • Align with business goals: KPIs ensure technical work supports broader objectives, such as increasing satisfaction. For example, syncing with key performance indicators for operations helps prioritize features that drive results.
  • Foster transparency and accountability: Communication improves when everyone can see the numbers. Teams become more responsible for their contributions and decisions.
  • Boost team morale: Visible progress keeps developers motivated and confident. Celebrating KPI improvements reinforces team spirit and creates a culture of achievement.

15 Essential Software Development KPIs

Is your code clean and your team efficient? We’ll find out.

KPIs aren’t buzzwords. They’re your dev team’s health check. The right ones tell you where you’re strong—and where you’re leaking time, quality, or momentum.

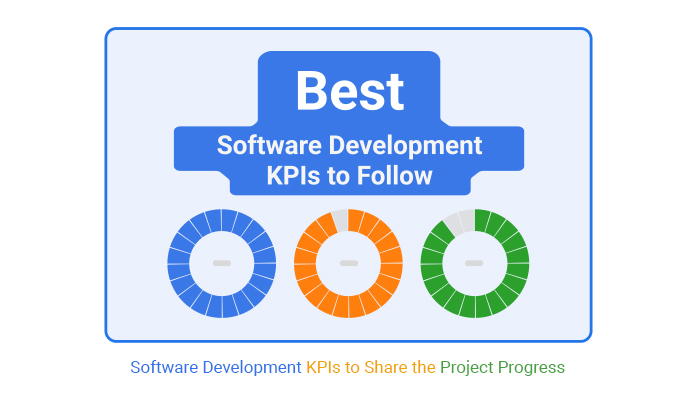
Here are 15 essential software development KPIs every team should track.

  1. Velocity: Tracks how much work your team completes in a sprint. It helps forecast future performance.
  2. Lead time: Measures the time from idea to code in production. Shorter lead time means faster delivery.
  3. Cycle time: Focuses on active development time only. It’s a strong indicator of workflow efficiency.
  4. Deployment frequency: Tells you how often you release to users. High frequency means faster innovation.
  5. Change failure rate: Shows what percentage of deployments cause issues. Lower is better—it signals quality.
  6. Mean time to recovery (MTTR): Measures how fast your team resolves failures. The quicker, the stronger your incident response.
  7. Code coverage: Tracks how much of your codebase is tested. More coverage is directly proportional to fewer surprises.
  8. Defect density: Calculates bugs per 1,000 lines of code—a clear metric for code quality.
  9. Bug fix rate: How fast does your team squash bugs? This KPI keeps product stability in check.
  10. Escaped defects: Counts the number of bugs users find post-release. Lower numbers mean better pre-launch testing.
  11. Code churn: Measures how often code changes after it’s written. Too much churn means wasted effort.
  12. Technical debt: Tracks shortcuts that could slow you down later. Managing it keeps your project sustainable.
  13. Sprint burndown: Shows work completed versus planned. This KPI keeps the team honest and on pace.
  14. Team satisfaction: Happy developers give better output. Use surveys to track morale and act on the feedback.
  15. Customer satisfaction (CSAT): CSAT constitutes direct feedback from users. It’s a key customer success KPI that reflects the actual impact of your software.

How to Select Software Development Key Performance Indicators (KPIs)?

Choosing the right KPIs isn’t about measuring what drives results. The goal is to focus on metrics that directly impact your team’s performance, product quality, and business value.

Here’s how to select the most effective KPIs for your team:

  1. Understand business goals: Start by identifying what your organization is trying to achieve. Your KPIs should support those specific outcomes, whether the focus is revenue growth, faster delivery, etc.
  2. Focus on process efficiency: Efficient workflows lead to faster releases and fewer bottlenecks. Metrics like lead time and cycle time reveal how smoothly tasks move through development.
  3. Measure code quality: High-quality code reduces bugs, improves stability, and saves time in the long run. Metrics such as defect density and test coverage give insight into the overall health of your codebase.
  4. Prioritize agile metrics: Continuous improvement is key for Agile teams—track metrics like sprint velocity and burndown charts to evaluate progress and adjust plans based on real data.
  5. Align with customer needs: Every line of code should bring value to the user. Including metrics like customer satisfaction or feature adoption rates ensures your product meets real customer expectations.
  6. Set measurable and actionable KPIs: Vague metrics can’t drive improvement. So, choose indicators that are clear, quantifiable, and directly tied to specific team behaviors or outcomes.

How to Analyze Software Development KPI Templates in Google Sheets?

Data tells the story, but without clear visuals, it’s just numbers staring back at you. Google Sheets does the job, but it often leaves you wanting more when it comes to slick, insightful charts.

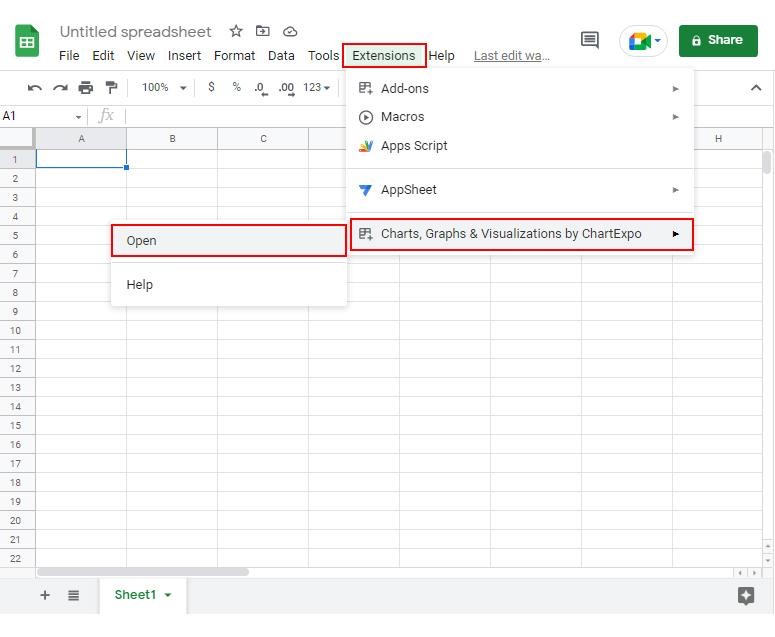
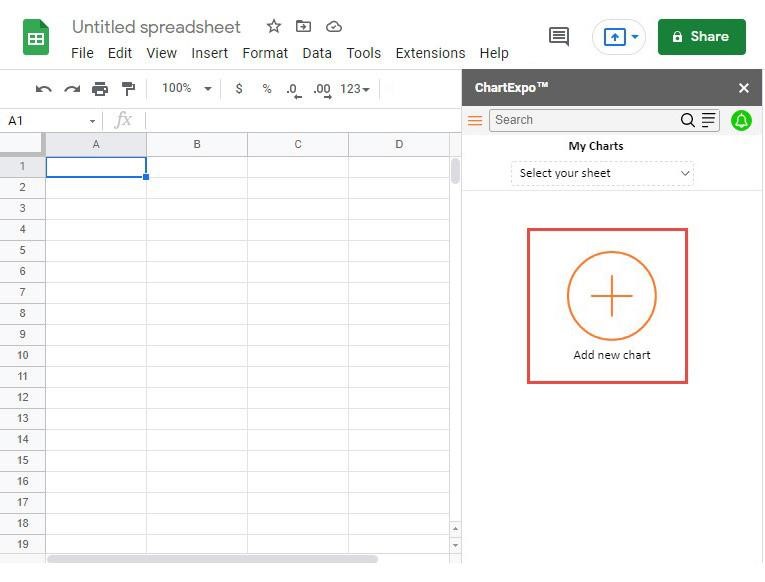
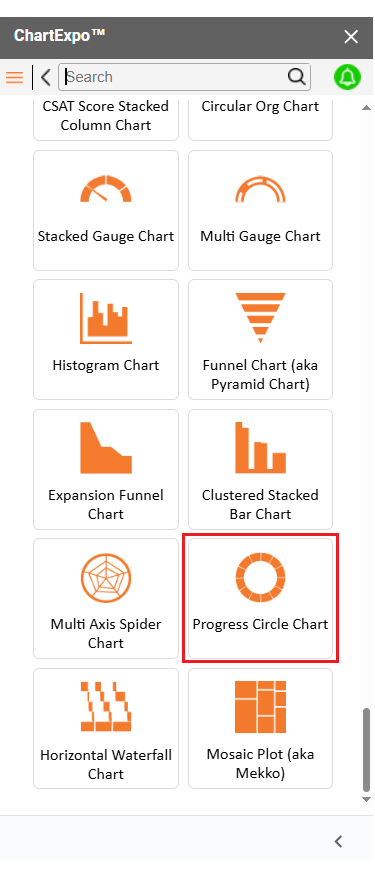
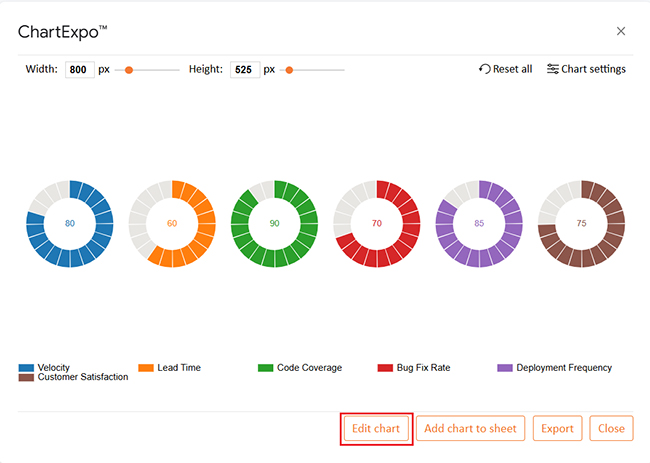
Don’t let Google Sheets’ limitations let you down; we have ChartExpo. This add-on transforms boring data into insightful, easy-to-understand visuals. With ChartExpo, tracking KPIs gets a whole lot easier.

How to Install ChartExpo in Google Sheets?

  1. To start using ChartExpo, download it directly from the Google Sheets program. To do this, select Extensions from the top toolbar.
  2. A menu will appear. Click the Get add-ons option.
  3. Search for ChartExpo, and click on Charts, Graphs & Visualizations by ChartExpo when it appears in the results.
  4. Click the Install button. You will have to confirm your Google account and accept some permissions.

ChartExpo charts are available both in Google Sheets and Microsoft Excel. Please use the following CTAs to install the tool of your choice and create beautiful visualizations in a few clicks in your favorite tool.

Example

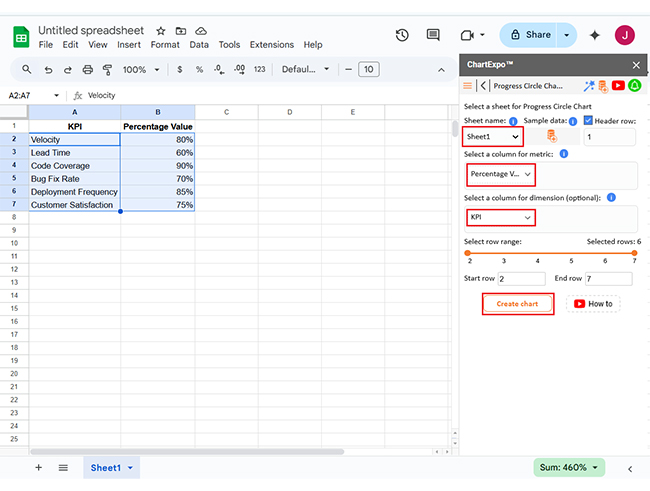
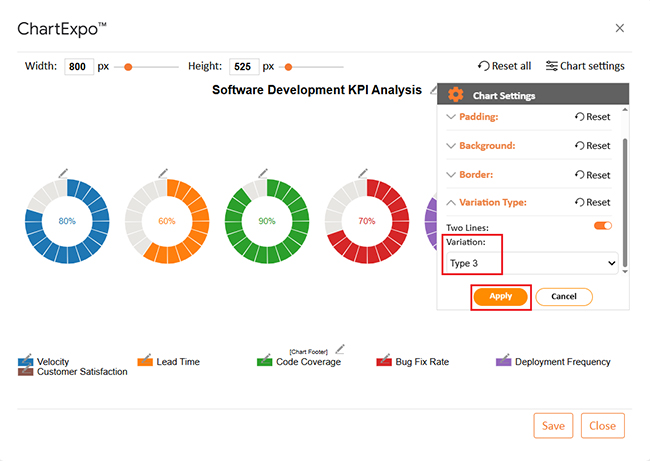
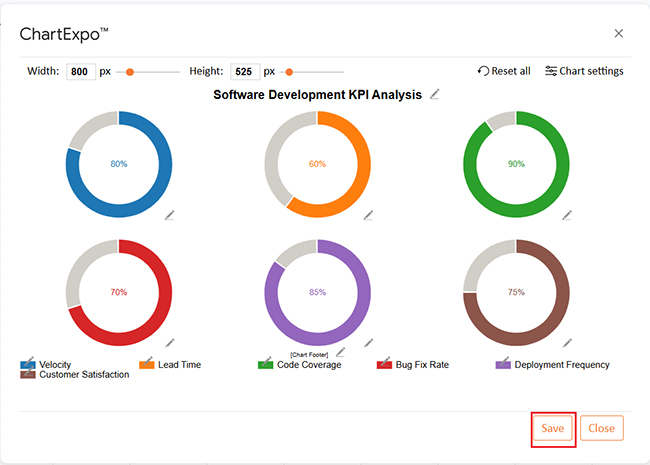
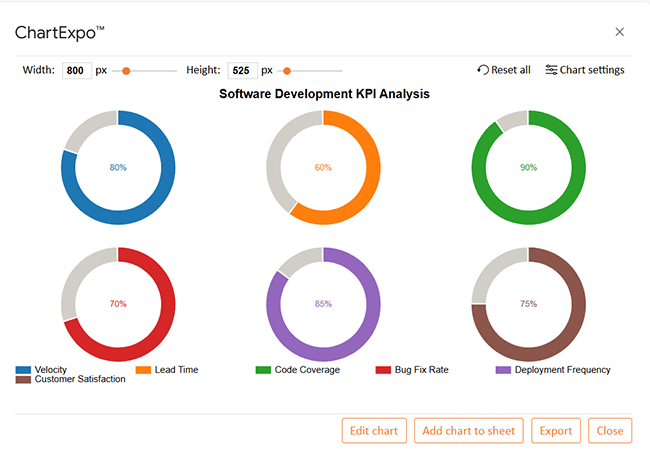
Let’s analyze this sample data in Google Sheets using ChartExpo.

KPI Percentage Value
Velocity 80%
Lead Time 60%
Code Coverage 90%
Bug Fix Rate 70%
Deployment Frequency 85%
Customer Satisfaction 75%
  • To get started with ChartExpo, install ChartExpo in Google Sheets.
  • Go to Extensions > Charts, Graphs & Visualizations by ChartExpo > Open.
Software Development KPIs
  • To access the charts library, click the Add new chart button.
Software Development KPIs
  • Once it loads, scroll through the charts list to locate and choose the “Progress Circle Chart”.
Software Development KPIs
  • Click the “Create Chart From Selection” button after selecting the data from the sheet, as shown.
Software Development KPIs
  • If you want to add anything to the chart, click the Edit Chart button:
Software Development KPIs
  • Click the pencil icon next to the Chart Header to change the title.
  • It will open the properties dialog. Under the Text section, you can add a heading in Line 1 and enable Show.
  • Give the appropriate title of your chart and click the Apply button.
Software Development KPIs
  • You can add the percentage sign with all values as follows:
Software Development KPIs
  • You can change the data representation by clicking on Settings as follows:
Software Development KPIs
  • After making all the changes, click the “Save” button:
Software Development KPIs
  • Your final chart will look like the one below.
Software Development KPIs

Insights

  • Code coverage: 90% – Strong testing coverage.
  • Deployment frequency: 85% – Consistent and frequent releases.
  • Velocity: 80% – Solid team productivity.
  • Lead time: 60% – Needs improvement in speeding up delivery.
  • Bug fix rate: 70% – Some delays in issue resolution.
  • Customer satisfaction: 75% – Moderate alignment with user expectations.

Tips for Tracking Software Engineering KPIs

Tracking software engineering KPIs can feel overwhelming without a clear plan. But when it’s done right, it gives you a real edge. Here’s how to make your tracking efficient and meaningful:

  • Align KPIs with business objectives: Connect your KPIs directly to your company’s goals. This ensures that every metric drives real value, not just busywork.
  • Use a centralized dashboard and automate data collection: Keep all your KPIs in one easy-to-access place. Automate data gathering to save time and reduce errors, so you get accurate information fast.
  • Track KPIs regularly and focus on actionable metrics: Check your numbers often and prioritize metrics that lead to clear actions. This keeps your team focused on what matters most.
  • Communicate results with the team: Share KPI insights openly to build transparency. When everyone knows the data, collaboration and accountability improve.
  • Review and adjust KPIs: KPIs aren’t set in stone. Regularly revisit and refine them to match shifting priorities and keep progress on track.

FAQs

What is a KPI in app development?

A KPI in app development is a measurable value that tracks progress toward key goals. Common KPIs include user retention, crash rate, and release frequency. These metrics help improve quality, user experience, and delivery speed.

How do you measure the performance of a software developer?

  • Track completed tasks and code commits.
  • Monitor bug resolution speed and code quality.
  • Use peer reviews and team feedback.
  • Evaluate consistency in sprint contributions and delivery timelines.

Wrap Up

Software development KPIs help teams stay on track by turning performance into numbers. These numbers guide decisions, showing what’s working and what needs fixing.

Good KPIs improve delivery speed and code quality. You can catch issues early, saving time and effort.

Every business area uses KPIs. For example, KPIs for call centers focus on response time and customer satisfaction. These metrics help manage service quality, and development teams need similar clarity.

Data drives growth in retail. Retail industry KPIs track sales per square foot, inventory turnover, and customer retention. Software teams that support retail must align with these goals.

Sales teams also rely on precise targets. What are sales KPIs? Things like conversion rate, lead time, and revenue per rep. These are key in software products with a sales cycle.

For digital products, SaaS key performance indicators matter most. These include churn rate, customer lifetime value, and monthly recurring revenue. Development KPIs should support these outcomes.

In short, software KPIs are not isolated. They connect to business goals across departments. The right metrics build better products and better results.

And don’t forget to install ChartExpo. This tool will help you turn raw KPI data into easy-to-read KPI graphs that drive action.

How much did you enjoy this article?

ExcelAd1
Start Free Trial!
152694

Related articles

next previous
Data Analytics8 min read

Public Relations KPIs: Insights Made Easy for PR

Public relations KPIs measure PR performance. This blog explains key metrics, tracking methods, and benefits to optimize your communications strategy.

Data Analytics7 min read

Customer Experience Dashboard for Quick Insights

This guide explores the importance and features of a customer experience (CX) dashboard.

Data Analytics7 min read

Manufacturing Dashboard: Insights Made Easy

This guide shows you what a manufacturing dashboard is, and how to choose the right production dashboard. It also shows you how the dashboard works.

Data Analytics7 min read

Operations Dashboard for Executive Level Insights

This guide explains everything you need to know about operation dashboards, including what they include and how to create one.

Data Analytics12 min read

How to Analyze Financial Statements in Excel?

Learn how to analyze financial statements step-by-step. Master balance sheets, income statements, and cash flow for smarter business decisions.

ChartExpo logo

Turn Data into Visual
Stories

CHARTEXPO

  • Home
  • Gallery
  • Videos
  • Services
  • Pricing
  • Contact us
  • FAQs
  • Privacy policy
  • Terms of Service
  • Sitemap

TOOLS

  • ChartExpo for Google Sheets
  • ChartExpo for Microsoft Excel
  • Power BI Custom Visuals by ChartExpo
  • Word Cloud

CATEGORIES

  • Bar Charts
  • Circle Graphs
  • Column Charts
  • Combo Charts
  • Comparison Charts
  • Line Graphs
  • PPC Charts
  • Sentiment Analysis Charts
  • Survey Charts

TOP CHARTS

  • Sankey Diagram
  • Likert Scale Chart
  • Comparison Bar Chart
  • Pareto Chart
  • Funnel Chart
  • Gauge Chart
  • Radar Chart
  • Radial Bar Chart
  • Sunburst Chart
  • see more
  • Scatter Plot Chart
  • CSAT Survey Bar Chart
  • CSAT Survey Chart
  • Dot Plot Chart
  • Double Bar Graph
  • Matrix Chart
  • Multi Axis Line Chart
  • Overlapping Bar Chart
  • Control Chart
  • Slope Chart
  • Clustered Bar Chart
  • Clustered Column Chart
  • Box and Whisker Plot
  • Tornado Chart
  • Waterfall Chart
  • Word Cloud
  • see less

RESOURCES

  • Blog
  • Resources
  • YouTube
SIGN UP FOR UPDATES

We wouldn't dream of spamming you or selling your info.

© 2025 ChartExpo, all rights reserved.