• Home
  • Tools dropdown img
    • Spreadsheet Charts

      • ChartExpo for Google Sheets
      • ChartExpo for Microsoft Excel
    • Power BI Charts

      • Power BI Custom Visuals by ChartExpo
    • Word Cloud

  • Charts dropdown img
    • Chart Category

      • Bar Charts
      • Circle Graphs
      • Column Charts
      • Combo Charts
      • Comparison Charts
      • Line Graphs
      • PPC Charts
      • Sentiment Analysis Charts
      • Survey Charts
    • Chart Type

      • Box and Whisker Plot
      • Clustered Bar Chart
      • Clustered Column Chart
      • Comparison Bar Chart
      • Control Chart
      • CSAT Survey Bar Chart
      • CSAT Survey Chart
      • Dot Plot Chart
      • Double Bar Graph
      • Funnel Chart
      • Gauge Chart
      • Likert Scale Chart
      • Matrix Chart
      • Multi Axis Line Chart
      • Overlapping Bar Chart
      • Pareto Chart
      • Radar Chart
      • Radial Bar Chart
      • Sankey Diagram
      • Scatter Plot Chart
      • Slope Chart
      • Sunburst Chart
      • Tornado Chart
      • Waterfall Chart
      • Word Cloud
    • Google Sheets
      Microsoft Excel
  • Services
  • Pricing
  • Contact us
  • Blog
  • Support dropdown img
      • Gallery
      • Videos
      • Contact us
      • FAQs
      • Resources
    • Please feel free to contact us

      atsupport@chartexpo.com

Categories
All Data Visualizations Data Analytics Surveys
Add-ons/
  • Google Sheets
  • Microsoft Excel
  • Power BI
All Data Visualizations Data Analytics Surveys
Add-ons
  • Google Sheets
  • Microsoft Excel
  • Power BI

We use cookies

This website uses cookies to provide better user experience and user's session management.
By continuing visiting this website you consent the use of these cookies.

Ok

ChartExpo Survey


Home > Blog > Data Analytics

LLM Evaluation Metrics: What You Need to Know

Knowing whether an AI model actually works requires more than intuition or anecdotal feedback. LLM evaluation metrics provide engineering and product teams with a systematic framework for measuring output quality, tracking reliability over time, and surfacing issues before they reach production environments.

LLM Evaluation Metrics

From gauging the relevance of answers to checking safety compliance, these measurements convert vague impressions into verifiable, repeatable results.

Whether you are an AI engineer fine-tuning model behavior, a researcher benchmarking outputs, or a business leader making deployment decisions, structured evaluation shapes every outcome.

This guide covers the six core metrics, essential components, practical analysis steps in Google Sheets, and the strategic advantages of consistent measurement.

What are LLM Evaluation Metrics?

Definition: LLM evaluation metrics are standardized measurement methods used to assess the output quality and performance of large language models. They determine whether responses are accurate, contextually relevant, complete, and safe across a range of tasks.

These assessments cover a wide range of output categories, from question-answering and document summarization to translation and multi-turn conversation. They examine attributes such as factual consistency, coherence, and response completeness.

Applied systematically, they allow teams to compare model versions, identify performance gaps across datasets, and maintain reporting consistency.

AI engineers, researchers, compliance officers, and business leaders all rely on this structured data to validate improvements and confirm that outputs meet the standards required for real-world deployment.

Why are LLM Evaluation Metrics Important?

Without quantifiable benchmarks, AI system quality is hard to defend or improve. LLM evaluation KPIs supply the structure teams need to validate performance systematically.

They are critical for teams that need to:

  • Ensure model outputs are reliable: Confirm that responses stay accurate across varied prompt scenarios.
  • Measure answer relevance: Gauge how well each output addresses user intent.
  • Track model improvements over time: Compare versions and connect evaluation findings to performance metrics to show measurable progress.
  • Identify biases or unsafe outputs: Detect harmful or misleading content before it reaches production.
  • Guide fine-tuning strategies: Surface the gaps that point toward necessary retraining.
  • Support comparison across models: Enable objective benchmarking across different model configurations.
  • Provide actionable insights for deployment: Tie evaluation data to organizational metrics and KPIs, informing release decisions.

Key Components of LLM Evaluation Metrics

Sound LLM evaluation metrics depend on structured frameworks and well-defined standards that make assessments reproducible across different environments.

Core components include:

  • Input data quality: Confirms that datasets are clean, diverse, and representative for fair evaluation.
  • Output accuracy and completeness: Determines whether responses are factually correct and fully address each prompt.
  • Evaluation criteria or scoring method: Specifies the standardized rules or scoring scales applied when rating model performance.
  • Contextual understanding: Assesses how accurately the model interprets intent and keeps responses on topic.
  • Consistency across test cases: Confirms stable output across varied inputs, much as agile performance metrics track stability across iterations.
  • Safety and ethical considerations: Flags harmful, biased, or non-compliant outputs before they advance.
  • Reporting and documentation standards: Keeps tracking transparent and aligned with DevOps performance metrics for deployment readiness and ongoing monitoring.

Common Tools for LLM Evaluation Metrics

Dedicated tools help teams run, track, and report LLM evaluation metrics at scale, reducing manual effort and improving result consistency.

Common solutions include:

  • Open-source evaluation libraries: Provide flexible, customizable frameworks for benchmarking and validating model performance.
  • Proprietary evaluation dashboards: Offer centralized monitoring platforms comparable to systems that track website performance metrics across digital products.
  • Automated scoring scripts: Allow automated, consistent performance grading to run across large evaluation datasets.
  • Benchmark datasets: Supply standardized test data for objective comparison across models.
  • Visualization and reporting tools: Turn raw evaluation scores into insights that inform decisions tied to customer success metrics.
  • Integrations with model training pipelines: Connect evaluation directly to development workflows, supporting continuous model improvement.

Top 6 Core LLM Evaluation Metrics

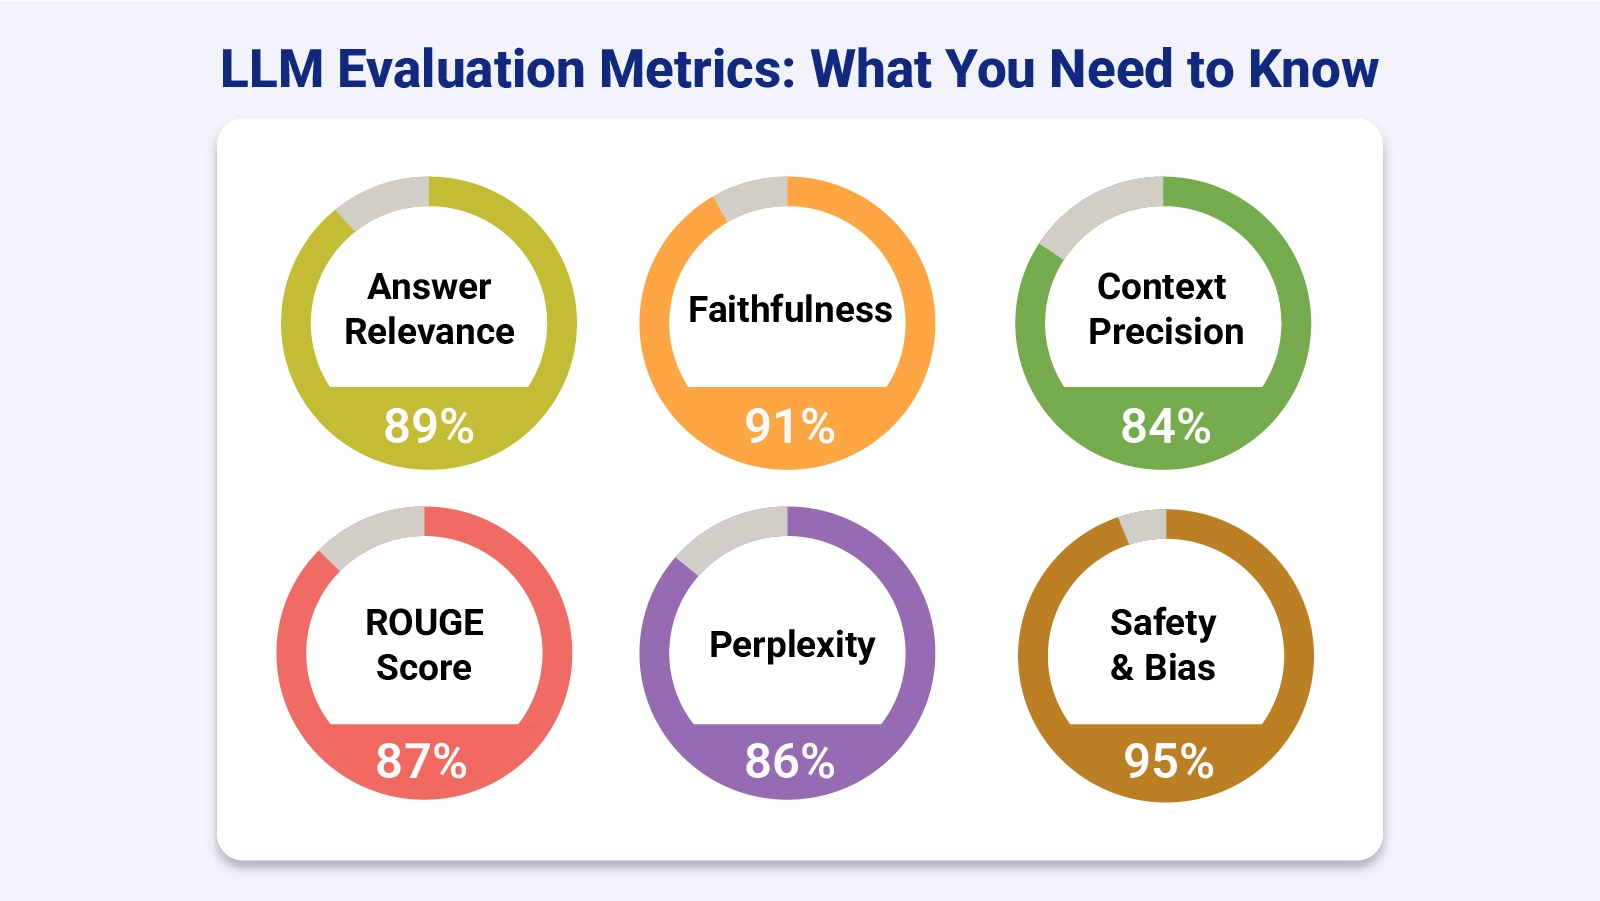
Each of the core LLM evaluation metrics below targets a distinct dimension of output quality. Together, they give teams a structured and reliable basis for assessing whether a model produces accurate, contextually grounded, and responsible outputs.

  • Answer Relevance

Answer relevancy gauges how directly a model’s response addresses the user’s query. It examines whether the output stays on topic, excludes unnecessary detail, and satisfies the intent behind the prompt, much as growth metrics serve as indicators of progress over time.

  • Faithfulness / Groundedness

Faithfulness, also called groundedness, verifies that responses remain factually consistent with the source material. It is the key tool for catching hallucinations and stopping unsupported claims from entering model outputs.

  • Context Precision & Recall

This pair of measures examines how the model retrieves and applies relevant context. Precision reflects the proportion of retrieved information that was actually relevant, while recall captures whether important context was overlooked.

  • ROUGE & BLEU

ROUGE and BLEU measure text similarity by comparing generated outputs against references, delivering quantifiable overlap scores much like financial metrics in structured analytical reporting.

  • Perplexity

Perplexity quantifies how well a language model predicts word sequences. A lower score signals better fluency and a stronger underlying modeling capability.

  • Safety & Bias Metrics

Safety and bias metrics determine whether model outputs carry harmful, toxic, or discriminatory content. They enforce compliance with ethical standards and applicable regulatory requirements.

How to Analyze LLM Evaluation Metrics in Google Sheets?

Working with LLM evaluation KPIs in Google Sheets lets teams organize, compare, and visualize performance data efficiently. Follow these steps:

Step 1: Import and Structure Your Data

  • Start by importing your LLM evaluation results into Google Sheets. Organize the data into clear columns such as prompt, response, score, and comments for easy analysis.

Step 2: Calculate Key Metrics

  • Use built-in formulas to compute averages, variances, and weighted scores. This helps you quantify model performance and compare results systematically.

Step 3: Apply Conditional Formatting

  • Highlight low-performing outputs using conditional formatting. This makes it easier to quickly identify weak responses or inconsistent results.

Step 4: Create Pivot Tables for Comparison

  • Build pivot tables to compare different model versions, prompts, or categories. This allows you to uncover patterns and connect insights with broader business goals.

Step 5: Visualize Trends Over Time

  • Insert charts, such as line or bar charts, to track performance trends. Visualizing changes over time helps monitor improvements and detect issues early.

Step 6: Use Advanced Visualization for Insights

  • For clearer performance tracking, use a Progress Circle Chart through ChartExpo to display completion rates and evaluation scores in a more engaging and easy-to-understand format.
LLM Evaluation Metrics Analysis

Key Insights

  • At 95%, Safety and Bias Compliance tops all dimensions, indicating strong responsible AI performance.
  • Faithfulness (91%) and Answer Relevancy (89%) both score well, confirming accurate and relevant model responses.
  • Context Precision (84%) comes in lowest, signaling room to strengthen contextual retrieval.

Advantages of Applying LLM Evaluation Metrics

Putting LLM metrics into practice delivers measurable value across AI programs by strengthening governance, improving output consistency, and enabling responsible deployment decisions.

Key advantages include:

  • Improves model reliability and performance: Delivers consistent, accurate outputs across varied prompts and use cases.
  • Identifies areas for fine-tuning: Reveals specific weaknesses that require retraining or parameter adjustment.
  • Helps maintain fairness and safety: Catches biased, harmful, or non-compliant responses before they can reach production.
  • Supports data-driven decision making: Delivers measurable insights that guide model updates and release strategies, while gains in customer retention metrics reflect the improved user experience.
  • Enables benchmarking across models: Supports objective comparison between model versions and different configuration options.
  • Provides transparency for stakeholders: Generates clear performance documentation for teams, leadership, and compliance review processes.

Tips for Using LLM Evaluation KPIs Effectively

Getting the most from evaluation practices means treating them as living tools, not static snapshots. Best practices include:

  • Define clear evaluation objectives: Set specific goals upfront so that every metric measures something meaningful.
  • Select metrics aligned with goals: Pick indicators that map directly to technical objectives and business priorities.
  • Regularly update evaluation datasets: Refresh test data to keep pace with evolving user behavior and real-world scenarios.
  • Automate scoring for consistency: Apply automated scoring tools to reduce human variability and maintain standardized evaluations.
  • Document results for reproducibility: Keep clear records so evaluations can be repeated and verified.
  • Review and iterate on metrics periodically: Continuously refine KPIs to stay current with model updates and evolving requirements.

FAQs

What are the most important metrics for LLM evaluation?

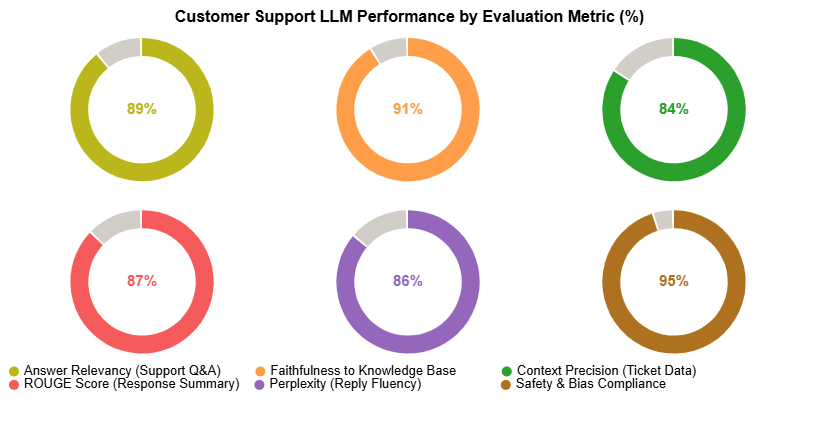
The most critical LLM evaluation metrics span answer relevancy, faithfulness, context precision and recall, perplexity, and safety measures. The appropriate combination varies by use case; customer support scenarios typically prioritize safety, while research applications place greater weight on accuracy.

How often should LLM metrics be measured?

Teams should measure during development, immediately following fine-tuning, and on a continuous basis throughout production to maintain stable, consistent performance.

Can LLM evaluation metrics detect bias in outputs?

Yes. Bias-specific evaluation approaches surface harmful or discriminatory patterns in model outputs, letting teams retrain and add safeguards before deployment.

Wrap Up

Every AI system deployed at scale carries risk, and LLM evaluation metrics are the mechanism teams use to quantify and manage that risk.

They turn anecdotal impressions into structured evidence, expose weaknesses before users encounter them, and create a feedback loop that supports smarter model decisions across development and production.

By combining a core set of proven metrics with visualization tools, organizations gain the clarity they need to act on evaluation data rather than just collect it.

The result is a model development process that is more transparent, more defensible, and more aligned with the real-world standards that users and regulators expect.

How much did you enjoy this article?

PBIAd1
Start Free Trial!
160538

Related articles

next previous
Data Analytics10 min read

Salesforce Data Export: All Options Explained

Salesforce data export gives you control over your CRM records for backup, analysis, and migration. Learn the top methods and best practices. Read on!

Data Analytics9 min read

Snowflake Data Schema: Definition, Structure, and Benefits

Snowflake data schema organizes warehouse data into normalized tables for scalable analytics. Learn how to apply it in Power BI. Read on!

Data Analytics9 min read

What are Data Products: Everything You Need to Know

What are data products? Discover how they turn raw data into business value through structured design, analytics, and smart governance. Read on!

Data Analytics8 min read

SaaS Dashboard: A Complete Walkthrough

Dashboard for SaaS shows revenue, churn, usage, and retention in one view. See metrics, examples, and build steps in Power BI. Read on!

Data Analytics7 min read

Employee Turnover Rate: Definition, Formula & Insights

Employee Turnover Rate shows where exits rise, how to measure change, and what numbers mean in Excel. See the formula, examples, and steps. Read on!

ChartExpo logo

Turn Data into Visual
Stories

CHARTEXPO

  • Home
  • Gallery
  • Videos
  • Services
  • Pricing
  • Contact us
  • FAQs
  • Privacy policy
  • Terms of Service
  • Sitemap

TOOLS

  • ChartExpo for Google Sheets
  • ChartExpo for Microsoft Excel
  • Power BI Custom Visuals by ChartExpo
  • Word Cloud

CATEGORIES

  • Bar Charts
  • Circle Graphs
  • Column Charts
  • Combo Charts
  • Comparison Charts
  • Line Graphs
  • PPC Charts
  • Sentiment Analysis Charts
  • Survey Charts

TOP CHARTS

  • Sankey Diagram
  • Likert Scale Chart
  • Comparison Bar Chart
  • Pareto Chart
  • Funnel Chart
  • Gauge Chart
  • Radar Chart
  • Radial Bar Chart
  • Sunburst Chart
  • see more
  • Scatter Plot Chart
  • CSAT Survey Bar Chart
  • CSAT Survey Chart
  • Dot Plot Chart
  • Double Bar Graph
  • Matrix Chart
  • Multi Axis Line Chart
  • Overlapping Bar Chart
  • Control Chart
  • Slope Chart
  • Clustered Bar Chart
  • Clustered Column Chart
  • Box and Whisker Plot
  • Tornado Chart
  • Waterfall Chart
  • Word Cloud
  • see less

RESOURCES

  • Blog
  • Resources
  • YouTube
SIGN UP FOR UPDATES

We wouldn't dream of spamming you or selling your info.

© 2026 ChartExpo, all rights reserved.