Categories
Spending more than planned is rarely caused by bad products or poor ideas. It happens when organizations commit to assets without knowing what those assets will truly cost across their full lifespan.
Total cost of ownership analysis was developed to close that gap, bringing every expense into view from the moment of acquisition through final decommissioning. Without this framework, financial blind spots turn routinely into budget shortfalls that could have been avoided.
This guide walks through the concepts, calculation methods, and practical steps behind this discipline, including how modern analytics platforms simplify the process and make the insights easier to act on.
Definition: Total cost of ownership analysis is a financial evaluation framework built to account for every expense involved in acquiring, operating, maintaining, and retiring an asset or solution. This approach goes well beyond sticker price, capturing the full economic weight of a decision across its entire lifecycle.
The methodology is applied broadly in IT procurement, manufacturing investment planning, logistics, and vendor evaluation. By accounting for long-term financial impact, organizations gain a grounded view of what any commitment will actually demand. TCO analysis answers the question every major purchasing decision deserves: what will this truly cost from beginning to end?
Total cost of ownership analysis delivers financial clarity beyond standard budgeting, sharpening investment decisions, vendor negotiations, and long-term planning.
Effective analysis draws a clear line between visible expenditures and the indirect or long-term costs that are so often overlooked, a discipline central to both sound business analytics and strategic cost evaluation.
While the concept is accessible, running a cost of ownership analysis that produces reliable results requires a disciplined, step-by-step approach. The process typically unfolds across these stages:
Translating a total cost of ownership analysis into actionable numbers requires a structured, repeatable sequence of steps.
Practical examples illustrate why total cost of ownership analysis delivers insights that standard price comparisons simply cannot. Solutions that look budget-friendly at purchase frequently carry substantial costs once recurring and hidden charges are included.
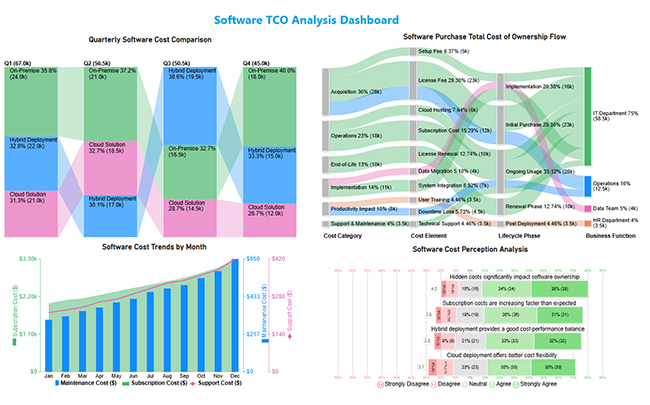
The Software TCO Dashboard maps cost distribution, spending trends, deployment model comparisons, and stakeholder feedback to support well-informed software investment decisions, to help organizations make well-informed software investment choices.
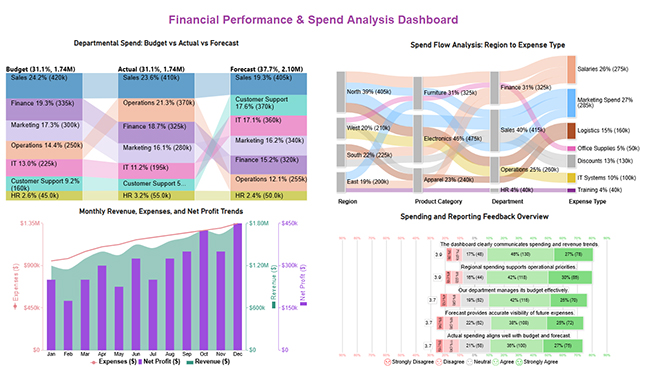
The financial performance and spend analysis dashboard tracks expenditure patterns, budget alignment, and cost control opportunities, giving decision-makers the context needed to manage spending relative to plan.
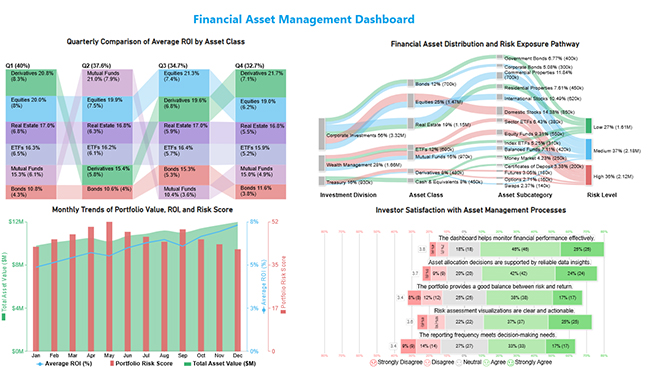
The financial asset management dashboard brings together ROI figures, portfolio allocation data, and risk exposure levels so organizations can evaluate performance and guide strategic capital allocation decisions.
Reliable total cost of ownership analysis depends on careful, disciplined preparation. Inaccurate assumptions or incomplete inputs will undermine any conclusions the analysis is meant to produce.
A structured approach follows these steps:
Total cost of ownership analysis becomes significantly more manageable when organizations work with analytical platforms built to consolidate and model complex, multi-source cost data.
Power BI’s native visuals handle many use cases well, but advanced ownership cost models often call for more expressive charting. ChartExpo addresses this by transforming dense, multi-variable data into intuitive visual narratives that make cost structures easier to analyze.
Why Use ChartExpo?

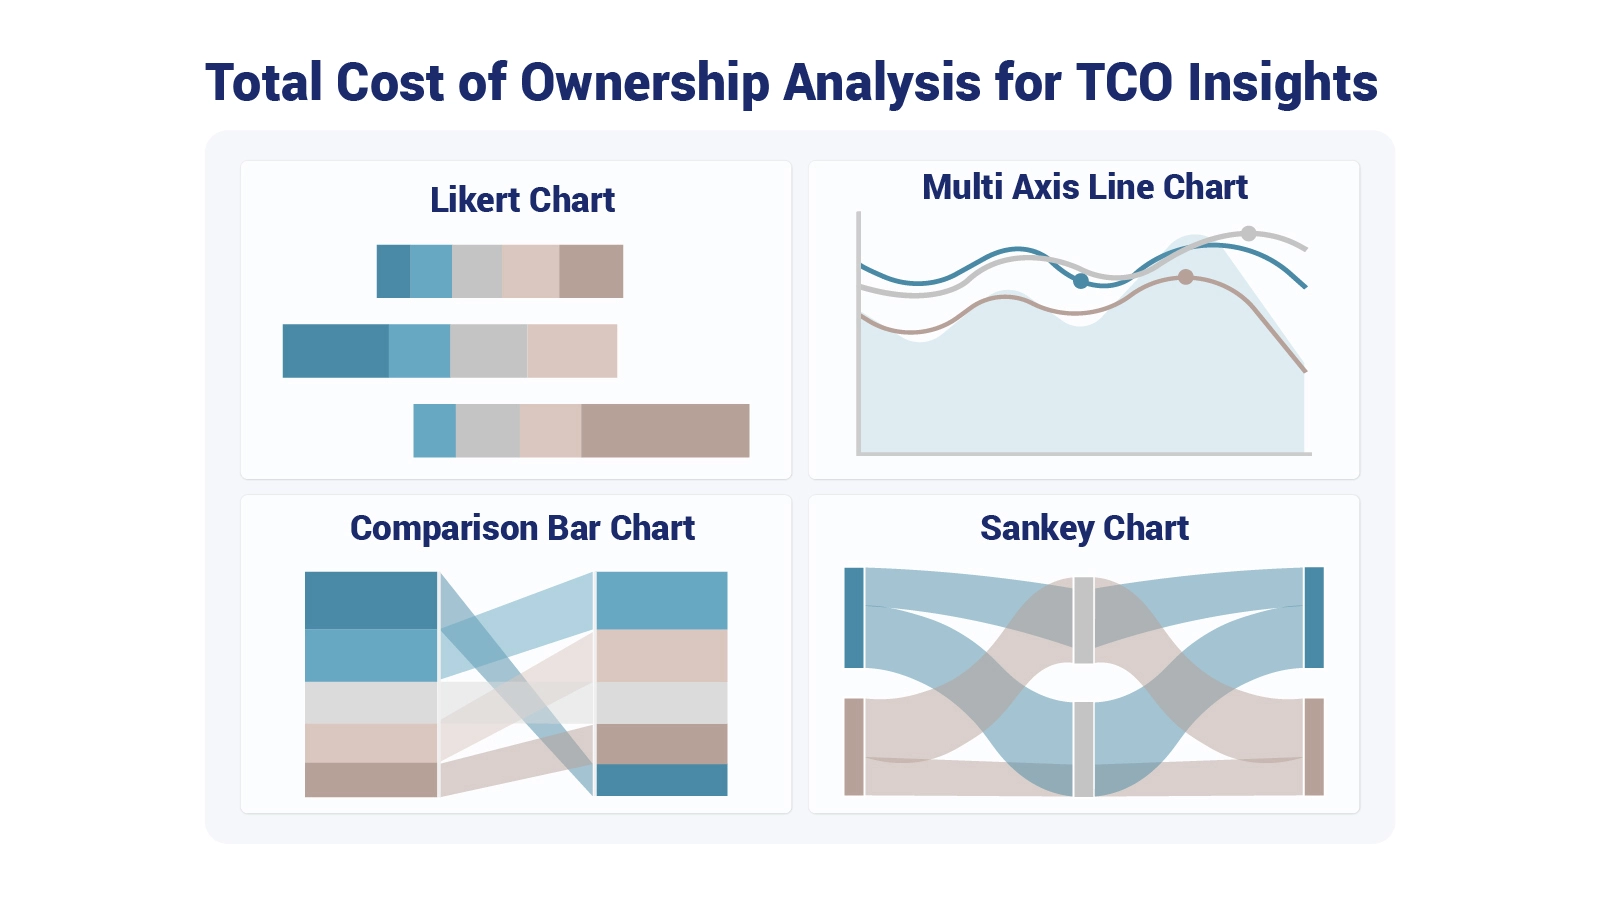
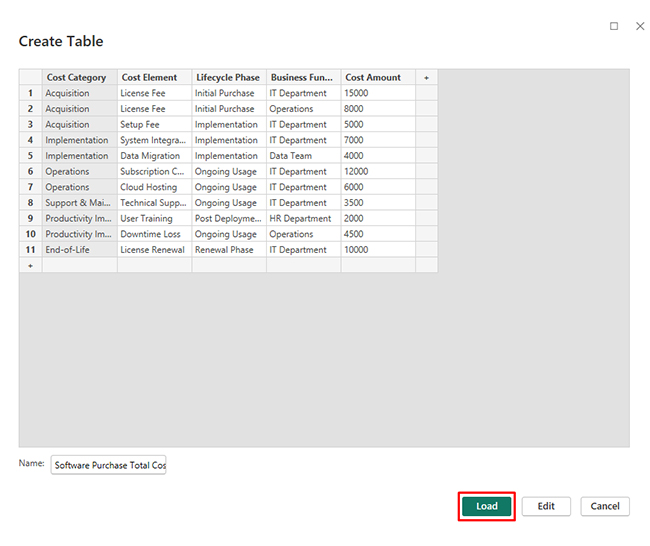
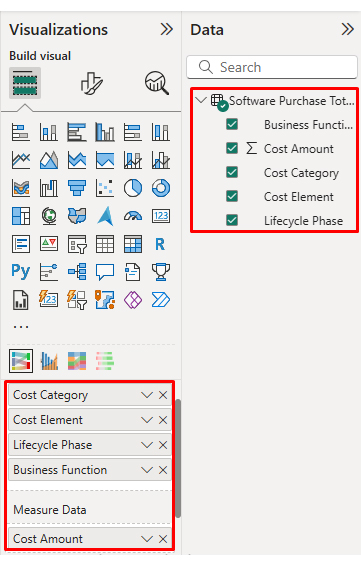
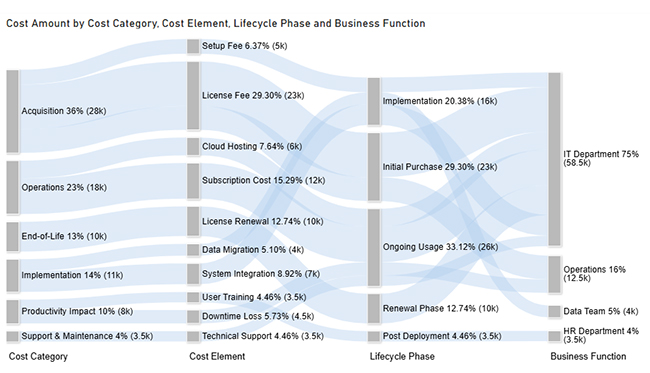
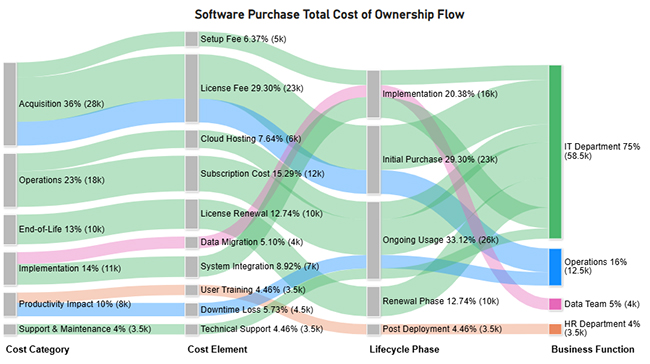
Now, consider we have the following data for a Sankey Chart.
| Cost Category | Cost Element | Lifecycle Phase | Business Function | Cost Amount |
| Acquisition | License Fee | Initial Purchase | IT Department | 15000 |
| Acquisition | License Fee | Initial Purchase | Operations | 8000 |
| Acquisition | Setup Fee | Implementation | IT Department | 5000 |
| Implementation | System Integration | Implementation | IT Department | 7000 |
| Implementation | Data Migration | Implementation | Data Team | 4000 |
| Operations | Subscription Cost | Ongoing Usage | IT Department | 12000 |
| Operations | Cloud Hosting | Ongoing Usage | IT Department | 6000 |
| Support & Maintenance | Technical Support | Ongoing Usage | IT Department | 3500 |
| Productivity Impact | User Training | Post Deployment | HR Department | 2000 |
| Productivity Impact | Downtime Loss | Ongoing Usage | Operations | 4500 |
| End-of-Life | License Renewal | Renewal Phase | IT Department | 10000 |
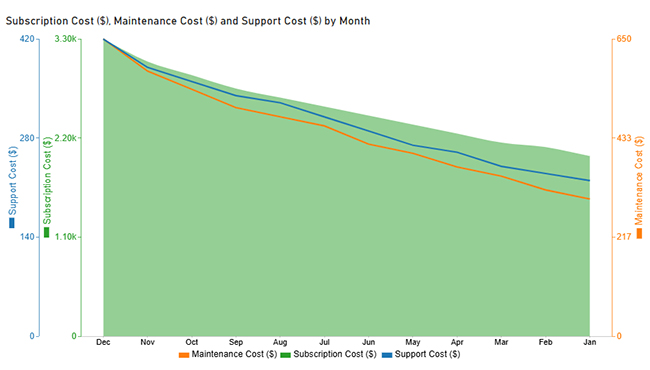
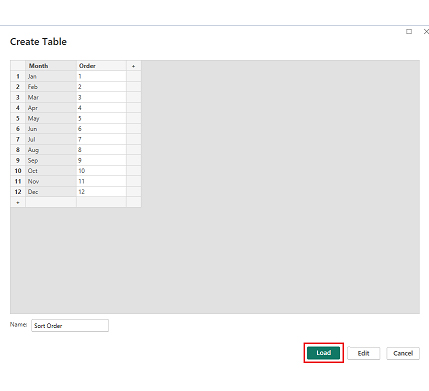
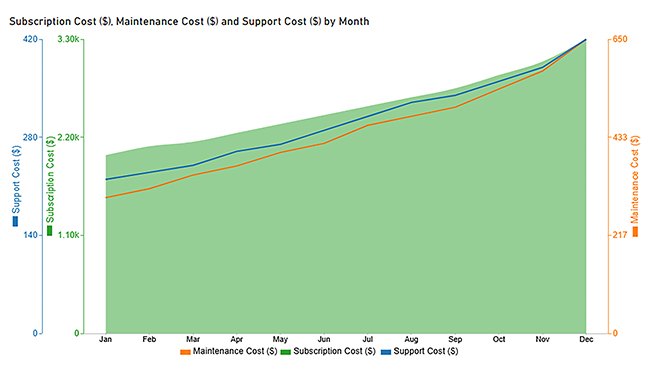
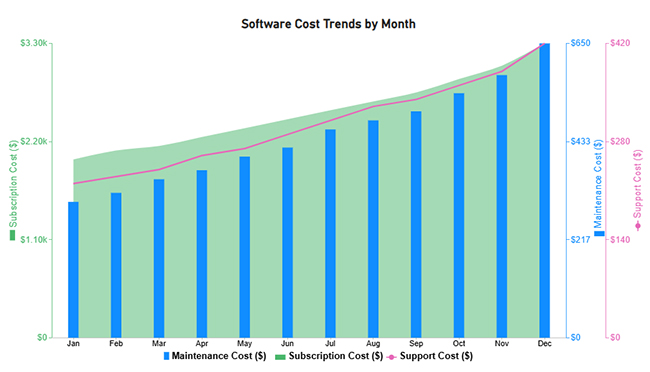
Now discuss the second chart. Consider we have the following data for the Multi Axis Line Chart.
| Month | Subscription Cost ($) | Maintenance Cost ($) | Support Cost ($) |
| Jan | 2000 | 300 | 220 |
| Feb | 2100 | 320 | 230 |
| Mar | 2150 | 350 | 240 |
| Apr | 2250 | 370 | 260 |
| May | 2350 | 400 | 270 |
| Jun | 2450 | 420 | 290 |
| Jul | 2550 | 460 | 310 |
| Aug | 2650 | 480 | 330 |
| Sep | 2750 | 500 | 340 |
| Oct | 2900 | 540 | 360 |
| Nov | 3050 | 580 | 380 |
| Dec | 3300 | 650 | 420 |
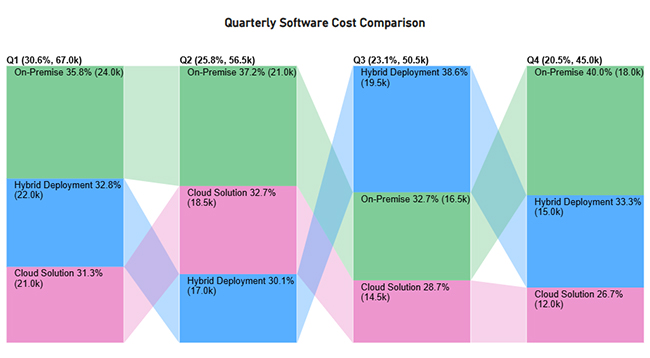
Now discuss the third chart. Consider we have the following data for a Comparison Bar Chart.
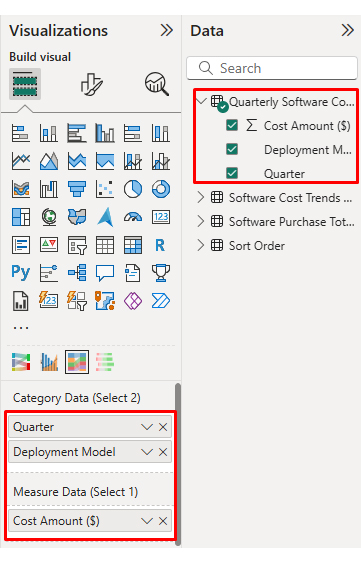
| Quarter | Deployment Model | Cost Amount ($) |
| Q1 | Cloud Solution | 21000 |
| Q1 | On-Premise | 24000 |
| Q1 | Hybrid Deployment | 22000 |
| Q2 | Cloud Solution | 18500 |
| Q2 | On-Premise | 21000 |
| Q2 | Hybrid Deployment | 17000 |
| Q3 | Cloud Solution | 14500 |
| Q3 | On-Premise | 16500 |
| Q3 | Hybrid Deployment | 19500 |
| Q4 | Cloud Solution | 12000 |
| Q4 | On-Premise | 18000 |
| Q4 | Hybrid Deployment | 15000 |
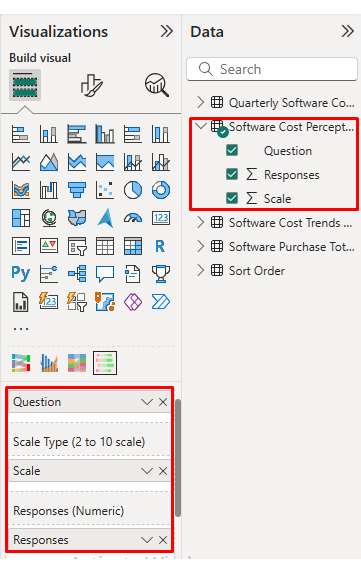
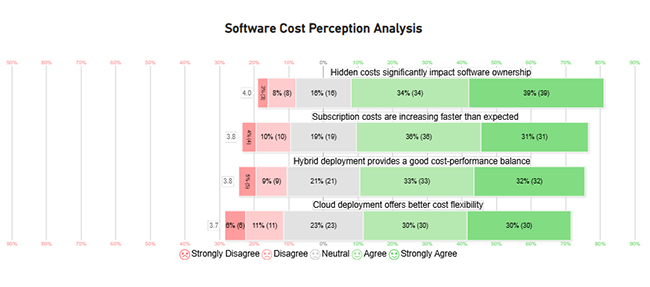
Now discuss the fourth chart. Consider we have the following data for the Likert Chart.
|
Question |
Scale |
Responses |
| Subscription costs are increasing faster than expected | 1 | 4 |
| Subscription costs are increasing faster than expected | 2 | 10 |
| Subscription costs are increasing faster than expected | 3 | 19 |
| Subscription costs are increasing faster than expected | 4 | 36 |
| Subscription costs are increasing faster than expected | 5 | 31 |
| Hidden costs significantly impact software ownership | 1 | 3 |
| Hidden costs significantly impact software ownership | 2 | 8 |
| Hidden costs significantly impact software ownership | 3 | 16 |
| Hidden costs significantly impact software ownership | 4 | 34 |
| Hidden costs significantly impact software ownership | 5 | 39 |
| Cloud deployment offers better cost flexibility | 1 | 6 |
| Cloud deployment offers better cost flexibility | 2 | 11 |
| Cloud deployment offers better cost flexibility | 3 | 23 |
| Cloud deployment offers better cost flexibility | 4 | 30 |
| Cloud deployment offers better cost flexibility | 5 | 30 |
| Hybrid deployment provides a good cost-performance balance | 1 | 5 |
| Hybrid deployment provides a good cost-performance balance | 2 | 9 |
| Hybrid deployment provides a good cost-performance balance | 3 | 21 |
| Hybrid deployment provides a good cost-performance balance | 4 | 33 |
| Hybrid deployment provides a good cost-performance balance | 5 | 32 |
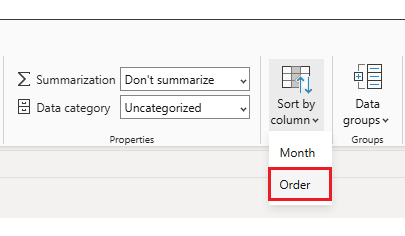
Arrange the charts efficiently and add interactivity to create a clear, engaging dashboard. After placement, the dashboard should appear as shown below.

Organizations that apply total cost of ownership analysis regularly gain measurable advantages in financial planning and day-to-day cost management.
The principles behind total cost of ownership analysis are straightforward, but disciplined execution across complex, real-world scenarios is where many organizations struggle.
No single formula covers every situation because the cost variables differ significantly across assets and industries. In most cases, the analysis aggregates acquisition, implementation, operational, maintenance, and end-of-life costs over a clearly defined evaluation window.
The most frequent errors include neglecting indirect costs, underestimating ongoing maintenance spending, building projections on overly optimistic assumptions, and applying different timeframes when comparing competing options.
A lower result indicates that one option is more cost-efficient over the evaluated period. That figure should be weighed alongside performance benchmarks, risk tolerance, and strategic alignment before any final decision is reached.
Every major business commitment carries a price that extends well beyond the first invoice. Total cost of ownership analysis provides the framework that brings the full scope of lifecycle costs into view, covering acquisition, deployment, ongoing operations, and eventual retirement, so that financial decisions rest on complete information rather than incomplete estimates.
When this evaluation approach is paired with visualization platforms that can render complex cost models as accessible, story-driven charts, decision-makers gain a tool that is as useful in a boardroom presentation as it is in a procurement analysis. Organizations that adopt this discipline invest with greater precision, manage costs with greater control, and plan with greater confidence.
How much did you enjoy this article?


Calculate accounts receivable turnover ratio to measure credit collection speed, improve cash flow, and strengthen your financial strategy. Read on!

Change Management KPIs are the key to tracking adoption, performance, and ROI during transitions. Find out which metrics matter. Read on!

Data collection methods and techniques determine the quality of every insight you act on. Explore key approaches for gathering reliable data. Read on!


