Categories
Is a real estate investment spreadsheet the tool you’ve been missing? We’ll find out.
Numbers drive decisions, and in real estate, a single percentage point can mean thousands gained or lost. Think about it. Without an investment tracking spreadsheet, you’re operating in the dark.


Spreadsheets transform raw figures into meaningful insights. They help you see patterns that are invisible in bank statements or property management reports.
With them, you can compare returns across multiple properties, project rental growth, and measure operating costs with accuracy. Investors who track carefully are the ones who scale.
Technology has shifted expectations. Tools like Google Finance in Google Sheets allow real-time market updates without endless data entry. Instead of waiting for monthly reports, you can see live price changes, stock movements, and indexes directly linked to your property portfolio. That means decisions can happen faster, with confidence grounded in data.
So why put your focus on the real estate investment spreadsheet? Because it is no longer a sidekick—it is the main driver. It shows you where you are overspending, which property delivers the highest yield, and where to direct your dollar. This spreadsheet is no longer a record-keeper. It’s the difference between surviving and outperforming in today’s investment landscape.
Let’s dive deeper.
Definition: A real estate investment spreadsheet is a digital tool for tracking numbers that matter. It records income, expenses, and property values. Investors use it to measure growth and spot weak areas. It helps with comparisons across multiple assets.
A rental property expenses spreadsheet can show hidden costs that cut into profits. The data is clear and organized. This enables faster and more confident decision-making. You can see patterns that guide long-term planning.
This is an analysis in motion. For investors, it means control. For portfolios, it means clarity.
Many investors jump into property with excitement, but without structure, profits slip away quietly. An investment property spreadsheet changes that. It gives you a clear path instead of scattered notes or random calculations. With it, every number tells a story.
So, why should you use it?
Property investing looks exciting on paper, but the real challenge is in the numbers. A spreadsheet makes those numbers simple, straightforward, and valuable. Knowing when to use one can be the difference between steady growth and hidden losses.
Use a spreadsheet when;
Numbers tell the truth about property investments, but only if you record them the right way. A simple spreadsheet can turn scattered figures into a complete picture of performance. And the best part is that tools in Google Sheets make this process fast, flexible, and easy to scale. See the examples below;
Most investors dream about growth, but few take the time to track the numbers that drive it. An investment property analysis spreadsheet makes the difference. It turns raw figures into insights you can act on. The process is simple, and once it is set up, it becomes the backbone of every decision:
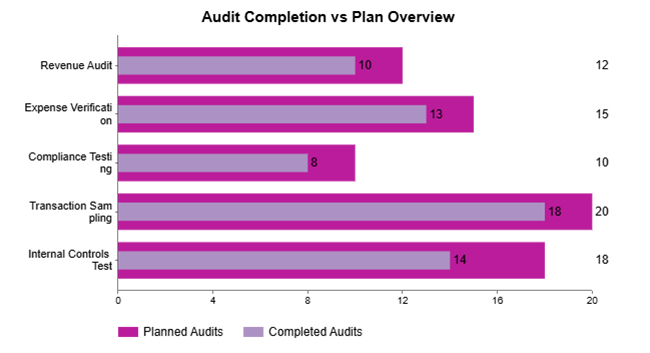
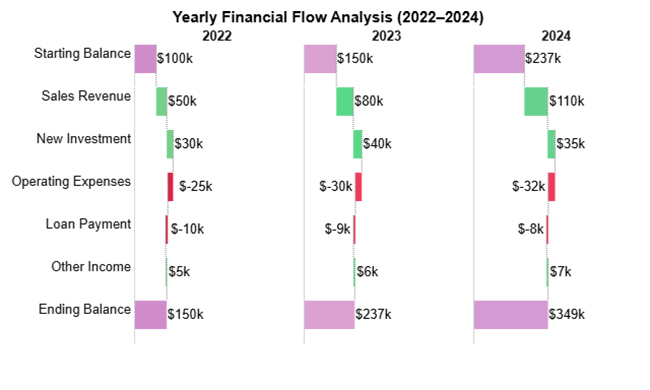
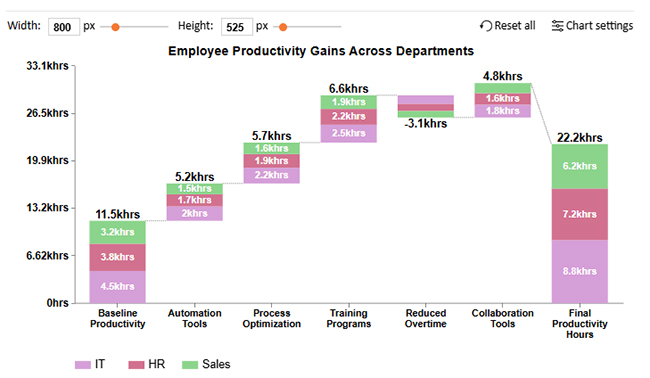
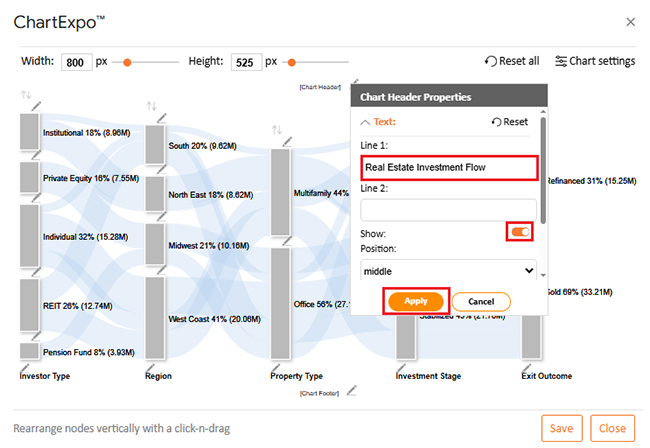
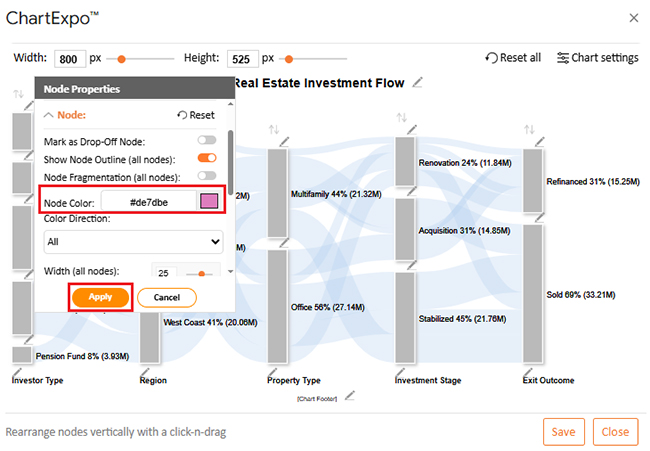
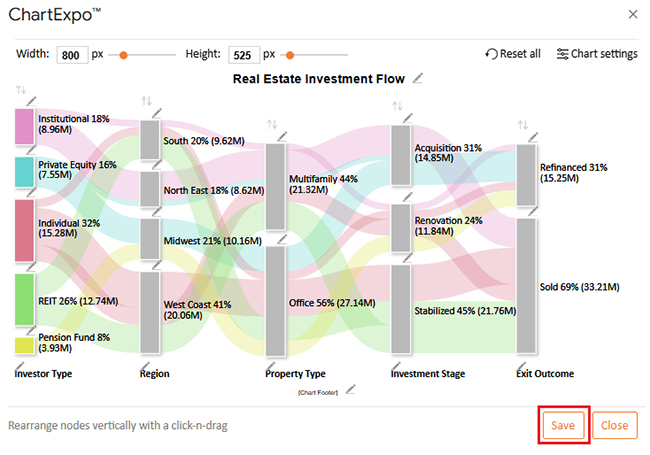
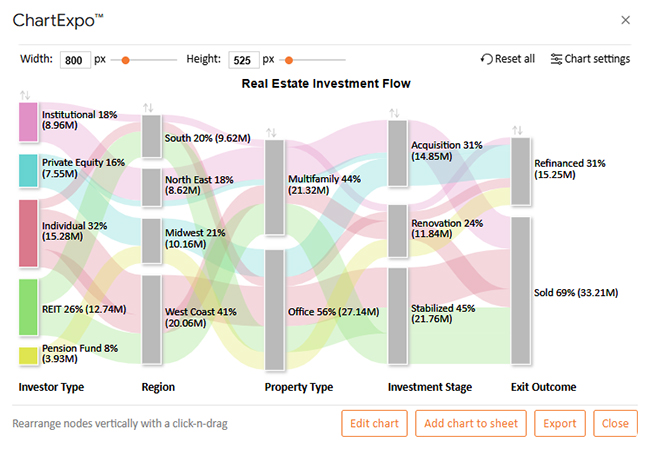
Data makes more sense when you can see it, not just read it. With ChartExpo in Google Sheets, you can turn raw data into insights in seconds. Here are ten powerful visuals that transform real estate analysis:
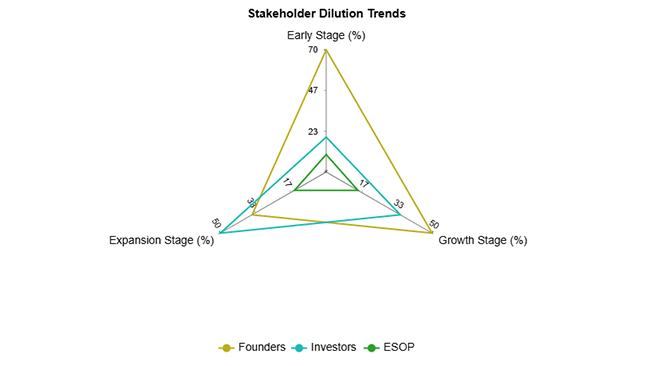
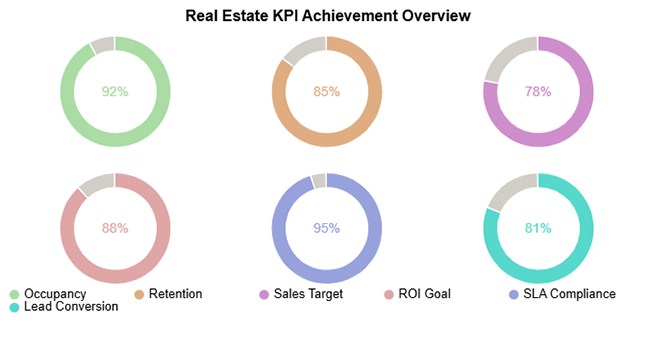
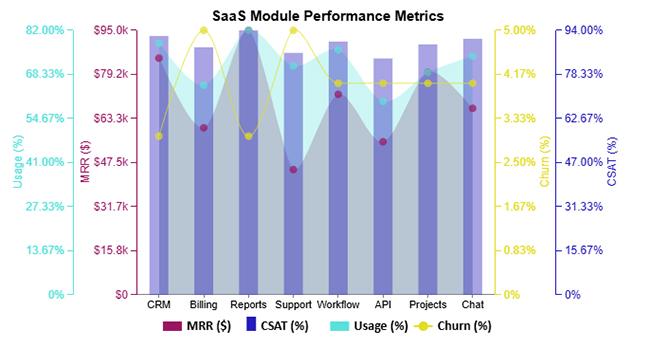
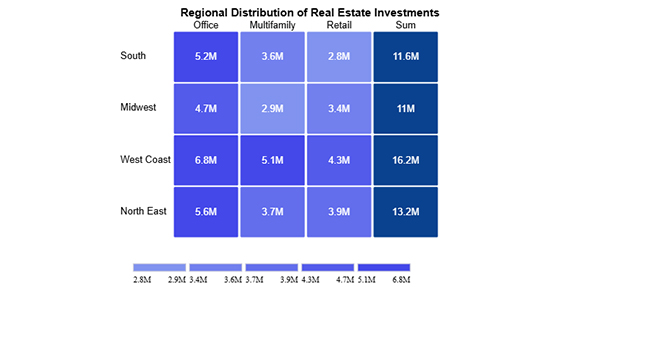
Spreadsheets never lie, but they rarely tell the whole story at first glance. A real estate investment spreadsheet is excellent for storing numbers, yet raw rows and columns can leave insights hidden. Data visualization is what transforms those numbers into decisions.
And that’s where Google Sheets shows its limits.
Why?
Basic charts work, but they lack depth for serious investment analysis. ChartExpo steps in as the game changer. It turns static data into visuals that speak. With it, patterns are clearer, ROI is sharper, and your spreadsheet finally works as hard as your investments.
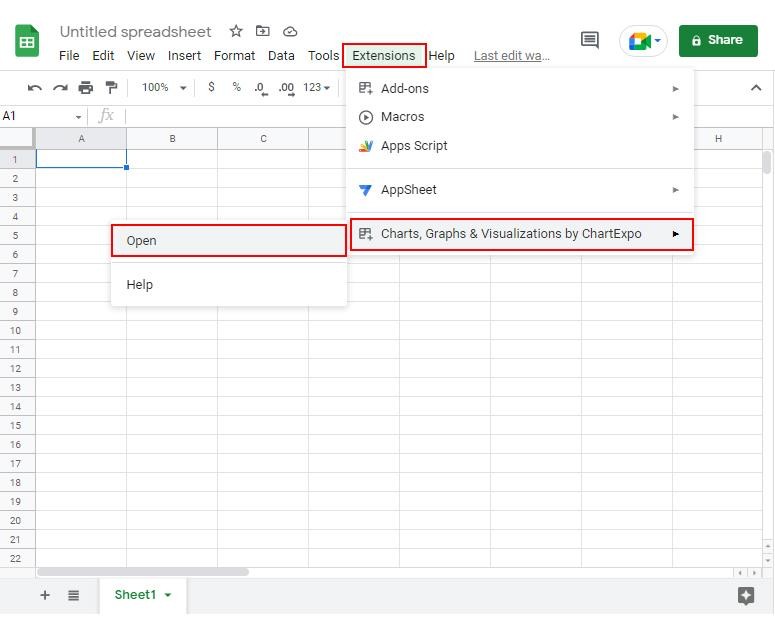
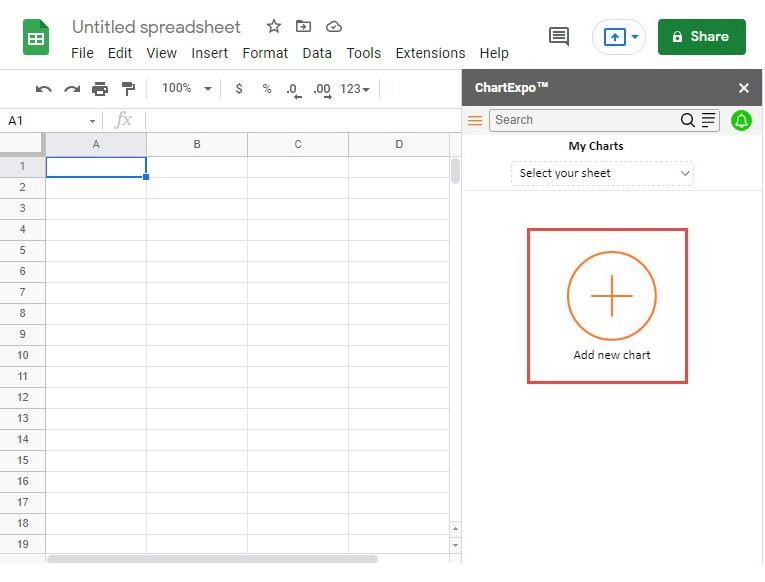
How to Install ChartExpo in Google Sheets?
ChartExpo charts are available both in Google Sheets and Microsoft Excel. Please use the following CTAs to install the tool of your choice and create beautiful visualizations in a few clicks in your favorite tool.
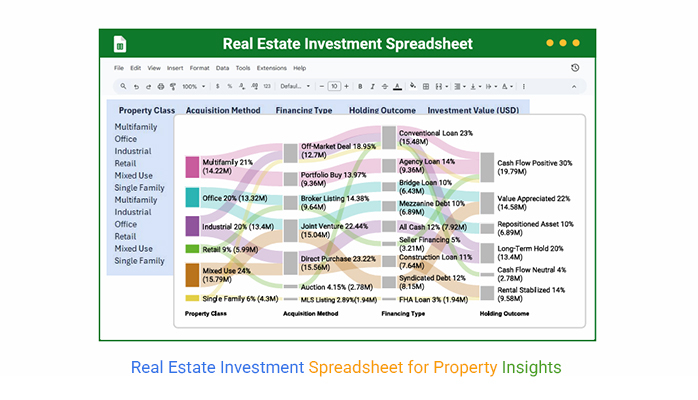
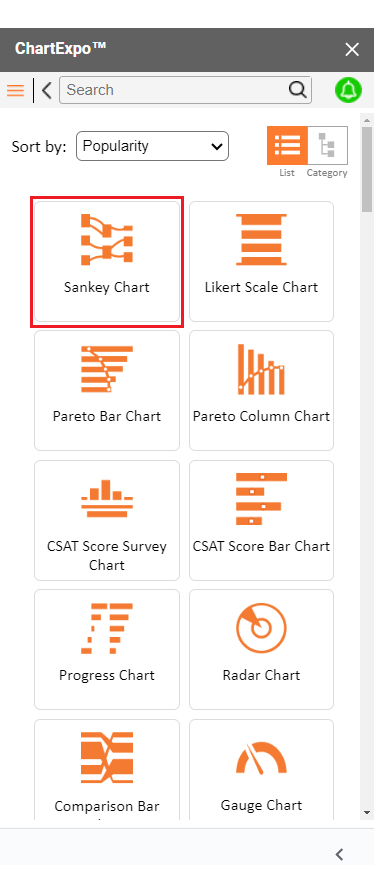
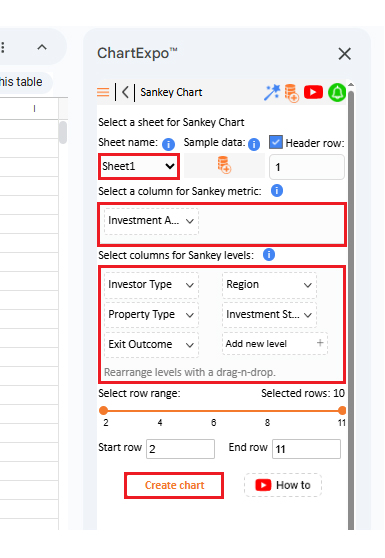
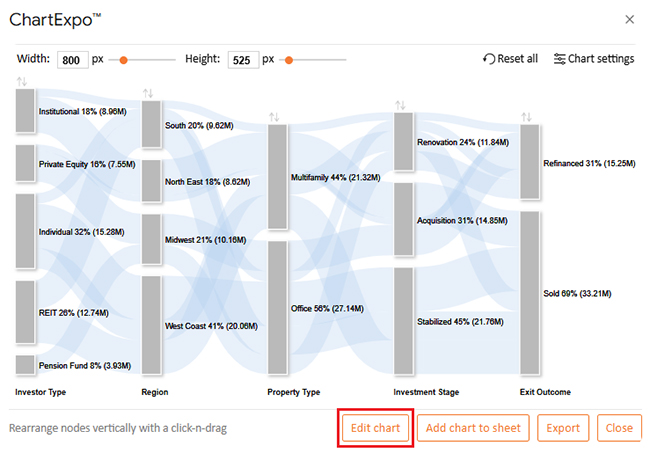
Let’s visualize a real estate investment spreadsheet in Google Sheets using ChartExpo.
|
Investor Type |
Region | Property Type | Investment Stage | Exit Outcome |
Investment Amount (USD) |
| Institutional | South | Multifamily | Renovation | Refinanced | 1,657,139 |
| Private Equity | Midwest | Office | Acquisition | Refinanced | 6,231,546 |
| Individual | West Coast | Office | Stabilized | Sold | 9,020,491 |
| Individual | West Coast | Multifamily | Renovation | Sold | 4,143,481 |
| Private Equity | North East | Multifamily | Acquisition | Refinanced | 1,320,886 |
| REIT | South | Office | Stabilized | Sold | 5,847,322 |
| Pension Fund | Midwest | Office | Renovation | Refinanced | 3,928,145 |
| Institutional | North East | Multifamily | Acquisition | Sold | 7,301,219 |
| Individual | South | Office | Renovation | Refinanced | 2,114,378 |
| REIT | West Coast | Multifamily | Stabilized | Sold | 6,893,200 |

You can dream about returns, but without data tracking, those dreams stay on paper. A real estate investment template in Google Sheets makes the process simple. It organizes income, expenses, and returns so you see the big picture at a glance. The best part is that anyone can use it; no advanced skills required.
Here is how to get started:
Spreadsheets are every investor’s silent partner. They sit quietly, but when used right, they reveal everything about your portfolio. Google Sheets is a popular choice because it’s free, flexible, and easy to share. But is it perfect? Not quite. Here are the pros and cons:
Pros:
Cons:
When used strategically, a spreadsheet becomes a decision-making engine. The goal is not just tracking but maximizing insight. Here are practical tips to help you:
The 70% rule helps investors avoid overpaying. It says you should spend no more than 70% of a property’s after-repair value. Subtract repair costs first. The rest sets your maximum purchase price.
Yes, free templates exist online. Many are available in Google Sheets. They track income, expenses, and returns. Some even include a rental property expenses spreadsheet or ROI analysis tools to simplify calculations for investors.
Real estate rewards those who plan and track with care. With a real estate investment spreadsheet, you get to see the proper health of your portfolio. It shows you where money comes in and where it leaves.
Good investing needs more than guesswork. With an ROI analysis, you can see if a property is worth holding or selling. Moreover, trends appear faster when numbers are updated on time. This is how savvy investors stay ahead.
Detailed records matter in property deals. Commercial real estate reporting depends on accurate numbers. A spreadsheet makes this process easier by organizing details clearly. You save time while reducing mistakes.
Growth also needs planning. With forecasting in Google Sheets, you can model future rent, costs, and profits. It prepares you for expansion without surprises. It gives confidence to move forward with data-backed choices.
Finally, tools should make work simple. Google Sheets CRM templates can track contacts and deals, but visuals are where the real power begins. ChartExpo fills the gap by turning data into clear charts.
So, do not hesitate. Install ChartExpo and bring your spreadsheets to life. Numbers become stories, and these stories turn into smarter investments.
How much did you enjoy this article?


SUMPRODUCT in Google Sheets handles multi-condition calculations without extra columns. Master its syntax, uses, and errors. Read on!

An annual budget template in Google Sheets organizes your yearly finances, tracks every dollar, and reveals spending patterns. Read on!

Learn the best graph to show profit and loss with practical examples and use cases. Discover how to visualize your business data, track trends, and make smarter financial decisions.


