• Home
  • Tools dropdown img
    • Spreadsheet Charts

      • ChartExpo for Google Sheets
      • ChartExpo for Microsoft Excel
    • Power BI Charts

      • Power BI Custom Visuals by ChartExpo
    • Word Cloud

  • Charts dropdown img
    • Chart Category

      • Bar Charts
      • Circle Graphs
      • Column Charts
      • Combo Charts
      • Comparison Charts
      • Line Graphs
      • PPC Charts
      • Sentiment Analysis Charts
      • Survey Charts
    • Chart Type

      • Box and Whisker Plot
      • Clustered Bar Chart
      • Clustered Column Chart
      • Comparison Bar Chart
      • Control Chart
      • CSAT Survey Bar Chart
      • CSAT Survey Chart
      • Dot Plot Chart
      • Double Bar Graph
      • Funnel Chart
      • Gauge Chart
      • Likert Scale Chart
      • Matrix Chart
      • Multi Axis Line Chart
      • Overlapping Bar Chart
      • Pareto Chart
      • Radar Chart
      • Radial Bar Chart
      • Sankey Diagram
      • Scatter Plot Chart
      • Slope Chart
      • Sunburst Chart
      • Tornado Chart
      • Waterfall Chart
      • Word Cloud
    • Google Sheets
      Microsoft Excel
  • Services
  • Pricing
  • Contact us
  • Blog
  • Support dropdown img
      • Gallery
      • Videos
      • Contact us
      • FAQs
      • Resources
    • Please feel free to contact us

      atsupport@chartexpo.com

Categories
All Data Visualizations Data Analytics Surveys
Add-ons/
  • Google Sheets
  • Microsoft Excel
  • Power BI
All Data Visualizations Data Analytics Surveys
Add-ons
  • Google Sheets
  • Microsoft Excel
  • Power BI

We use cookies

This website uses cookies to provide better user experience and user's session management.
By continuing visiting this website you consent the use of these cookies.

Ok

ChartExpo Survey


Home > Blog > Microsoft Excel

Rental Property Expenses Spreadsheet for Better Tracking

Rental property expenses spreadsheet—Why does it matter? Keeping track of rental property expenses can feel overwhelming. Rent, maintenance, insurance, and repairs add up quickly, and missing an expense can ruin your budget. A rental property expenses spreadsheet organizes costs and provides clear financial insights with cool Excel charts and graphs.

Rental Property Expenses Spreadsheet

Rental properties generate income. However, they also come with ongoing costs. Property taxes, insurance, and utilities add even more to the total. Without a system to track these expenses, profits can quickly shrink. This expense report template in Excel helps structure and categorize these costs efficiently.

Small mistakes can be costly. A forgotten repair bill or a miscalculated tax deduction could mean financial trouble. Accurate records make the tax season smoother and help maximize deductions. Therefore, using a rental property expenses spreadsheet simplifies expense tracking, reducing stress.

Sound financial management keeps rental investments profitable. Knowing exactly where the money goes helps landlords cut unnecessary costs. Combining the rental property expenses spreadsheet with profit and loss templates in Excel provides a clear breakdown, ensuring better financial decisions.

A simple spreadsheet can mean the difference between profit and loss.

Let’s dive in.

Table of Contents:

  1. What is a Rental Property Expenses Spreadsheet?
  2. Why Use a Rental Property Spreadsheet?
  3. How to Create a Rental Property Expenses Spreadsheet?
  4. How to Use a Spreadsheet for Rental Property Expense Analysis?
  5. How to Use the Rental Income and Expenses Spreadsheet?
  6. Why Do Real Estate Investors Use Rental Expense Spreadsheets?
  7. FAQs
  8. Wrap Up

What is a Rental Property Expenses Spreadsheet?

Definition: A rental property expenses spreadsheet tracks income and costs for rental properties. It helps landlords manage expenses and ensures accurate records. Typical expenses include maintenance, insurance, property taxes, and utilities.

Keeping everything organized prevents financial mistakes and missed deductions. Moreover, integrating online forms to Excel can streamline data entry, reducing manual work and errors.

A well-structured spreadsheet simplifies budgeting and tax filing. It provides a clear overview of cash flow, helping landlords make smart financial decisions.

Profits can quickly disappear without proper tracking. A rental property expenses spreadsheet improves financial management and keeps rental investments on track.

Why Use a Rental Property Spreadsheet?

Managing rental property finances can get messy. Bills pile up, receipts go missing, and expenses slip through the cracks. A rental property spreadsheet brings order to the chaos. Combining it with the analysis toolpak in Excel helps quickly analyze trends and track expenses.

It keeps everything in one place, making financial tracking simple and stress-free.

How?

  1. Organized financial tracking: Rental income and expenses change constantly. A spreadsheet keeps a detailed record, ensuring landlords have an accurate financial overview.
  2. Tax preparation: Tracking deductions can lead to costly errors. A spreadsheet organizes tax-deductible expenses, making filing taxes more manageable and reducing the risk of audits.
  3. Expense management: Without proper tracking, small costs add up fast. A spreadsheet highlights spending patterns, helping landlords cut unnecessary expenses and improve cash flow.
  4. Investment planning: Savvy investors make decisions based on data. A spreadsheet provides insights into profits, helping landlords decide when to expand or adjust their strategy.
  5. Record keeping: Receipts and invoices are easily lost. A spreadsheet stores all finances in one place, and business graphs simplify audits and reviews.
  6. Time-saving: Manual calculations take up valuable time. A spreadsheet automates the process, allowing landlords to focus on growing their investments.

How to Create a Rental Property Expenses Spreadsheet?

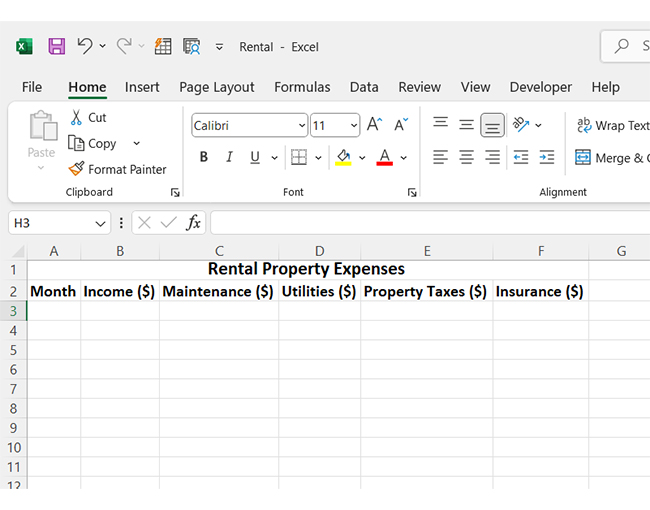
Managing rental expenses shouldn’t be a guess. A spreadsheet simplifies tracking, and Excel data to graph turns numbers into clear insights. Here’s how to set up one in Excel.

  • Open Excel and set up your dimensions: Open a new Excel sheet. Create columns for key expense categories such as rent income, maintenance, property taxes, insurance, utilities, and repairs.
Rental Property Expenses Spreadsheet
  • Enter your expense values: Add actual expense amounts under each column. Update the spreadsheet regularly to keep an accurate financial record.
Rental Property Expenses Spreadsheet

How to Use a Spreadsheet for Rental Property Expense Analysis?

How do landlords keep track of all those expenses without losing their minds? A rental property expenses spreadsheet is the answer. It organizes costs and helps landlords stay on top of their finances.

However, while Excel is excellent for number crunching, it falls short in data visualization. Charts in Excel can be clunky and hard to interpret.
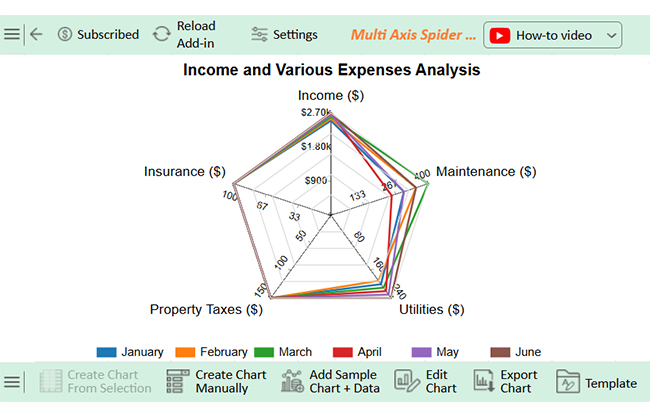
That’s where ChartExpo Comes into play. This beast of data visualization tools transforms your spreadsheet into clear, insightful visuals, making financial analysis a breeze.

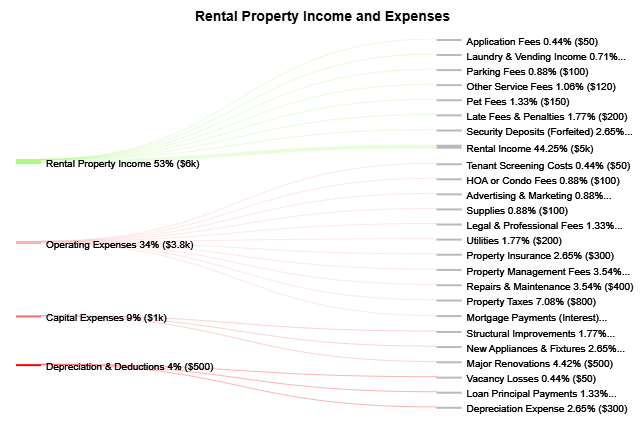
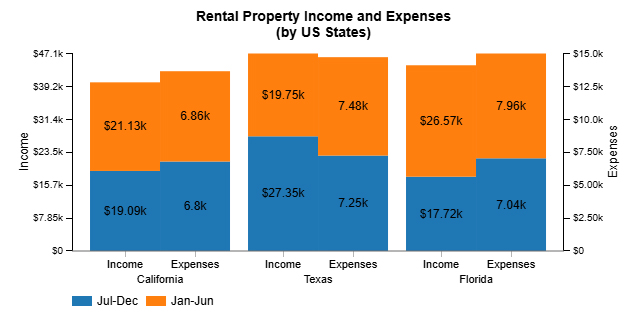
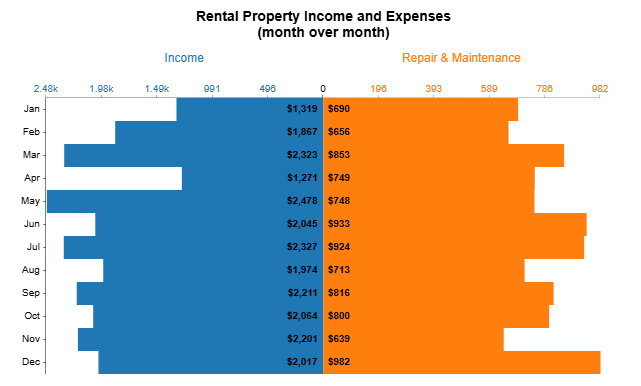
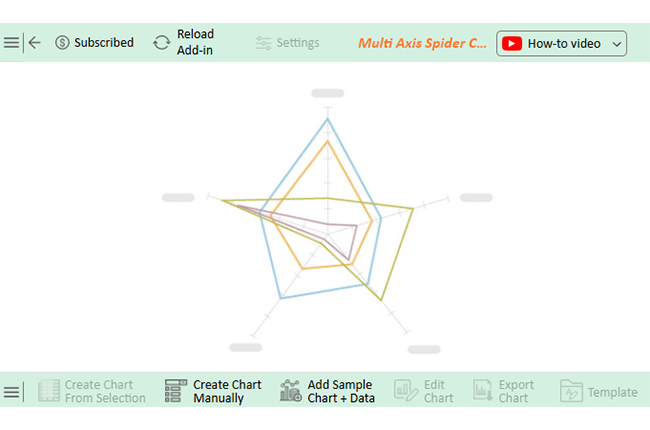
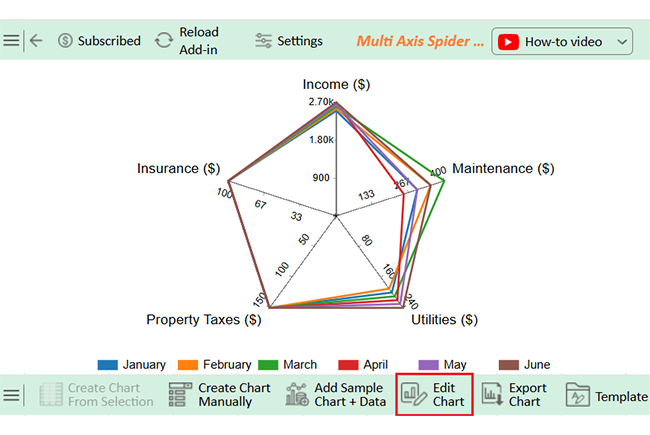
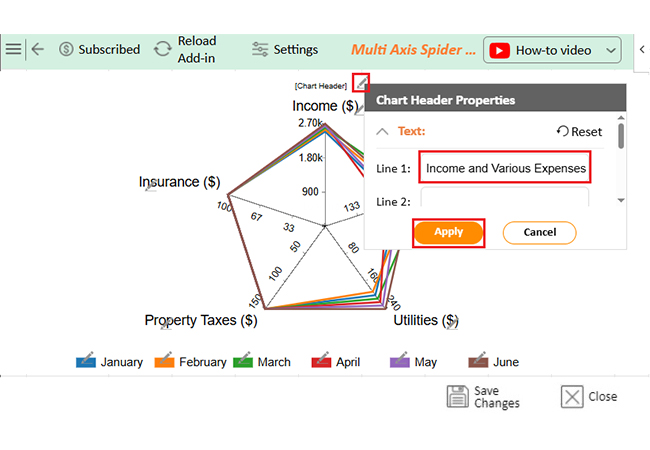
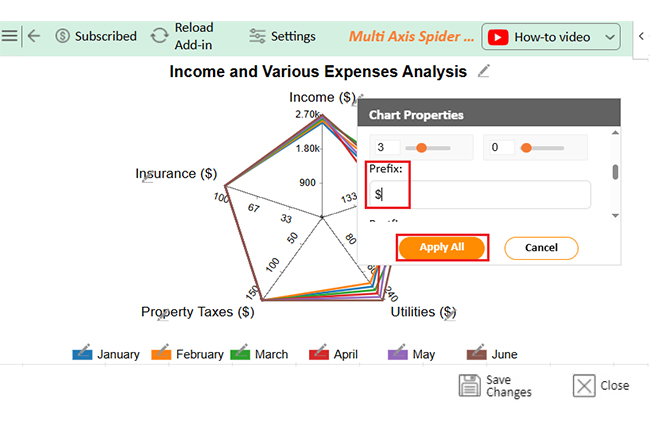
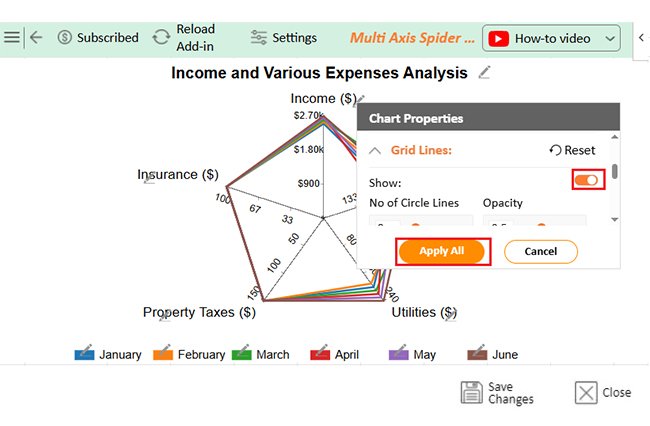
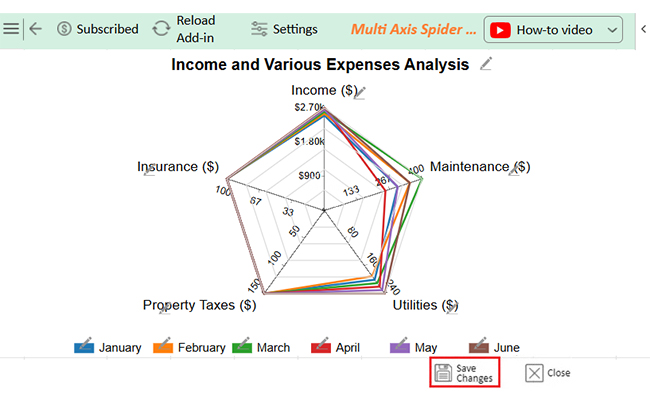
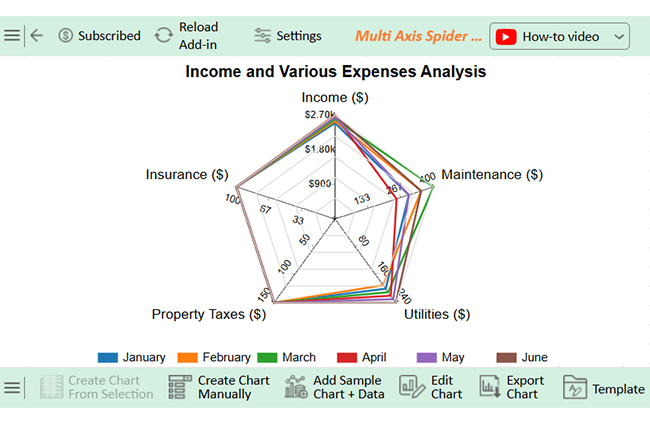
The charts below were created in Excel using ChartExpo:

Multi-Axis Spider Chart

Rental Property Expenses Spreadsheet

Sankey Chart

Rental Property Expenses Spreadsheet

Multi Series Line Chart

Rental Property Expenses Spreadsheet

Clustered Stacked Bar Chart

Rental Property Expenses Spreadsheet

Double Bar Graph

Rental Property Expenses Spreadsheet

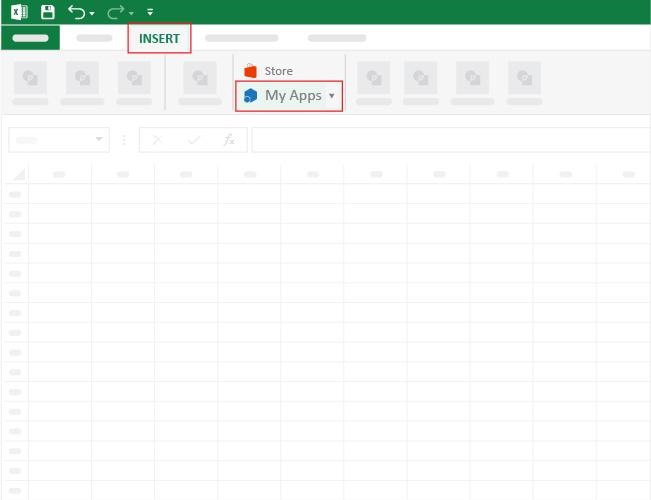
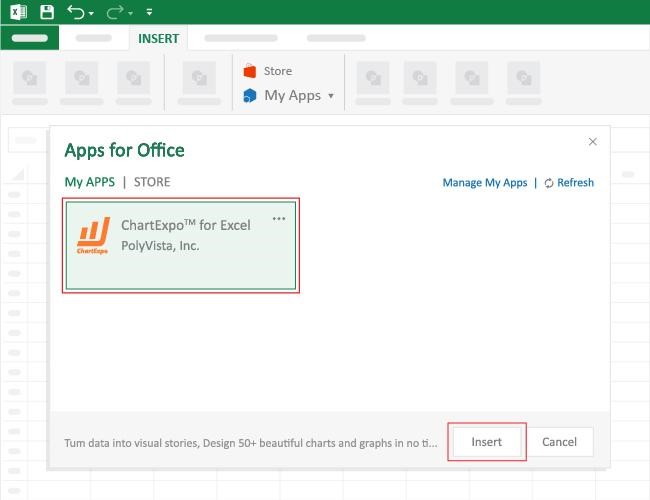
How to Install ChartExpo in Excel?

  1. Open your Excel application.
  2. Open the worksheet and click the “Insert” menu.
  3. You’ll see the “My Apps” option.
  4. In the Office Add-ins window, click “Store” and search for ChartExpo on my Apps Store.
  5. Click the “Add” button to install ChartExpo in your Excel.

ChartExpo charts are available both in Google Sheets and Microsoft Excel. Please use the following CTAs to install the tool of your choice and create beautiful visualizations with a few clicks in your favorite tool.

Example

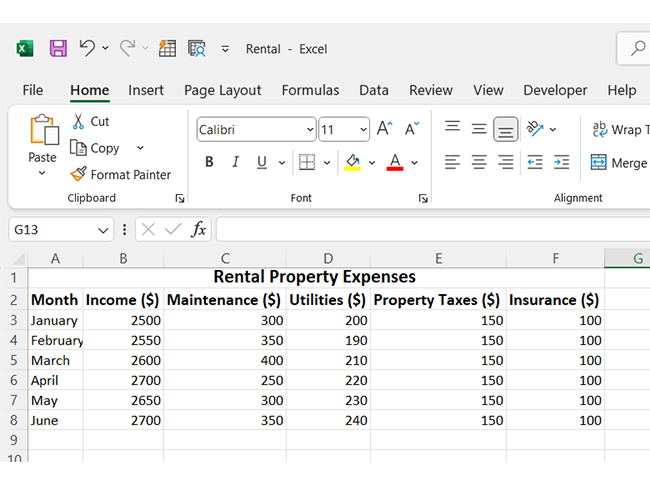
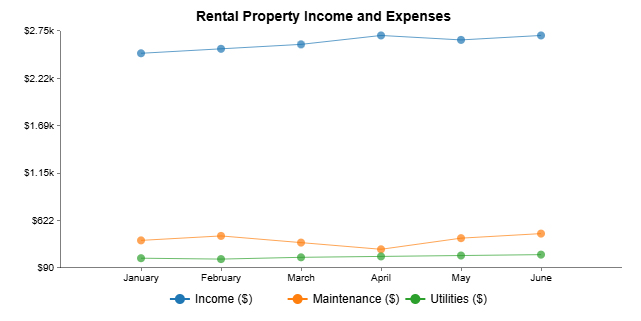
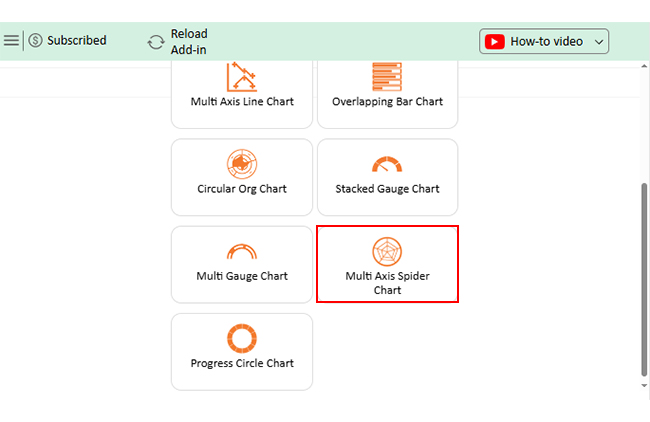
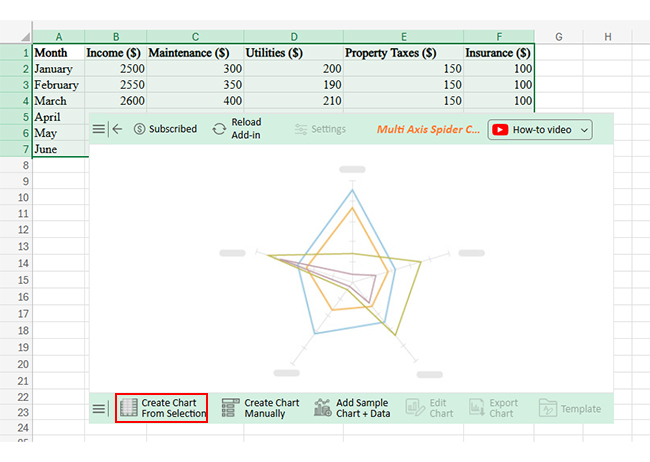
Let’s analyze this sample data in Excel using Excel Charts from ChartExpo.

Month Income ($) Maintenance ($) Utilities ($) Property Taxes ($) Insurance ($)
January 2500 300 200 150 100
February 2550 350 190 150 100
March 2600 400 210 150 100
April 2700 250 220 150 100
May 2650 300 230 150 100
June 2700 350 240 150 100
  • To get started with ChartExpo, install ChartExpo in Excel.
  • Now Click on My Apps from the INSERT menu.
Rental Property Expenses Spreadsheet
  • Choose ChartExpo from My Apps, then click Insert.
Rental Property Expenses Spreadsheet
  • Once it loads, scroll through the charts list to locate and choose the “Multi Axis Spider Chart”.
Rental Property Expenses Spreadsheet
  • After clicking on the chart, you will see the Multi Axis Spider Chart on the screen.
Rental Property Expenses Spreadsheet
  • Click the “Create Chart From Selection” button after selecting the data from the sheet, as shown.
Rental Property Expenses Spreadsheet
  • ChartExpo will generate the visualization below for you.
Rental Property Expenses Spreadsheet
  • If you want to add anything to the chart, click the Edit Chart button:
  • Click the pencil icon next to the Chart Header to change the title.
  • It will open the properties dialog. Under the Text section, you can add a heading in Line 1 and enable Show.
  • Give the appropriate title of your chart and click the Apply button.
Rental Property Expenses Spreadsheet
  • Add the dollar sign with all values as follows.
Rental Property Expenses Spreadsheet
  • You can enable the Grid Lines as follows:
Rental Property Expenses Spreadsheet
  • Click the “Save Changes” button to persist the changes made to the chart.
Rental Property Expenses Spreadsheet
  • Your final Multi Axis Spider Chart will look like the one below.
Rental Property Expenses Spreadsheet

Insights

  • There was a steady income growth from January to June.
  • Expenses for maintenance and utilities fluctuated, peaking in June.
  • There were stable property taxes and insurance, indicating controlled liabilities.
  • The rising maintenance costs may affect future savings.

How to Use the Rental Income and Expenses Spreadsheet?

Managing rental finances doesn’t have to be a headache. With the right system and self-service analytics, tracking income and expenses is easy. Here’s how to make the most of your rental spreadsheet:

  1. Set up categories: Create clear categories for income (rent, late fees) and expenses (repairs, utilities, property taxes). This will make tracking easier and help you see precisely how your money is spent.
  2. Enter income and expenses regularly: Updating your spreadsheet as transactions happen prevents last-minute scrambling. Consistency ensures accurate records and saves you time during the tax season.
  3. Use formulas for automatic calculations: Let your spreadsheet do the math by setting up formulas for total income, expenses, and profits. This reduces errors and gives you an instant snapshot of your finances.
  4. Track cash flow: Monitoring cash flow shows if you’re making a profit or losing money. Data visualizations help clarify trends and ensure enough funds for upcoming expenses.
  5. Review periodically: Check your spreadsheet weekly or monthly to spot trends, catch mistakes, and adjust your budget. Regular reviews help you stay in control and make smarter financial decisions.

Why Do Real Estate Investors Use Rental Expense Spreadsheets?

Smart investors don’t guess—they track. A well-managed spreadsheet keeps finances clear and decisions sharp. Moreover, with competitive analysis, investors can compare their performance to others in the market. This insight helps with informed, strategic choices.

Here’s why it’s a must-have:

  1. Full financial visibility: A spreadsheet provides an exact record of your income and expenses. You can quickly assess your financial health with everything in one place.
  2. Smarter expense & tax management: Tracking expenses helps cut unnecessary costs and boost profits. Additionally, detailed records make tax deductions easy and stress-free.
  3. Maximize ROI & cash flow: A spreadsheet allows you to determine whether your rental is profitable. Understanding ROI ensures smarter investment decisions and long-term success.
  4. Better budgeting and planning: Planning for repairs, vacancies, and upgrades prevents surprises. Using spreadsheets for rental property analysis helps make smarter budget decisions and keeps your rental business running smoothly.
  5. Save time & stay organized: No more lost receipts or last-minute scrambling at tax time. A rental property Excel spreadsheet will keep everything structured, making financial management effortless.

FAQs

How to make a rent Spreadsheet?

  1. Create columns for date, tenant name, rent amount, due date, payment status, and notes.
  2. Use Excel or Google Sheets for easy access.
  3. Apply formulas to calculate totals automatically.
  4. Use conditional formatting to highlight overdue payments.
  5. Update regularly to track rent efficiently.

How do I create a property Spreadsheet?

  1. Create columns for property name, location, purchase price, rent, expenses, and profit.
  2. Use Excel or Google Sheets for organization.
  3. Apply formulas for automatic calculations.
  4. Use filters to sort data quickly.
  5. Update regularly for accuracy.

Wrap Up

A rental property expenses spreadsheet is a powerful tool for landlords. It keeps financial records organized and ensures accurate tracking. Without it, managing rental expenses can become chaotic. A progress bar in Excel helps track expense updates, ensuring nothing gets overlooked.

Tracking expenses helps landlords understand their cash flow. It highlights where money is going and where to cut costs. Proper records also prevent financial surprises. Advanced Excel charts provide more profound insights by visually comparing income and expenses over time.

A detailed spreadsheet makes the tax season easier. It ensures all deductible expenses are accounted for, helping maximize tax savings and reduce errors. Cross-tabulation in Excel allows landlords to categorize and analyze financial data efficiently.

Financial planning improves with clear records. Landlords can analyze past expenses and make smarter investment decisions. This leads to better budgeting and higher profits.

A spreadsheet saves time and effort. Instead of sorting through receipts, landlords have all data in one place. It makes financial management simple and stress-free.

Managing rental properties requires careful expense tracking. A well-maintained rental property expenses spreadsheet ensures financial stability. It will help you stay organized, avoid costly mistakes, and grow your investments.

Do not hesitate.

Install ChartExpo to enhance your rental property expenses data visualization and make better decisions.

How much did you enjoy this article?

ExcelAd2
Start Free Trial!
149287

Related articles

next previous
Microsoft Excel13 min read

Excel for Teachers for Insightful Preparation

Excel for teachers simplifies grading, tracks attendance, and organizes data. Find its key features, expert tips, and how ChartExpo enhances data visualization.

Microsoft Excel14 min read

How to Make a Cash Flow Diagram in Excel?

Learn how to make a Cash Flow Diagram in Excel. It will help you learn to visualize and analyze inflows and outflows of your business cash flow.

Microsoft Excel11 min read

Succession Planning Template for Long-Term Success

Succession Planning Templates help businesses prepare for leadership changes. Learn to create, analyze, and use them for seamless transitions and growth.

Microsoft Excel10 min read

Grant Tracking Spreadsheet: Insights Made Easy

A Grant Tracker Spreadsheet helps track funding, deadlines, and expenses in Excel. Learn to use grant tracking templates, analyze data, and stay organized.

Microsoft Excel10 min read

What is Excel Software Used for: A Complete Guide

What is Excel software used for? It organizes, analyzes, and manages data. Explore its workplace applications, benefits, and top tips for efficiency and more.

ChartExpo logo

Turn Data into Visual
Stories

CHARTEXPO

  • Home
  • Gallery
  • Videos
  • Services
  • Pricing
  • Contact us
  • FAQs
  • Privacy policy
  • Terms of Service
  • Sitemap

TOOLS

  • ChartExpo for Google Sheets
  • ChartExpo for Microsoft Excel
  • Power BI Custom Visuals by ChartExpo
  • Word Cloud

CATEGORIES

  • Bar Charts
  • Circle Graphs
  • Column Charts
  • Combo Charts
  • Comparison Charts
  • Line Graphs
  • PPC Charts
  • Sentiment Analysis Charts
  • Survey Charts

TOP CHARTS

  • Sankey Diagram
  • Likert Scale Chart
  • Comparison Bar Chart
  • Pareto Chart
  • Funnel Chart
  • Gauge Chart
  • Radar Chart
  • Radial Bar Chart
  • Sunburst Chart
  • see more
  • Scatter Plot Chart
  • CSAT Survey Bar Chart
  • CSAT Survey Chart
  • Dot Plot Chart
  • Double Bar Graph
  • Matrix Chart
  • Multi Axis Line Chart
  • Overlapping Bar Chart
  • Control Chart
  • Slope Chart
  • Clustered Bar Chart
  • Clustered Column Chart
  • Box and Whisker Plot
  • Tornado Chart
  • Waterfall Chart
  • Word Cloud
  • see less

RESOURCES

  • Blog
  • Resources
  • YouTube
SIGN UP FOR UPDATES

We wouldn't dream of spamming you or selling your info.

© 2025 ChartExpo, all rights reserved.