• Home
  • Tools dropdown img
    • Spreadsheet Charts

      • ChartExpo for Google Sheets
      • ChartExpo for Microsoft Excel
    • Power BI Charts

      • Power BI Custom Visuals by ChartExpo
    • Word Cloud

  • Charts dropdown img
    • Chart Category

      • Bar Charts
      • Circle Graphs
      • Column Charts
      • Combo Charts
      • Comparison Charts
      • Line Graphs
      • PPC Charts
      • Sentiment Analysis Charts
      • Survey Charts
    • Chart Type

      • Box and Whisker Plot
      • Clustered Bar Chart
      • Clustered Column Chart
      • Comparison Bar Chart
      • Control Chart
      • CSAT Survey Bar Chart
      • CSAT Survey Chart
      • Dot Plot Chart
      • Double Bar Graph
      • Funnel Chart
      • Gauge Chart
      • Likert Scale Chart
      • Matrix Chart
      • Multi Axis Line Chart
      • Overlapping Bar Chart
      • Pareto Chart
      • Radar Chart
      • Radial Bar Chart
      • Sankey Diagram
      • Scatter Plot Chart
      • Slope Chart
      • Sunburst Chart
      • Tornado Chart
      • Waterfall Chart
      • Word Cloud
    • Google Sheets
      Microsoft Excel
  • Services
  • Pricing
  • Contact us
  • Blog
  • Support dropdown img
      • Gallery
      • Videos
      • Contact us
      • FAQs
      • Resources
    • Please feel free to contact us

      atsupport@chartexpo.com

Categories
All Data Visualizations Data Analytics Surveys
Add-ons/
  • Google Sheets
  • Microsoft Excel
  • Power BI
All Data Visualizations Data Analytics Surveys
Add-ons
  • Google Sheets
  • Microsoft Excel
  • Power BI

We use cookies

This website uses cookies to provide better user experience and user's session management.
By continuing visiting this website you consent the use of these cookies.

Ok

ChartExpo Survey


Home > Blog > Google Sheets

Google Sheets Automation: Practical Use Cases

Google Sheets automation—have you ever wondered if your spreadsheets could do more while you do less?

Google Sheets Automation

Over 2 billion people now use Google Workspace tools, and spreadsheets are a massive part of that. Yet many people still spend hours copying data, formatting cells, and creating the same charts over and over again. That’s time you never get back.

Think about it: No more copying CSV files into spreadsheets. IMPORTDATA in Google Sheets can pull that information in seconds, straight from a URL. That’s real-time data, constantly updated. Need to analyze regional sales across teams? Use Google Sheets Slicers to instantly filter dashboards without needing to touch formulas.

Google Sheets automation isn’t only for coders or tech experts. Anyone can use it. With simple tools, even beginners can automate repetitive jobs.

Automation also connects your sheets to the outside world. Want stock prices or currency rates? Google Finance in Google Sheets brings that data straight into your file, live and accurate.

If your spreadsheets feel slow and clunky, this isn’t about making them fancy. It’s about making them smart. Smarter spreadsheets lead to faster decisions, fewer mistakes, and increased opportunities for growth.

Let’s make your data work harder—so you don’t have to.

Table of Contents:

  1. What is Google Sheets Automation?
  2. Why is Automation in Google Sheets Important for Businesses?
  3. Key Tools for Automation with Google Sheets
  4. Methods for Automating Google Sheets
  5. Examples of Automation in Google Sheets
  6. How to Analyze Data in an Automated Google Sheet?
  7. Benefits of Google Sheets Automation
  8. Best Practices to Automate Tasks in Google Sheets
  9. Limitations for Business Automation Using Google Sheets
  10. FAQs
  11. Wrap Up

What is Google Sheets Automation?

Definition: Google Sheets Automation means letting the spreadsheet do the work for you. Instead of updating cells manually, you set up smart actions that run automatically.

Think of auto-updating data, reminders, or reports that build themselves. You can even use Google Sheets’ artificial intelligence to predict trends. Or pull live data using IMPORTDATA in Google Sheets. It’s all about saving time and avoiding errors. Automation helps you focus on decisions, not data entry.

Why is Automation in Google Sheets Important for Businesses?

If your team is still updating spreadsheets cell by cell, you’re wasting time. Manual work slows everyone down. Errors creep in, and projects stall. Google Sheets automation is how innovative businesses stay fast, focused, and flexible.

  • Automation reduces manual work: Manual updates eat into your day and wear down your team. With tools like Google Sheets time tracking, repetitive tasks, such as logging hours, run in the background while you focus on your real work.
  • Real-time accuracy: Working with old data can cost you time, money, and trust. Automation, paired with tools like Google Sheets slicers, ensures your dashboards reflect the latest numbers at any moment.
  • Enhances collaboration: Teams can update one sheet in real time, without emailing version after version. With automation handling the heavy lifting, updates appear instantly for everyone, resulting in less back-and-forth and fewer mistakes.
  • Easy to scale: As your business grows, your spreadsheets don’t need to get more complicated. Google Sheets automation enables you to apply the same workflow across new teams.

Key Tools for Automation with Google Sheets

You don’t need to be a tech expert to automate your spreadsheets. Google has built powerful tools right into Sheets. With a bit of creativity and the right features, anyone can build intelligent workflows. Whether you’re analyzing marketing leads or syncing data from another source, Google Sheets functionality has you covered.

How? Check out these tools:

  • Google Apps Script: This is the brain behind advanced automation. You can write small bits of code to send emails. It is ideal for custom workflows powered by Google Sheets Artificial Intelligence.
  • Google Sheets Add-ons: Add-ons are plug-and-play tools that expand the capabilities of your sheet. From data merging to advanced reports, there’s an add-on for almost anything. This includes those that help build a Google Sheets Amortization Schedule in seconds.
  • Formulas: Sometimes, automation is as simple as an innovative formula. Functions like ARRAYFORMULA, IF, or IMPORTRANGE can do a lot without touching a single line of code.
  • Macros: Macros record your actions and replay them whenever needed. If you’re performing the same formatting, filtering, or updating tasks, record them once and reuse the information.
  • Triggers: Want a task to run every hour or every time someone edits a sheet? Triggers make that possible. It’s automation on autopilot.

Methods for Automating Google Sheets

Manual work slows teams down. Spreadsheets feel like chores. However, with Google Sheets automation, you can turn your files into self-updating tools that think ahead for you. Whether you’re tracking expenses or syncing client data, the proper method can save you hours.

Here’s how people are making their sheets smarter:

  • Script-based automation: Google Apps Script enables you to write code to automate repetitive tasks within your spreadsheets. For example, you can set up a script to send daily email summaries.
  • Formula-based automation: Formulas do more than math—they can pull, clean, and organize your data in real time. Functions like IMPORTRANGE in Google Sheets and ARRAYFORMULA help eliminate the need for manual updates across sheets.
  • Third-party integration: Tools like Zapier enable seamless connections between Google Sheets and apps like Gmail, requiring no code. You can trigger actions, sync data, and utilize Google Sheets’ Artificial Intelligence features to gain valuable insights.
  • Automation templates: These are ready-made files with built-in automation for tasks such as budgeting, project tracking, or lead scoring. They save time by providing you with an innovative structure and tools, such as Google Sheets’ time tracking.

Examples of Automation in Google Sheets

Have you ever stared at a spreadsheet and thought, “There has to be an easier way”? You’re not alone. Many teams spend too much time on tasks that could run themselves. With Google Sheets automation, everyday workflows become faster, cleaner, and less stressful. Here are a few real examples that show what’s possible:

  • Automated budget tracker: No more copy-pasting receipts or typing in expenses. Use formulas and IMPORTDATA in Google Sheets to pull spending data from linked sources and update totals instantly.
  • Sales performance dashboard: Create a live view of your team’s performance with charts, filters, and color-coded trends. Add Google Sheets slicers so managers can sort results by region, product, or representative without needing to touch a formula.
  • Employee timesheet: Utilize the Google Sheets’ time tracking feature to log hours as tasks are completed automatically. Pair it with a script to calculate weekly totals and email reminders to team members with missing entries.
  • Live stock monitor: Track live prices with Google Finance in Google Sheets—it pulls current stock straight into your sheet. Add conditional formatting to highlight significant changes, so you never miss a move.

Top 10 ChartExpo Visuals using Google Sheets Automation

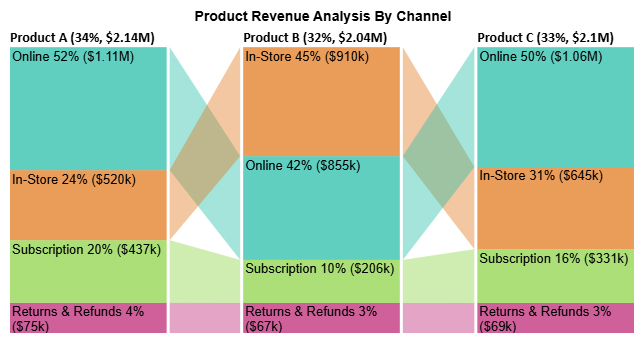
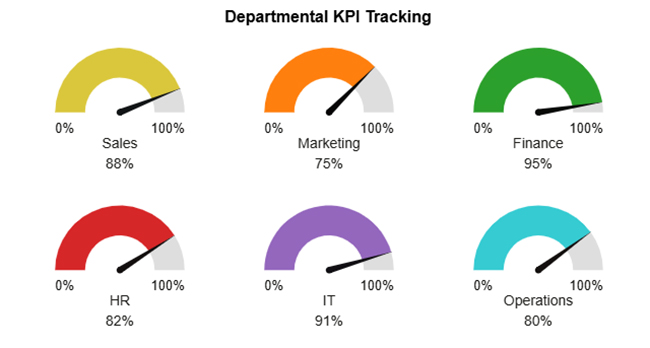
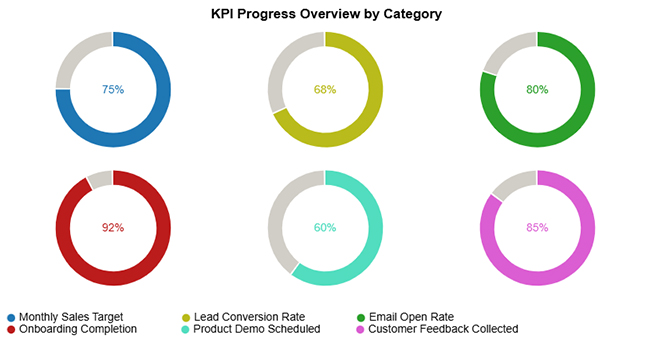
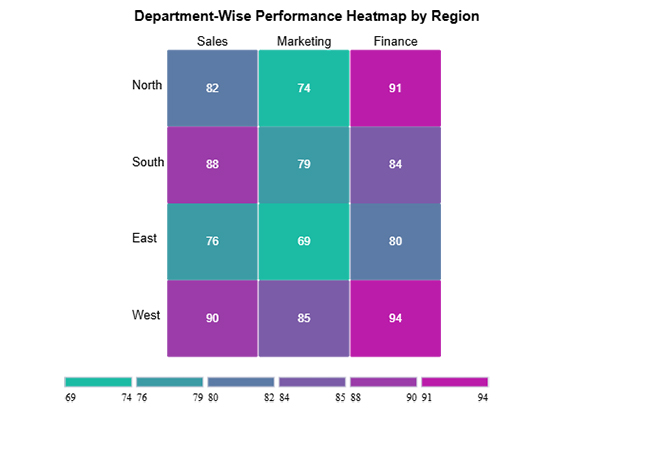
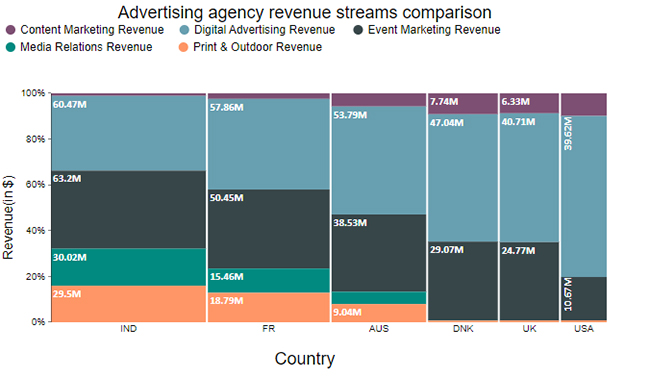
Spreadsheets don’t have to be boring. When data comes alive through visuals, decisions get faster and wiser. With Google Sheets Automation and ChartExpo, you can turn raw numbers into stories people understand. From marketing teams to finance analysts, these visuals help track, compare, and present data that updates itself. Here are 10 standout charts you can build in automated Google Sheets:

  • Sankey Chart: Great for showing how values flow from one stage to another. Think of it as a clear map of income flowing into expenses, updated through real-time automation.
Google Sheets Automation
  • Comparison Bar Chart: See which category outperforms the rest. Your live performance metrics can be pulled in and compared with zero manual input.
Google Sheets Automation
  • Gauge Chart: Set a goal and track your progress. This chart shows real-time status, powered by Google Sheets Functionality that refreshes as data changes.
Google Sheets Automation
  • Progress Circle Chart: Watch goals grow. This chart is ideal for visualizing task completion or lead conversions that refresh automatically as new input data is added.
Google Sheets Automation
  • Heatmap: Color tells the story. A heatmap highlights the hot and cold zones in performance across regions or departments, all in real-time.
Google Sheets Automation
  • Multi Axis Line Chart: Track multiple trends on one chart. The Multi Axis Line Chart is great for comparing revenue and profit over time from live feeds across different teams or locations.
Google Sheets Automation
  • Clustered Stacked Bar Chart: Group and stack your data by category. This chart is useful for marketing channels or customer segments and is updated continuously through IMPORTRANGE in Google Sheets.
Google Sheets Automation
  • Stacked Waterfall Chart: Show how each piece impacts the whole. Use it for financial breakdowns where each component affects the bottom line. Automate it so nothing’s outdated.
Google Sheets Automation
  • Mosaic Chart: Compare two dimensions at once, such as revenue by customer type. Automated Sheets keep your data live, eliminating the need for re-uploads.
Google Sheets Automation
  • Multi Axis Spider Chart: View project performance at a glance. Time, budget, and quality—all wrapped in a dynamic chart that updates using Google Sheets Artificial Intelligence features.
Google Sheets Automation

How to Analyze Data in an Automated Google Sheet?

Data is everywhere, and spreadsheets remain the go-to tool for sorting through the chaos. Google Sheets automation helps you tame it—faster, smarter, and with fewer mistakes. But let’s be honest: Google Sheets isn’t winning any awards for stunning visuals. Pie charts and bar graphs only get you so far. And when your data story needs more punch? That’s where ChartExpo steps in. It fills the visual gap left by Google Sheets. Think of it as giving your spreadsheet a voice and a more polished appearance.

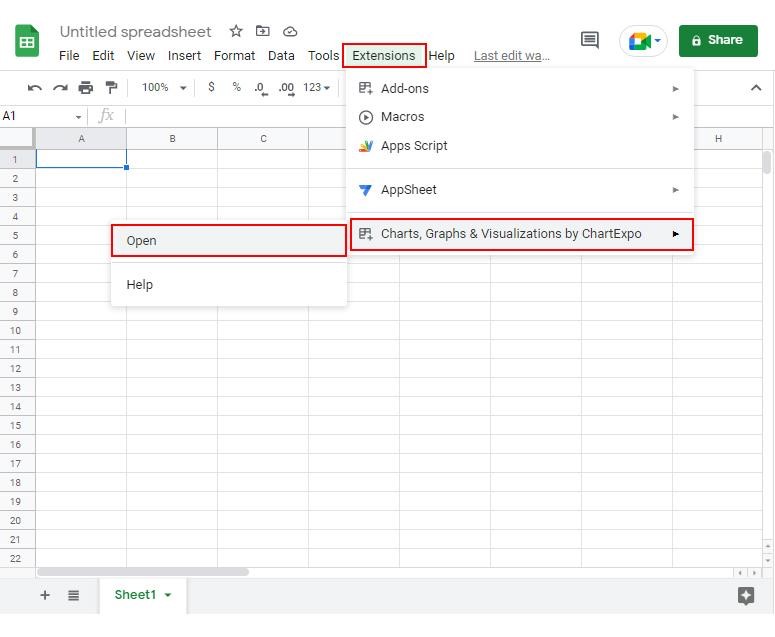
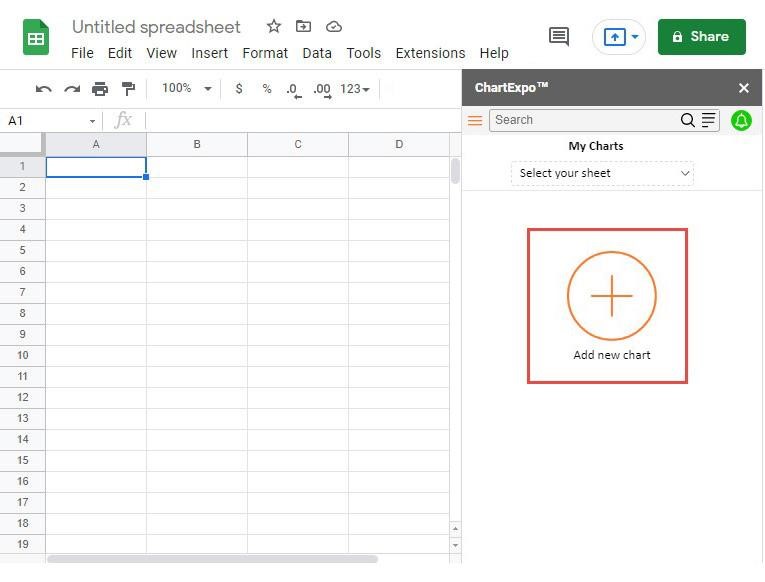
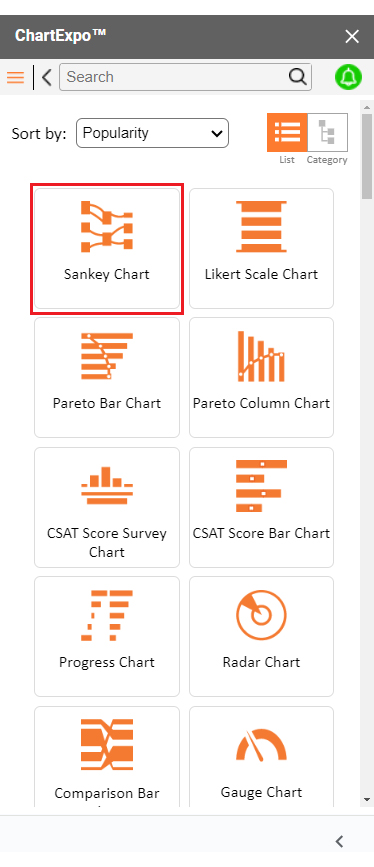
How to Install ChartExpo in Google Sheets?

  1. To start using ChartExpo, download it directly from the Google Sheets program. To do this, select Extensions from the top toolbar.
  2. A menu will appear. Click the Get add-ons option.
  3. Search for ChartExpo, and click on Charts, Graphs & Visualizations by ChartExpo when it appears in the results.
  4. Click the Install button. You will have to confirm your Google account and accept some permissions.

ChartExpo charts are available both in Google Sheets and Microsoft Excel. Please use the following CTAs to install the tool of your choice and create beautiful visualizations in a few clicks in your favorite tool.

Example

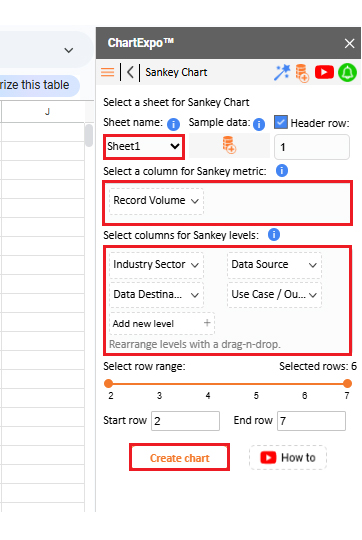
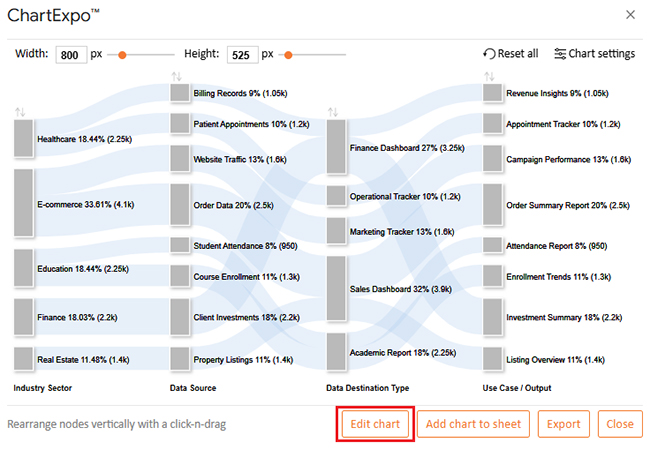
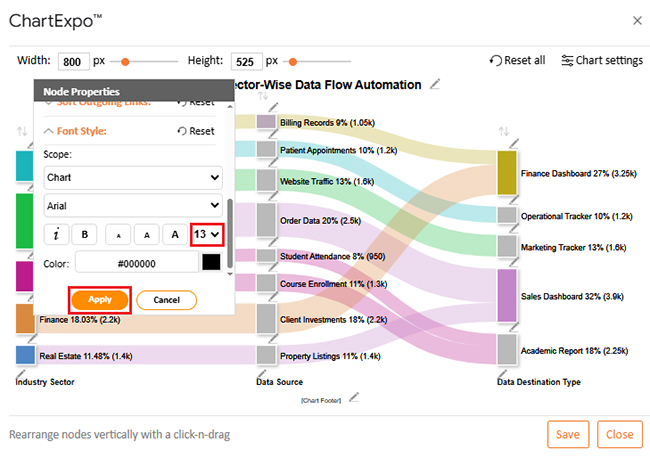
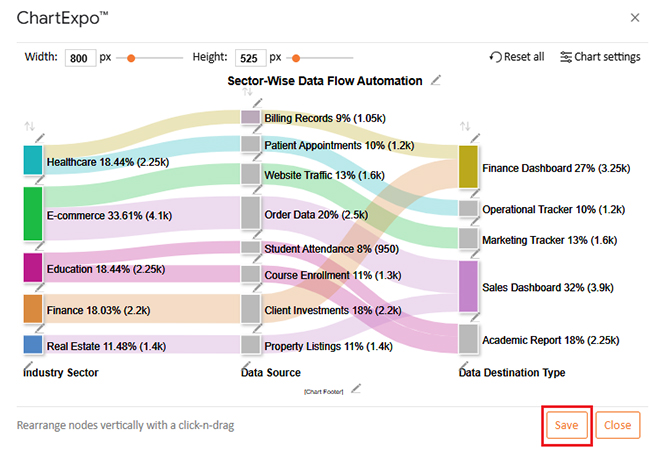
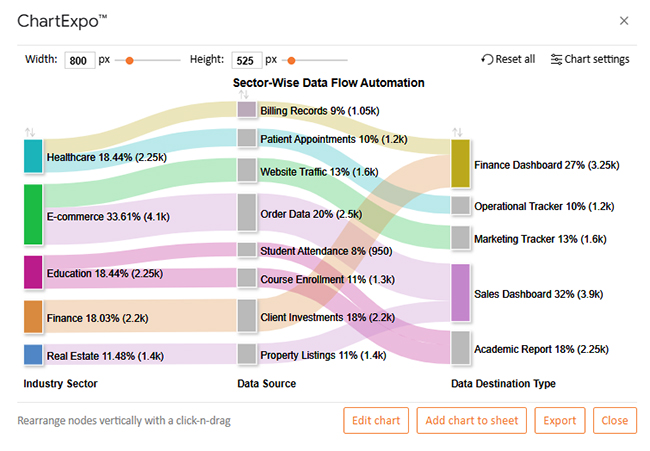
Let’s analyze this sample data in Google Sheets using ChartExpo.

Industry Sector Data Source Data Destination Type Use Case / Output Record Volume
Healthcare Patient Appointments Operational Tracker Appointment Tracker 1,200
Healthcare Billing Records Finance Dashboard Revenue Insights 1,050
E-commerce Order Data Sales Dashboard Order Summary Report 2,500
E-commerce Website Traffic Marketing Tracker Campaign Performance 1,600
Education Student Attendance Academic Report Attendance Report 950
Education Course Enrollment Academic Report Enrollment Trends 1,300
Finance Client Investments Finance Dashboard Investment Summary 2,200
Real Estate Property Listings Sales Dashboard Listing Overview 1,400
  • To get started with ChartExpo, install ChartExpo in Google Sheets.
  • Go to Extensions > Charts, Graphs & Visualizations by ChartExpo > Open.
Google Sheets Automation
  • To access the charts library, click the Add new chart button.
Google Sheets Automation
  • Once ChartExpo is loaded. Click on “Sankey Chart.”
Google Sheets Automation
  • Put the data table in the sheet first. Then, choose the Sheet name from the drop-down in the ChartExpo section.
  • Select the metric column; metric is the numeric column in your data sheet.
  • Select the dimensions column; the dimension is the categorical column in your datasheet that contains text information.
  • Click the Create chart button to complete the process.
Google Sheets Automation
  • ChartExpo will generate the visualization below for you.
Google Sheets Automation
  • If you want to have the chart’s title, click Edit Chart, as shown in the above image.
  • Click the pencil icon next to the Chart Header to change the title.
  • It will open the properties dialog. Under the Text section, you can add a heading in Line 1 and enable Show.
  • Give the appropriate title of your chart and click the Apply button.
Google Sheets Automation
  • You can add color in Nodes and set the direction as follows:
Google Sheets Automation
  • You can increase font size for better readability as follows:
Google Sheets Automation
  • Click the “Save Changes” button to persist the changes.
Google Sheets Automation
  • Your final chart will appear as follows.
Google Sheets Automation

Insights

  • E-commerce drives automation flows, utilizing over 33% of the data to power real-time Sales and Marketing Dashboards.
  • Healthcare and Education show equal automation usage (18.44% each), focusing on tasks such as appointment scheduling, attendance tracking, and student registration.
  • The Sales Dashboard is the most commonly used output (32% usage), vital in the E-commerce and Real Estate sectors.
  • Multiple industries utilize specialized dashboards, such as the Finance Dashboard and Academic Report, indicating coordinated, multi-departmental automation.

Benefits of Google Sheets Automation

Let’s be honest: manual work is draining. But don’t worry, Google Sheets automation gives you a break from the busywork. It’s not magic, but it sure feels like it. Here’s how it makes life easier, one smart step at a time:

  • Saves time: Automation handles repetitive tasks so you don’t have to. This translates to more time for strategy and less time formatting cells.
  • Reduces errors: No more copy-paste mistakes. Your data stays clean and consistent with every update.
  • Boosts collaboration: Multiple people can work on the same file without stepping on each other’s toes. Utilize tools like Google Sheets slicers to enable users to filter views without needing to access raw data.
  • Scales easily: As your team grows, your spreadsheet doesn’t fall apart. Whether it’s 10 entries or 10,000, automation keeps things smooth.
  • Connects everything: Use IMPORTRANGE in Google Sheets to pull info from other files. Bring everything together without moving a single row by hand.

Best Practices to Automate Tasks in Google Sheets

Let’s face it—spreadsheets don’t have to be a mess of endless rows and late-night fixes. Google Sheets automation can help you breathe easier. But only if you do it right. Here are some real-world tips to make your automation smooth, bright, and stress-free:

  • Start simple: Don’t try to automate everything at once. Begin with one task, like using IMPORTRANGE in Google Sheets to pull data from a master sheet.
  • Use clear naming: Name your sheets, ranges, and columns clearly and concisely. Trust me, “Sheet3” won’t make sense in two weeks.
  • Document your flow: Write down what each script or formula does. That way, when something breaks (and it will), you’re not decoding your past self’s chaos.
  • Test before you trust it: Run your automation on a copy first. A small test can save you from a massive headache.
  • Backup regularly: Even the most intelligent automation needs a safety net. Create snapshots before significant changes.

Limitations for Business Automation Using Google Sheets

Let’s be real. Google Sheets automation is powerful, but it’s not perfect. Sometimes your sheet feels more like a puzzle than a solution. And while automation can save the day, it does have its limits. Here’s what you should watch out for:

  • Data volume limits: Google Sheets slows down when there is too much data. If you’re working with tens of thousands of rows, performance can suffer.
  • Script timeouts: Google Apps Script runs on a timer. If your process takes too long, it can time out and stop mid-task, leaving you uncertain about its status.
  • No native AI analysis: While Google Sheets Artificial Intelligence can suggest formulas or trends, it’s still basic. For deeper analysis, you’ll need to export or integrate with other tools.
  • Limited visual options: Charts are fine, but not great. You’ll need tools like ChartExpo for creating advanced visuals, such as Sankey Charts or Spider charts.
  • Access issues: With many users editing simultaneously, things can become messy. Even with protections in place, a single mistake can disrupt your automation.
  • No offline automation: If you’re not connected, your automations won’t run. Real-time updates need real-time internet.

FAQs

Can you do automation in Google Sheets?

Yes, you can. Use formulas, macros, and Google Apps Script to automate tasks such as data entry, updates, and reporting. Tools like IMPORTDATA in Google Sheets and Google Sheets time tracking make it even easier.

How do I automatically add things in Google Sheets?

  • Use the SUM() function to total values.
  • Try ARRAYFORMULA to apply formulas across rows.
  • Use IMPORTRANGE in Google Sheets to pull and add external data.
  • Create scripts for complex additions or triggers to automate tasks.

Wrap Up

Google Sheets automation is more than a time-saver. It’s a more innovative way to manage daily tasks. From data entry to reporting, it simplifies work. You don’t need to be a developer to use it. Built-in tools like Google Sheets transpose make data cleaner and easier to read. One formula can reshape your entire sheet in seconds.

Need to manage loan data or payment plans? Use Google Sheets’ amortization schedule. It calculates everything for you—principal, interest, and totals—on autopilot.

Want to save even more time? Pair Google Sheets with Google Apps Script. This simple scripting tool enables you to automate repetitive tasks, such as sending email alerts or generating reports. No heavy coding required. Just a few lines can transform your workflow.

Another great option is using Google Sheets add-ons. These extensions unlock features like advanced reporting, better visualization, and even integrations with other apps. You can connect Sheets to your CRM, automate invoices, or build custom dashboards. All without leaving your spreadsheet.

The real power lies in its flexibility. With strong Google Sheets functionality, you can combine formulas, scripts, and add-ons. Your spreadsheet becomes more than a file. It becomes a tool.

Automation also helps your team. Data updates in real time, with fewer errors. Consequently, this results in faster decisions and business growth. Whether you’re tracking tasks, sales, or finances, automation gives you control. To take your data visuals even further, install ChartExpo and turn numbers into clear, compelling insights.

How much did you enjoy this article?

GSAd2
Start Free Trial!
157242

Related articles

next previous
Google Sheets9 min read

How to Group Columns in Google Sheets for Faster Insights

Learn how to group columns in Google Sheets to organize data fast. You’ll discover step-by-step tips and charts to manage and analyze spreadsheets easily.

Google Sheets10 min read

Import XML to Google Sheets: Smarter Ways to Use XML

Importing XML to Google Sheets helps you pull structured web data into spreadsheets. This guide will show you how to use it, analyze results, and avert issues.

Google Sheets11 min read

Wedding Budget Template in Google Sheets: Clear Insights

The wedding budget template in Google Sheets tracks and organizes wedding costs. This guide shows you how to set it up and stay on budget with ease.

Google Sheets11 min read

Google Sheets HLOOKUP: A Simple Walkthrough

Google Sheets HLOOKUP finds data fast by scanning rows. Click here to learn how to use it to save time, reduce errors, work smarter, and more.

Google Sheets11 min read

Compare Two Columns in Google Sheets: A Quick Guide

Learn how to compare two columns in Google Sheets with ease. This guide helps you spot differences, clean data, visualize results quickly, and more.

ChartExpo logo

Turn Data into Visual
Stories

CHARTEXPO

  • Home
  • Gallery
  • Videos
  • Services
  • Pricing
  • Contact us
  • FAQs
  • Privacy policy
  • Terms of Service
  • Sitemap

TOOLS

  • ChartExpo for Google Sheets
  • ChartExpo for Microsoft Excel
  • Power BI Custom Visuals by ChartExpo
  • Word Cloud

CATEGORIES

  • Bar Charts
  • Circle Graphs
  • Column Charts
  • Combo Charts
  • Comparison Charts
  • Line Graphs
  • PPC Charts
  • Sentiment Analysis Charts
  • Survey Charts

TOP CHARTS

  • Sankey Diagram
  • Likert Scale Chart
  • Comparison Bar Chart
  • Pareto Chart
  • Funnel Chart
  • Gauge Chart
  • Radar Chart
  • Radial Bar Chart
  • Sunburst Chart
  • see more
  • Scatter Plot Chart
  • CSAT Survey Bar Chart
  • CSAT Survey Chart
  • Dot Plot Chart
  • Double Bar Graph
  • Matrix Chart
  • Multi Axis Line Chart
  • Overlapping Bar Chart
  • Control Chart
  • Slope Chart
  • Clustered Bar Chart
  • Clustered Column Chart
  • Box and Whisker Plot
  • Tornado Chart
  • Waterfall Chart
  • Word Cloud
  • see less

RESOURCES

  • Blog
  • Resources
  • YouTube
SIGN UP FOR UPDATES

We wouldn't dream of spamming you or selling your info.

© 2025 ChartExpo, all rights reserved.