• Home
  • Tools dropdown img
    • Spreadsheet Charts

      • ChartExpo for Google Sheets
      • ChartExpo for Microsoft Excel
    • Power BI Charts

      • Power BI Custom Visuals by ChartExpo
    • Word Cloud

  • Charts dropdown img
    • Chart Category

      • Bar Charts
      • Circle Graphs
      • Column Charts
      • Combo Charts
      • Comparison Charts
      • Line Graphs
      • PPC Charts
      • Sentiment Analysis Charts
      • Survey Charts
    • Chart Type

      • Box and Whisker Plot
      • Clustered Bar Chart
      • Clustered Column Chart
      • Comparison Bar Chart
      • Control Chart
      • CSAT Survey Bar Chart
      • CSAT Survey Chart
      • Dot Plot Chart
      • Double Bar Graph
      • Funnel Chart
      • Gauge Chart
      • Likert Scale Chart
      • Matrix Chart
      • Multi Axis Line Chart
      • Overlapping Bar Chart
      • Pareto Chart
      • Radar Chart
      • Radial Bar Chart
      • Sankey Diagram
      • Scatter Plot Chart
      • Slope Chart
      • Sunburst Chart
      • Tornado Chart
      • Waterfall Chart
      • Word Cloud
    • Google Sheets
      Microsoft Excel
  • Services
  • Pricing
  • Contact us
  • Blog
  • Support dropdown img
      • Gallery
      • Videos
      • Contact us
      • FAQs
      • Resources
    • Please feel free to contact us

      atsupport@chartexpo.com

Categories
All Data Visualizations Data Analytics Surveys
Add-ons/
  • Google Sheets
  • Microsoft Excel
  • Power BI
All Data Visualizations Data Analytics Surveys
Add-ons
  • Google Sheets
  • Microsoft Excel
  • Power BI

We use cookies

This website uses cookies to provide better user experience and user's session management.
By continuing visiting this website you consent the use of these cookies.

Ok

ChartExpo Survey


Home > Blog > Google Sheets

How to Import HTML into Google Sheets for Better Insights

Import HTML Google Sheets—an innovative way to pull data straight from a website into your spreadsheet. Many users search for this exact solution every day. Why? The demand for web data in spreadsheets keeps growing. Over 90% of companies rely on external data sources for decision-making. Here, speed matters, as accuracy matters even more.

import-html-google-sheets

Google Sheets functionality makes importing data from websites surprisingly simple. With the right tools, you can gather live information from any public webpage. No coding degree required, and you don’t need fancy software either. All you need is the right formula.

One method is the IMPORTDATA in Google Sheets function. It pulls data from CSV or TSV files hosted online. However, it has limits. What if you want actual tables or lists from a website? This is where the Import HTML Google Sheets technique comes in. It allows you to grab specific sections of a webpage. Think tables, lists, and structured content.

This function is popular among marketers, analysts, and researchers. It helps track competitor prices, collect stock information, or monitor sports scores. The beauty of this method lies in its simplicity—no special tools. No plugins. You stay within Google Sheets, as the formula does the heavy lifting.

Many users overlook this feature. Yet, those who know it save hours of manual copying and pasting. By learning this technique, you’ll boost your Google Sheets functionality and expand your skills. If you’ve used IMPORTDATA in Google Sheets before, this approach will feel familiar—only smarter and more precise.

Let me take you through.

Table of Contents:

  1. What is Import HTML in Google Sheets?
  2. Why Use Import HTML in Google Sheets?
  3. Understanding the ImportHTML Function in Google Sheets
  4. How to Use ImportHTML in Google Sheets?
  5. How to Extract a Table Using Google Sheets: Import HTML Table from Websites?
  6. How to Analyze Data Using IMPORTHTML in Google Sheets?
  7. Benefits of Using Google Sheets ImportHTML
  8. Tips for Using Google Sheets ImportHTML
  9. Limitations for Importing HTML Google Sheets
  10. FAQs
  11. Wrap Up

What is Import HTML in Google Sheets?

Definition: Import HTML in Google Sheets is a function that pulls data from a table or list on a webpage. You provide a URL, select either “table” or “list,” and then choose the index number. It brings structured data right into your spreadsheet. This enhances Google Sheets’ transpose capabilities when converting web rows into usable columns—and vice versa.

Once the data is inside your sheet, you can analyze it further using built-in tools. One of the most powerful options is the What If Analysis in Google Sheets. This feature lets you test different scenarios by adjusting values within your imported data. You can forecast sales, calculate potential profits, or explore budget changes. You get live data and dynamic projections—all in one place.

Why Use Import HTML in Google Sheets?

Are you tired of copying data from websites every day? There’s a more innovative way. Whether you’re tracking stock prices or competitor prices, Import HTML in Google Sheets makes it effortless. It’s just clean, real-time data flowing into your spreadsheet.

Here are the main reasons to consider using this function:

  • Live data: Web data updates constantly, and your spreadsheet should keep up. With Import HTML in Google Sheets, your sheet refreshes automatically to reflect live changes from the source website.
  • No coding needed: No programming knowledge is required to use this function. If you can type a formula—or already know VLOOKUP for Google Sheets—you can easily master this too.
  • Supports lists and tables: Most websites organize data using tables or bullet lists. This function pulls that structured content straight into your spreadsheet by selecting a simple index number.
  • Integration with other functions: Combine ImportHTML with IMPORTRANGE in Google Sheets to send live web data into multiple files. You can then filter, analyze, or chart the content across different sheets effortlessly.
  • Collaboration ready: You can instantly collaborate by learning how to share a Google Sheets file. Everyone on your team sees the same up-to-date info without needing to refresh or re-download anything.

Understanding the ImportHTML Function in Google Sheets

Import HTML in Google Sheets is a built-in function that pulls data from websites. It works with HTML tables or lists. You enter the URL, specify “table” or “list”, and choose an index number. The data appears right in your spreadsheet.

This function helps track live stats, product prices, or news headlines. You don’t need any scripts or add-ons. It updates automatically and works seamlessly with Google Sheets’ functionality tools, such as filters and charts. This integration provides a quick setup and delivers powerful results.

How to Use ImportHTML in Google Sheets?

Are you tired of copying tables from websites into your spreadsheet? There’s a more innovative, faster way—and it’s built right into Google Sheets. Whether you’re tracking currency values or monitoring product data, ImportHTML in Google Sheets can pull that info in seconds.

Here’s how to use it—step by step:

  • Start your spreadsheet: Click the cell where you want the imported data to begin. This sets the anchor point for the content pulled from the webpage.
  • Determine the web page URL: Navigate to the webpage that contains the table or list you want to view. Copy the full URL from your browser’s address bar.
import-html-google-sheets
  • IMPORTHTML formula in Google Sheets: In a blank cell, type the formula using this structure: =IMPORTHTML(“URL”, “query”, index). Replace “query” with either “table” or “list”, and “index” with the correct number based on the webpage’s structure.

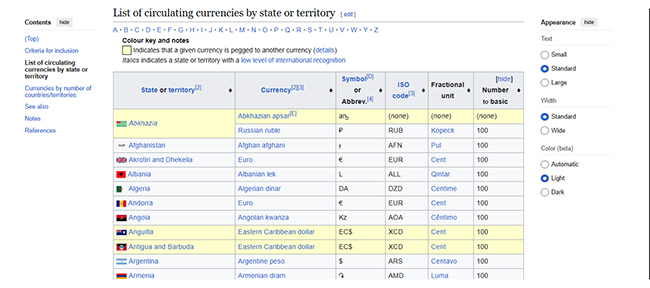
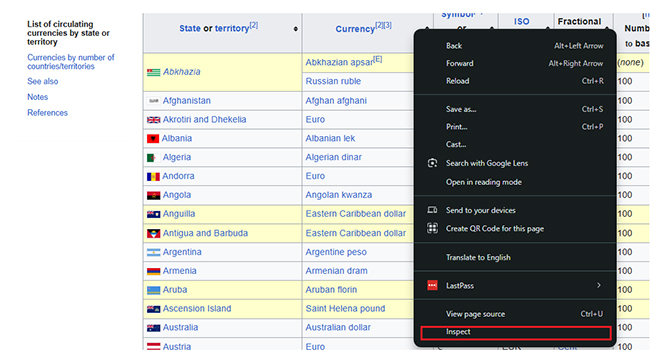
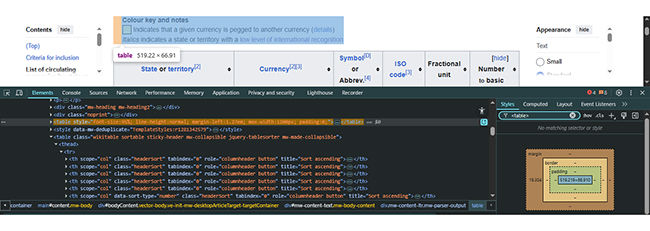
How to determine the index number?

  • Open the webpage you want to use (for example, en.wikipedia.org/wiki/List_of_circulating_currencies).
  • Right-click anywhere on the page and choose Inspect. This will open your browser’s developer tools. Here, you can check the number of tables or lists on the page and find the correct index to use.
import-html-google-sheets
  • Right-click on the page and select Inspect to open your browser’s developer tools. Then press Ctrl+F (or Cmd+F on Mac) and search for <table> to count how many appear before the one you need.
  • Identifying the right table: The tables are listed in the order they appear on the page. On the currency Wikipedia page, the main table is usually first, so its index is 1.
import-html-google-sheets
  • Enter the formula in Google Sheets: Paste your complete formula into the selected cell and press Enter. If you encounter an error, such as #REF!, click on it to view the message.
  • You may need to click ‘Allow Access’ to allow Google Sheets to fetch data from external sources.
import-html-google-sheets
  • Once you grant access, the data will load into your Google Sheet within a few seconds.
import-html-google-sheets

How to Extract a Table Using Google Sheets: Import HTML Table from Websites?

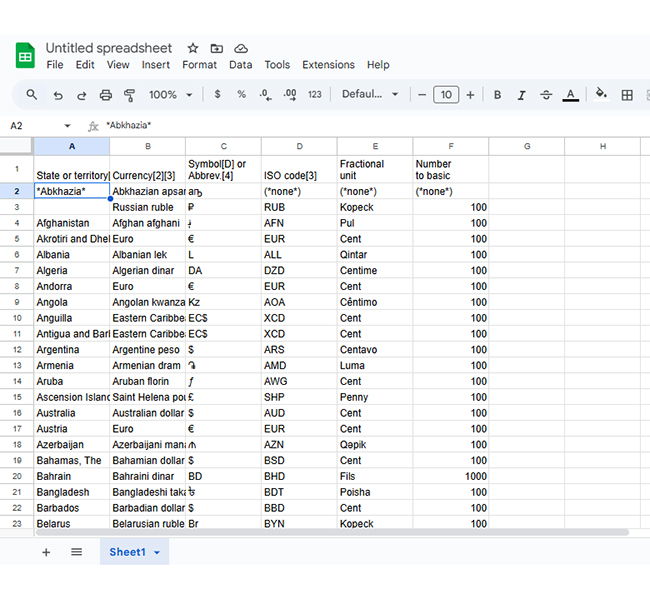
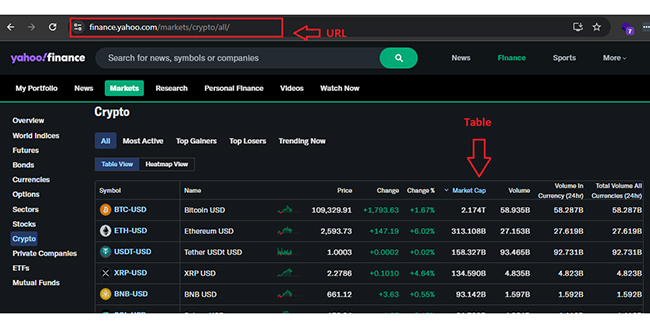
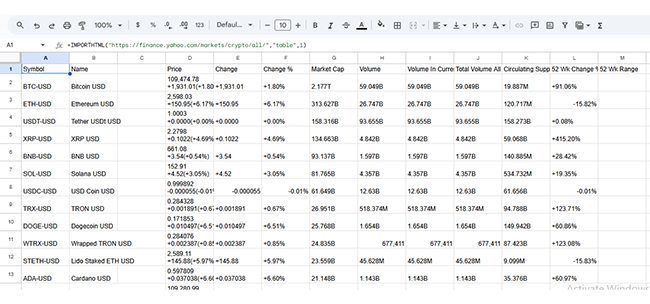
Let’s say you want to pull live crypto prices straight into your spreadsheet. Skip the browser tabs and refresh buttons. ImportHTML in Google Sheets allows you to bring real-time data from websites—right into your sheet—with no coding required. If you’re tracking Bitcoin, Ethereum, or dozens of altcoins, this method keeps everything up to date for you. It’s quick, clean, and ready to use.

How?

  • Get your URL: Start by heading over to Yahoo! Finance’s crypto page. You’ll find all the data neatly structured in one table.
import-html-google-sheets
  • Enter the IMPORTHTML formula: In a new Google Sheet, select the cell where you want the data to appear. Paste this formula:
import-html-google-sheets

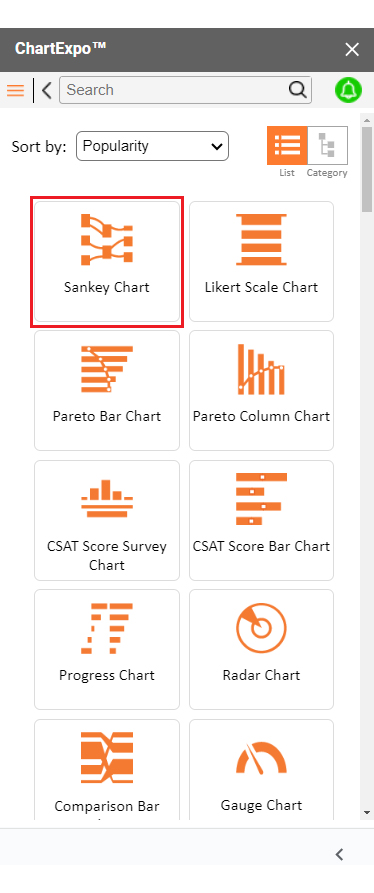
Top 5 Charts Using ChartExpo after importing HTML in Google Sheets 

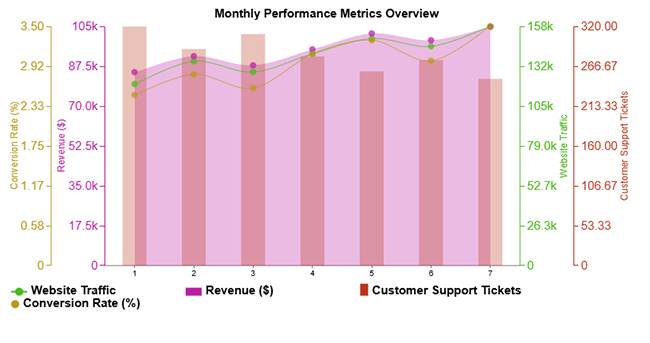
Charts make complex data easy to understand. And when it comes to visualizing your data, ChartExpo in Google Sheets is a game-changer. It turns raw numbers into compelling visuals with just a few clicks.

  • Sankey Chart: A Sankey Chart illustrates the flow of data, whether it’s materials, information, or traffic between two phases. The thickness of the arrows shows the quantity or flow, making it perfect for visualizing complex distributions.
import-html-google-sheets
  • Multi-Axis line Chart: This chart allows you to compare multiple measures with different scales on separate Y-axes. It’s ideal for visualizing trends over time in one unified graph, making it easy to spot correlations.
import-html-google-sheets
  • Comparison Bar Chart: A Comparison Bar Chart is used to represent the differences between categories or groups visually. It’s ideal for comparing items such as stock prices and product ratings, particularly when utilizing data imported into Google Sheets.
import-html-google-sheets
  • Multi-Axis Spider Chart: The Multi-Axis Spider Chart is used to compare multiple variables on a single graph. This chart is excellent for assessing strengths and weaknesses in data, such as comparing player statistics.
import-html-google-sheets
  • Scatter Plot: A Scatter Plot chart displays the relationship between two variables by plotting points on the x-axis and y-axis. It’s a great choice when comparing data, as it works well with web-imported data in Google Sheets.
import-html-google-sheets

How to Analyze Data Using IMPORTHTML in Google Sheets?

Data analysis without proper visualization is like reading a book in the dark. You can make out the words, but you’re missing the big picture. Google Sheets is great for organizing data, but when it comes to visualizing it, well, it hits a bit of a wall.

That’s where ChartExpo comes in. It transforms your Google Sheets data into stunning, insightful, and easy-to-understand charts. But what about extracting specific data points, like using HLOOKUP to find information across rows? Don’t worry, we’ve got that covered too.

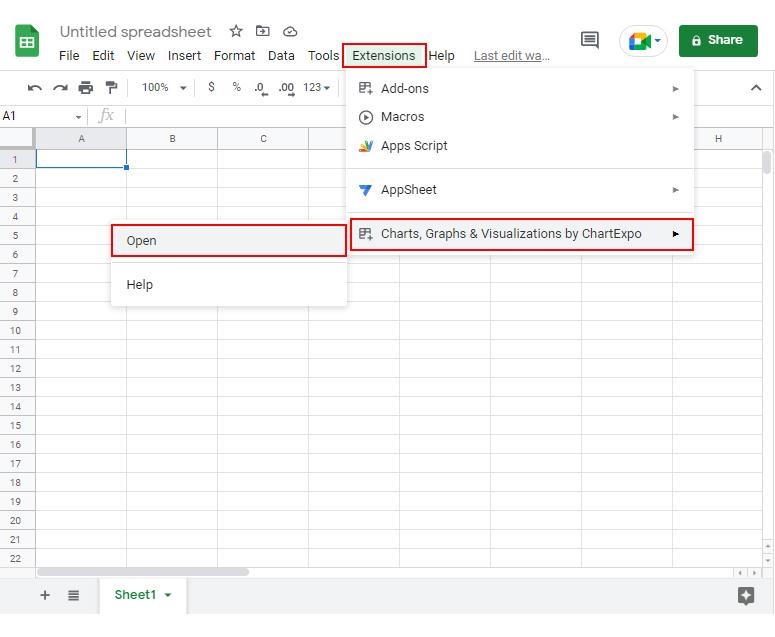
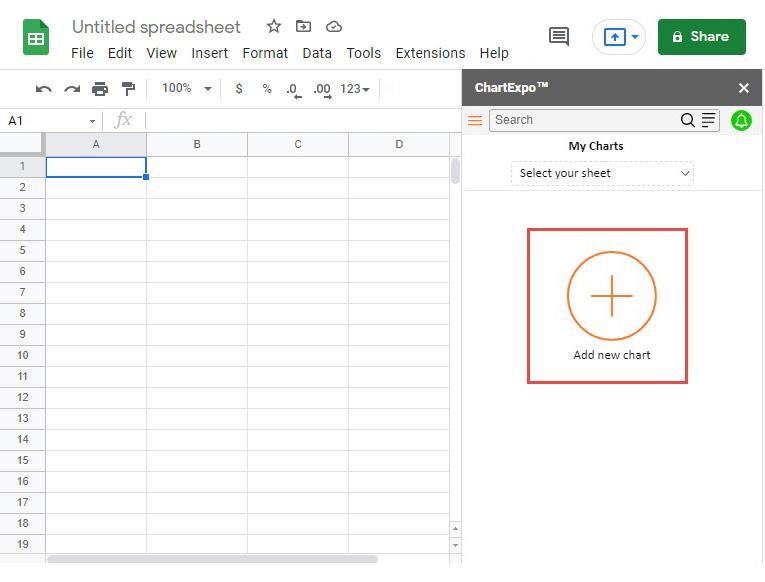
How to Install ChartExpo in Google Sheets?

  1. To start using ChartExpo, download it directly from the Google Sheets program. To do this, select Extensions from the top toolbar.
  2. A menu will appear. Click the Get add-ons option.
  3. Search for ChartExpo, and click on Charts, Graphs & Visualizations by ChartExpo when it appears in the results.
  4. Click the Install button. You will have to confirm your Google account and accept some permissions.

ChartExpo charts are available both in Google Sheets and Microsoft Excel. Please use the following CTAs to install the tool of your choice and create beautiful visualizations in a few clicks in your favorite tool.

Example

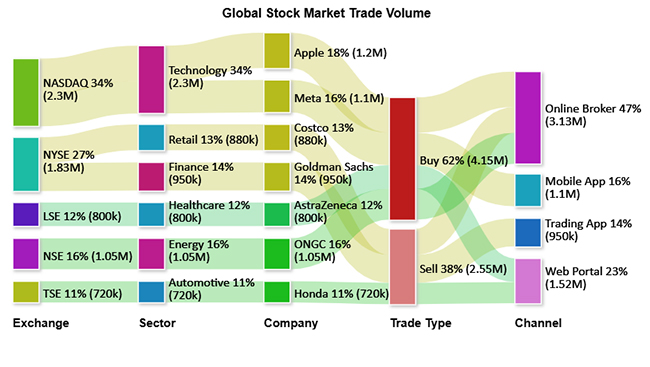
Let’s analyze this sample data in Google Sheets using ChartExpo.

Exchange

Sector Company Trade Type Channel

Trade Volume

NASDAQ Technology Apple Buy Online Broker 1,200,000
NYSE Finance Goldman Sachs Sell Trading App 950,000
LSE Healthcare AstraZeneca Buy Web Portal 800,000
NSE Energy ONGC Buy Online Broker 1,050,000
TSE Automotive Honda Sell Web Portal 720,000
NASDAQ Technology Meta Buy Mobile App 1,100,000
NYSE Retail Costco Sell Online Broker 880,000
  • To get started with ChartExpo, install ChartExpo in Google Sheets.
  • Go to Extensions > Charts, Graphs & Visualizations by ChartExpo > Open.
import-html-google-sheets
  • To access the charts library, click the Add new chart button.
import-html-google-sheets
  • Once ChartExpo is loaded. Click on “Sankey Chart”.
import-html-google-sheets
  • Put the data table in the sheet first. Then, choose the Sheet name from the drop-down in the ChartExpo section.
  • Select the metric column; metric is the numeric column in your data sheet.
  • Select the dimensions column; the dimension is the categorical column in your datasheet that contains text information.
  • Click the Create chart button to complete the process.
import-html-google-sheets
  • ChartExpo will generate the visualization below for you.
import-html-google-sheets
  • If you want to have the chart’s title, click Edit Chart, as shown in the above image.
  • Click the pencil icon next to the Chart Header to change the title.
  • It will open the properties dialog. Under the Text section, you can add a heading in Line 1 and enable Show.
  • Give the appropriate title of your chart and click the Apply button.
import-html-google-sheets
  • You can add color in Nodes and set the direction as follows:
import-html-google-sheets
  • Increase font size for better readability:
import-html-google-sheets
  • Click the “Save Changes” button to persist the changes.
import-html-google-sheets
  • Your final chart will appear as follows.
import-html-google-sheets

Insights

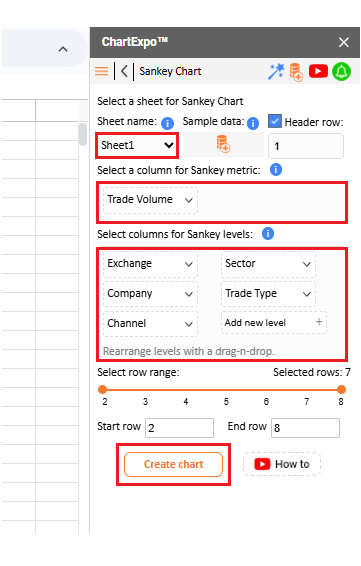
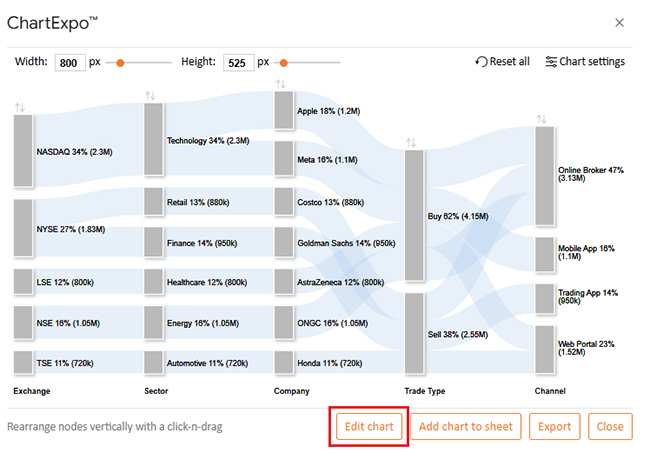
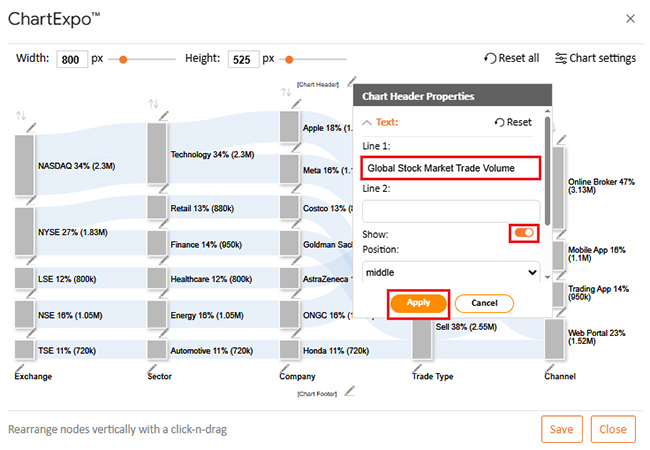
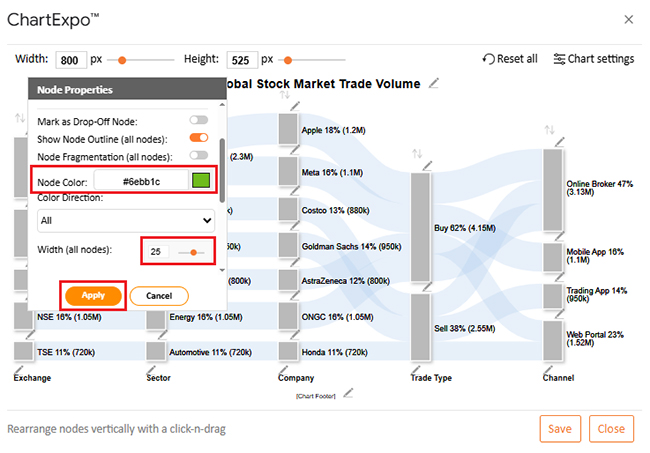
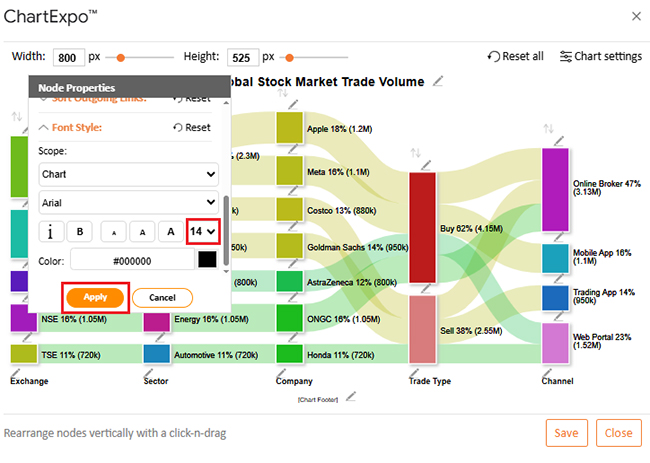
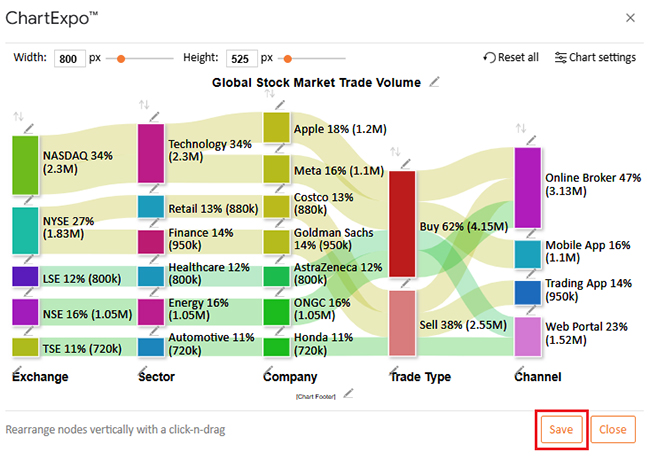
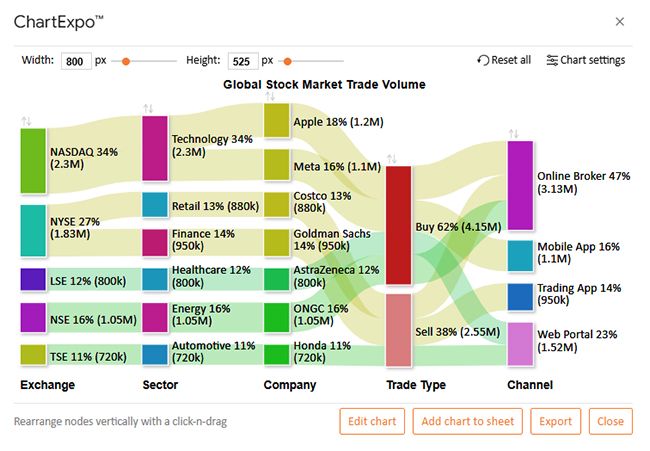
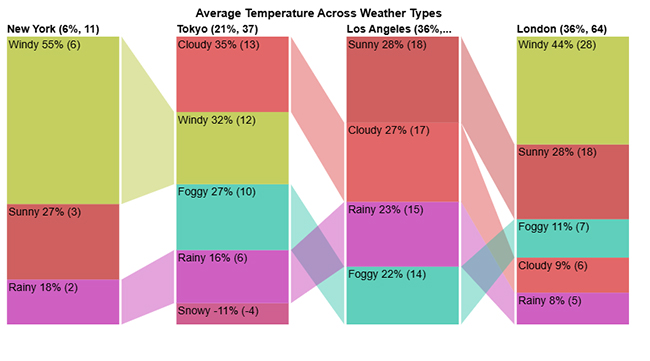
This is a Sankey Chart showing global stock market trade volume flow:

  • Primary sector: Technology leads with the highest trade volume.
  • Top exchange: NASDAQ handles the majority of trades.
  • Most traded companies: Apple and Meta.
  • Trade type: 62% of trades are buy orders.
  • Primary trading channel: 47% of trades occur via Online Brokers.
  • Insight: Investor activity is heavily concentrated in tech stocks and digital platforms.

Benefits of Using Google Sheets ImportHTML

Are you tired of copying data from websites into your spreadsheet every morning? There’s a more innovative way—and it starts with ImportHTML in Google Sheets. This function retrieves live web data and inserts it directly into your sheet. It’s fast, clean, and refreshes automatically.

Here are some key benefits of using it:

  • Live updates: Pulls real-time data from websites, ensuring your sheet stays current. It is great for tracking prices, sports stats, or news headlines.
  • No coding required: You don’t need to be a developer. A straightforward formula does all the heavy lifting.
  • Works with tables and lists: Whether the data is in a structured table or a bullet-point list, ImportHTML can bring it in.
  • Pairs with other functions: Use it with VLOOKUP for Google Sheets or even build a dynamic budget on Google Sheets. It is versatile.
  • Supports collaboration: Share your live data sheet easily. Everyone sees the exact fresh numbers—no manual updates needed.

Tips for Using Google Sheets ImportHTML

Do you want to pull live data from a website into your spreadsheet without lifting more than a finger? IMPORTHTML in Google Sheets is your secret weapon. But like any powerful tool, a few smart tips make all the difference. Let’s make your formula smarter, faster, and error-free with some quick tips:

  • Always use quotation marks: Wrap the URL, query type, and index in quotes. Google Sheets won’t read it right without them.
  • Check the index number: Which table to pull? Use your browser’s Inspect tool to count tables or lists and choose the right index.
  • Use stable URLs: Avoid sites that frequently change their layout or URL structure. Your formula depends on consistency.
  • Combine with filters: Clean up your imported data using built-in filter tools. This makes it easier to analyze or build a budget on Google Sheets.

Limitations for Importing HTML Google Sheets

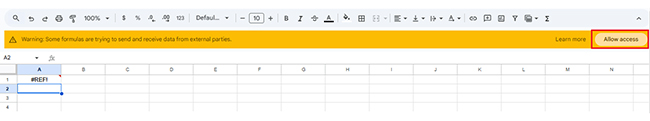
IMPORTHTML in Google Sheets feels like magic—until it doesn’t. It’s great for pulling live data, but it’s not invincible. Knowing its limits saves you time and frustration. Let’s talk about what it can’t do (yet), so you can plan smarter:

  • Limited to public sites: If a website needs a login, IMPORTHTML won’t work. It only pulls from pages anyone can access.
  • No JavaScript content: Sites that load data using JavaScript won’t show anything. IMPORTHTML reads static HTML only.
  • Fragile URLs: If the webpage’s structure changes, your formula breaks. Even small design changes can throw it off.
  • Index guessing game: Finding the correct table or list index can be a trial-and-error process. You should inspect the page manually to count elements.
  • Refresh delays: IMPORTHTML doesn’t constantly update instantly. There’s often a delay, and sometimes a manual reload is needed.
  • Character limit in cells: Imported content is subject to Google Sheets’ character limits. Large tables might get clipped or return partial data.

FAQs

Can you import HTML into Google Sheets?

Yes, you can. Use the IMPORTHTML function. It pulls tables or lists from public web pages. Just enter the URL, element type, and index. The data appears instantly in your sheet- no coding is needed.

What is the difference between IMPORTXML and IMPORTHTML in Google Sheets?

IMPORTHTML pulls tables or lists from web pages. IMPORTXML is more flexible. It utilizes XPath to extract specific elements, such as titles, links, or meta tags. Use IMPORTXML when you need more than just tables or lists.

Wrap Up

Importing HTML into Google Sheets is a smart way to save time. It pulls data from websites directly into your spreadsheet. No more manual copying. No more errors from retyping numbers. This method works well for tables and lists. You only need the website link and the correct index number. In seconds, your data appears in your sheet and updates automatically when the source changes.

You can also combine this function with other tools in Google Sheets. Try formulas to clean and organize the imported data. Use What-If analysis in Google Sheets to test different scenarios. This creates a dynamic and powerful workflow.

Import HTML Google Sheets is perfect for tracking prices, news, or market data. You can automate updates and spend less time gathering information. The result is faster, smarter reports.

If you want better charts for your data, install ChartExpo. ChartExpo is a charting tool that works inside Google Sheets. It works seamlessly with Google Sheets, allowing you to create advanced charts without requiring any coding. This makes your reports easier to understand. With a few clicks, you can turn your imported data into clear, professional visuals. It’s simple, fast, and effective for anyone working with numbers.

How much did you enjoy this article?

GSAd2
Start Free Trial!
156071

Related articles

next previous
Google Sheets11 min read

How to Edit a Google Sheet Like a Pro

Learn how to edit a Google Sheet easily. Discover step-by-step guidance, permission settings, and top chart techniques to boost your productivity.

Google Sheets10 min read

Import CSV to Google Sheets: A Quick Walkthrough

Importing CSV to Google Sheets allows you to upload and use CSV data. Click here to learn how to import, analyze, and manage CSV files in Google Sheets.

Google Sheets8 min read

How to Duplicate a Google Sheet: A Complete Guide

How to duplicate a Google Sheet involves creating an exact copy for reuse or backup. Learn quick methods and smart tips to boost your spreadsheet workflow.

Google Sheets9 min read

Business Expenses Spreadsheet: Improving Insights

A spreadsheet for business expenses helps track and manage company costs. Click here to learn how to build one, analyze data, and boost financial control.

Google Sheets8 min read

Debt Tracker in Google Sheets: A Complete Guide

A debt tracker Google Sheet helps you manage and monitor debt easily. Learn how to build, customize, and analyze it for smarter financial decisions.

ChartExpo logo

Turn Data into Visual
Stories

CHARTEXPO

  • Home
  • Gallery
  • Videos
  • Services
  • Pricing
  • Contact us
  • FAQs
  • Privacy policy
  • Terms of Service
  • Sitemap

TOOLS

  • ChartExpo for Google Sheets
  • ChartExpo for Microsoft Excel
  • Power BI Custom Visuals by ChartExpo
  • Word Cloud

CATEGORIES

  • Bar Charts
  • Circle Graphs
  • Column Charts
  • Combo Charts
  • Comparison Charts
  • Line Graphs
  • PPC Charts
  • Sentiment Analysis Charts
  • Survey Charts

TOP CHARTS

  • Sankey Diagram
  • Likert Scale Chart
  • Comparison Bar Chart
  • Pareto Chart
  • Funnel Chart
  • Gauge Chart
  • Radar Chart
  • Radial Bar Chart
  • Sunburst Chart
  • see more
  • Scatter Plot Chart
  • CSAT Survey Bar Chart
  • CSAT Survey Chart
  • Dot Plot Chart
  • Double Bar Graph
  • Matrix Chart
  • Multi Axis Line Chart
  • Overlapping Bar Chart
  • Control Chart
  • Slope Chart
  • Clustered Bar Chart
  • Clustered Column Chart
  • Box and Whisker Plot
  • Tornado Chart
  • Waterfall Chart
  • Word Cloud
  • see less

RESOURCES

  • Blog
  • Resources
  • YouTube
SIGN UP FOR UPDATES

We wouldn't dream of spamming you or selling your info.

© 2025 ChartExpo, all rights reserved.