Categories
Projects move fast. People move faster. Your notes fall behind. A Construction Project Daily Report Template brings order to that chaos. You record the day. You capture work done, hours spent, weather, visitors, and issues. You protect your schedule and your budget.


You need a repeatable method. You need one source that anyone can read. A Construction Project Daily Report Template gives you that method. It sets the field team and the office on the same page. It also builds a record you can use for billing or claims.
This file works in Google Sheets. You can share it. You can filter by date or trade. You can spot delays before they grow. You can pair it with charts to see trends. You get proof and progress in one place.
You track people and pay too. Use payroll spreadsheet templates to record hours and rates so your wage runs stay clean and on time. This saves rework and supports your reports with clear pay data.
What about time tracking at the task level? Your Construction Project Daily Report Template works best when time logs are simple. You can pull that time from your crews without hassle. You get a clear view of labor by trade and task.
You also want to reduce repeats and misses. This template sets fixed fields. You collect the same details each day. You can add photos. You can add notes for incidents. You can add follow-ups so tomorrow’s crew stays ready.
Definition: A Construction Project Daily Report Template is a ready form. You use it to record the entire workday. It captures the site, date, weather, work performed, materials used, equipment status, and any incident. It keeps all teams aligned.
You can build it in Sheets and keep it in the cloud. Your team fills it on phones or laptops. You can lock the fields that must be present. You can sort by date or foreman. You can view totals for the week or the month.
Place time tracking next to work notes. A Google spreadsheet timesheet template helps your crews record start and stop times with simple fields. This supports your daily report with clean, summarized hours you can filter by person and trade.
Use one more line in this section for precision. The phrase construction daily report template points to the base document you complete each day to keep a record of activity, people, and changes, and you can visualize trends using a Waterfall chart in Google Sheets.
You also need space for visitors, deliveries, and delays. Add checkboxes to speed input. Add a notes field for exceptions. Add a photo field for evidence after incidents or inspections.
Daily reporting sets the ground rules. You collect the same details each day. You track progress and problems in one place. You can show what happened and when. You can support pay apps and claims with facts.
Sales teams send their own numbers. You can align field results with upstream revenue. A commission spreadsheet template helps sales leads log credits while your site logs work. Together, these records give you a full picture of cost and progress.
Use one clear phrase in this section. The term construction daily report means your day-by-day record of activity, resources, safety notes, and changes. This proof helps you meet regulatory needs and close disputes fast.
Consistency beats memory. You cannot trust the recall at the end of the month. You can trust a form filled each day. You can pull trends for weather holds, equipment failures, and overtime. You can move crews to match needs.
Your report needs the date and project details. Add weather. Add work performed. Add materials used and equipment status. Add labor counts and hours. Add safety notes and any incidents. Add visitors and subcontractors on site. Add issues and fixes.
Put labor and cost next to each other. A Google Sheets profit and loss template helps you compare planned costs against recorded hours and material usage from your daily forms. You connect field notes to cost control without extra work.
Write short notes with action verbs. Use standard names for trades and areas. Use clear labels for tasks and milestones. Add a link to photos. Mark any holds and who approved them. Add punch items that flow into tomorrow.
Pick a platform. Google Sheets fits teams that need sharing and quick edits. Set tabs for daily logs, crews, equipment, and weather. Protect cells that hold formulas. Keep input fields simple.
Define fields. Date, site, weather, work done, labor hours, materials used, equipment status, issues, visitors, safety notes, and photos. Add dropdowns for trades and tasks. Add data validation for dates and hours. Keep text fields for notes.
Use count and sum formulas to total hours and quantities. Use data validation to reduce typos. Use filters to show one crew at a time. Keep the layout clean so crews can complete it on mobile.
Plan for staff changes. Succession planning templates help you document roles and handoffs so new leads can keep the same report flow with no gaps. This reduces rework and guards your reporting method.
A Construction Project Daily Report Template built this way will track the workday without friction. It will also scale with more crews. It will support both field and office teams.
Top 5 ChartExpo for Construction Project Daily Report Template Visuals in Google Sheets
Charts turn notes into action. They give your team a fast read and reveal patterns without scrolling through rows. Pair your Construction Project Daily Report Template with visuals, including a Scatter plot in Google Sheets, so you spot issues and move resources fast.
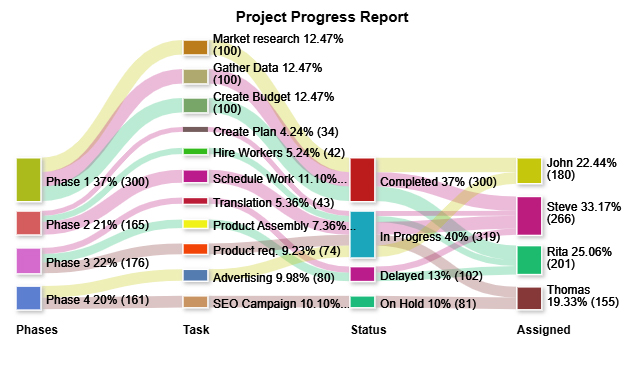
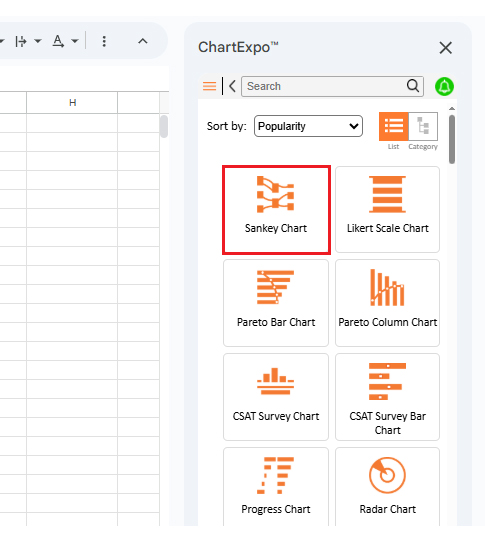
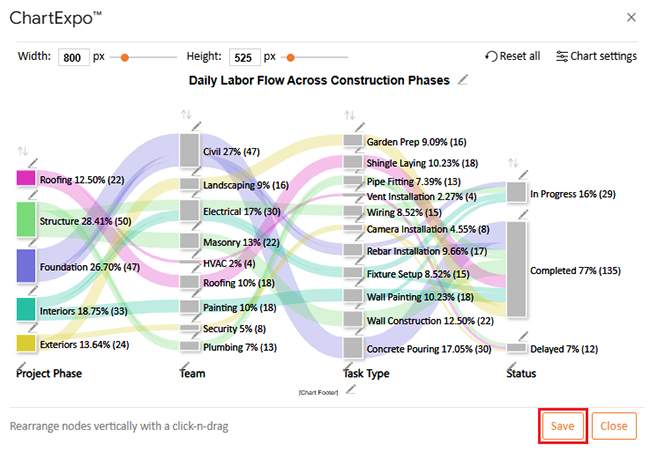
You select a Sankey chart to show flows across phases. You see how hours move from phase to phase. You see where work finishes and where it stalls. You can act on bottlenecks with a quick look.
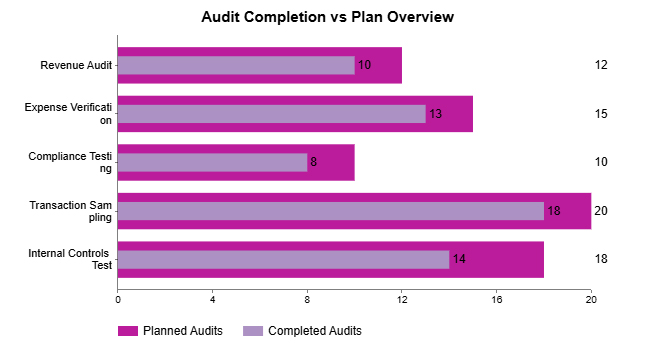
You compare the plan and actual with a bar chart. You see gaps by task or area. You see where crews meet targets and where they fall short. You can shift people or orders to recover time.
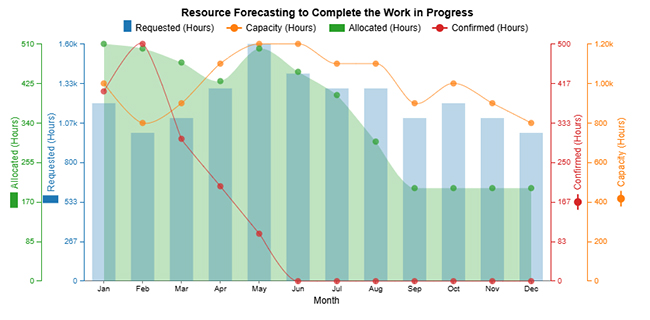
You track multiple metrics on one plot. A multi-axis line chart lets you see requested, allocated, and confirmed hours on one view. You can spot gaps or overlaps in staffing at once.
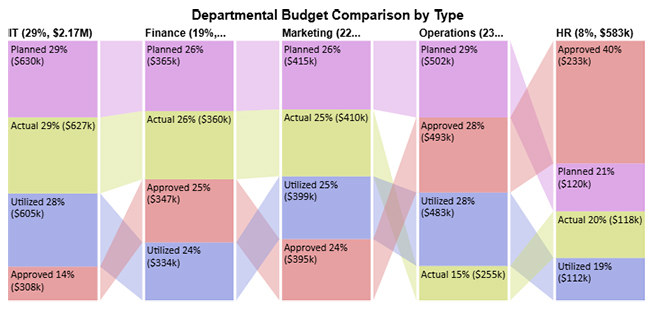
You also place the plan and actual side by side with an overlapping bar chart. You see slippage without reading a table. You can move tasks or add crews to close the gap.
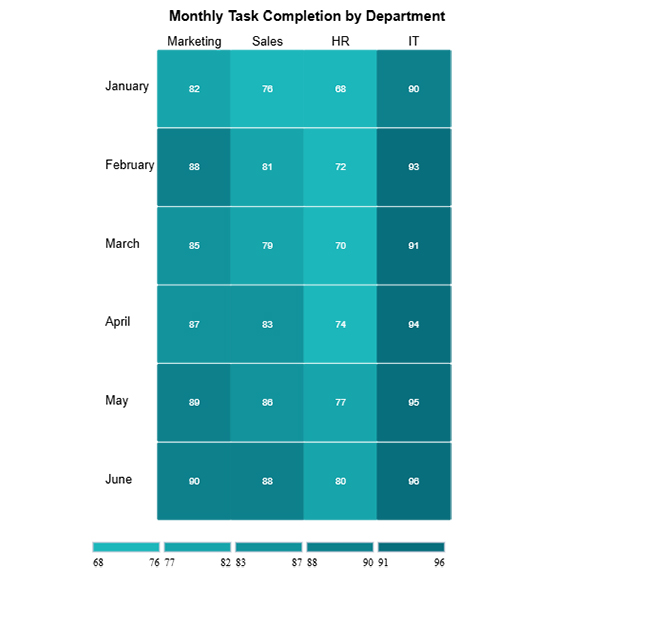
A heatmap shows hot spots by day, area, or trade. You see clusters of delays. You see periods with heavy hours. You can plan inspections and deliveries to match the load.
You now walk through five visuals with step-by-step context.
Your Sheet holds the raw notes. You now need summary sheets and visuals. Create pivot tables for hours by phase, crew, and status. Build charts for trends across days and tasks. Share the file so everyone can view the same facts.
Keep your goals tight. Use filters for date ranges and trades. Build a dashboard tab that reports totals, delays, and safety notes. Set data validation so the inputs stay clean. Protect formulas.
A Construction Project Daily Report Template gives you a repeatable base for this analysis. It links field entries to simple charts, including a Pareto chart. It supports updates with no extra software and no training load.
Why Use ChartExpo?
You need visuals that your team can set up fast. You need an add-on that lives inside Sheets. You want range selections and clear chart types. You want editing tools that feel simple.
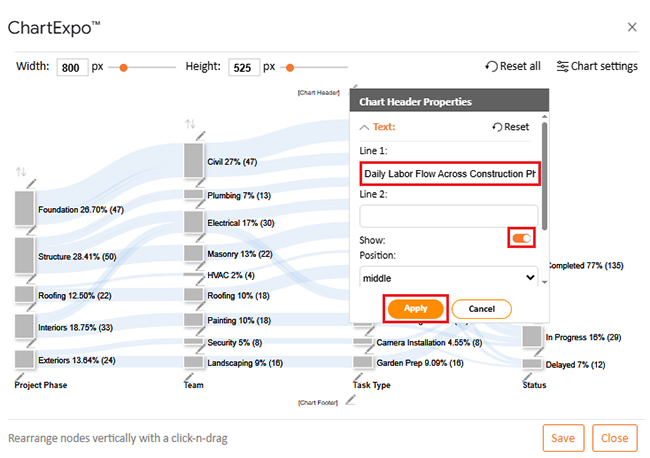
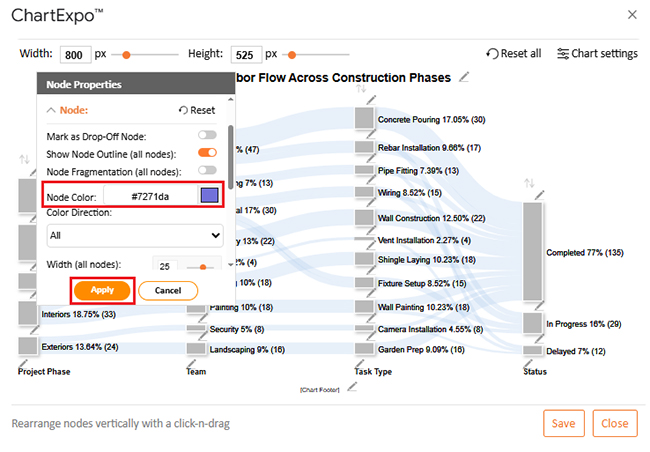
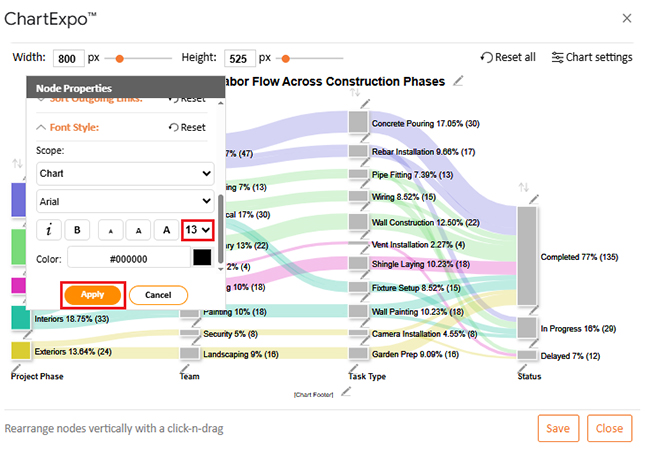
The tool covers many chart types. You can pick the best visual for each question. You can change titles, labels, and nodes. You can change fonts and colors. You can save changes for later use.
You also get a free trial period and a low monthly cost after that. You can test charts on your current logs. You can move ahead with the ones that help.
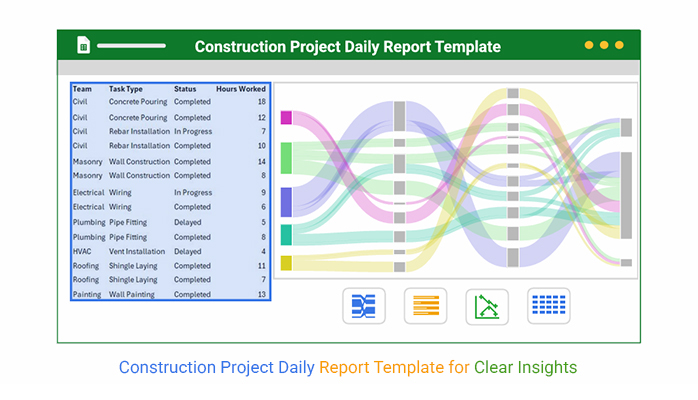
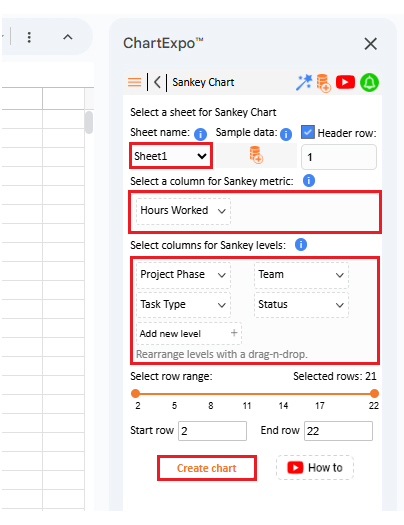
You will now build a Sankey diagram that reads your log. Here is the data setup used for the walk-through. The table holds phase, team, task type, status, and hours.
You will place this grid on a Sheet and point the chart to it. The goal is to track how hours flow across phases and statuses.
The view will show where hours end up and where they stall. You can then reassign crews to match the flow.
| Project Phase | Team | Task Type | Status | Hours Worked |
| Foundation | Civil | Concrete Pouring | Completed | 18 |
| Foundation | Civil | Concrete Pouring | Completed | 12 |
| Foundation | Civil | Rebar Installation | In Progress | 7 |
| Foundation | Civil | Rebar Installation | Completed | 10 |
| Structure | Masonry | Wall Construction | Completed | 14 |
| Structure | Masonry | Wall Construction | Completed | 8 |
| Structure | Electrical | Wiring | In Progress | 9 |
| Structure | Electrical | Wiring | Completed | 6 |
| Structure | Plumbing | Pipe Fitting | Delayed | 5 |
| Structure | Plumbing | Pipe Fitting | Completed | 8 |
| Roofing | HVAC | Vent Installation | Delayed | 4 |
| Roofing | Roofing | Shingle Laying | Completed | 11 |
| Roofing | Roofing | Shingle Laying | Completed | 7 |
| Interiors | Painting | Wall Painting | Completed | 13 |
| Interiors | Painting | Wall Painting | In Progress | 5 |
| Interiors | Electrical | Fixture Setup | In Progress | 8 |
| Interiors | Electrical | Fixture Setup | Completed | 7 |
| Exteriors | Landscaping | Garden Prep | Completed | 10 |
| Exteriors | Landscaping | Garden Prep | Completed | 6 |
| Exteriors | Security | Camera Installation | Delayed | 3 |
| Exteriors | Security | Camera Installation | Completed | 5 |
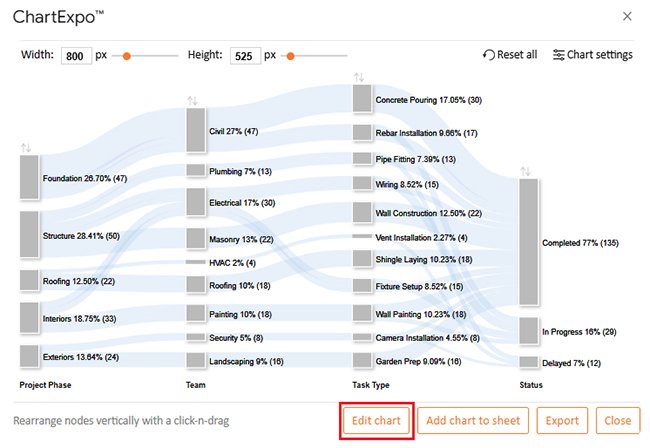
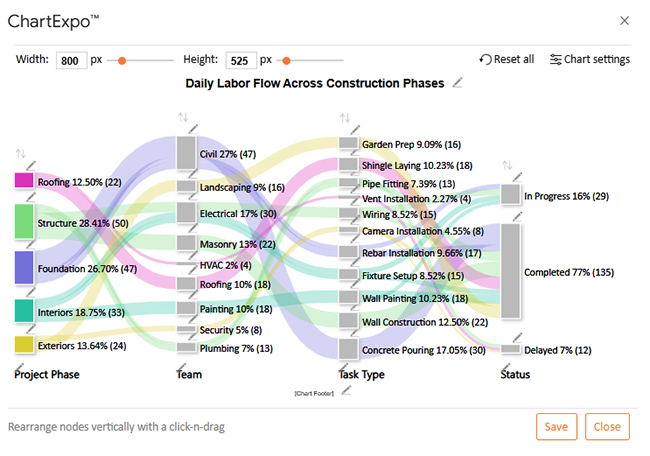
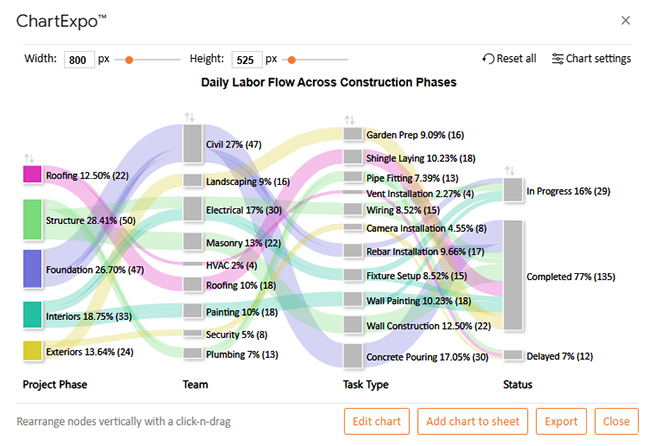
The structure and foundation phases draw most of the hours. You can test this by filtering to those phases and watching the thickest links remain on top. This shows where crews spend time and where to shift staff when other phases run thin.
Civil and electrical contribute the most total hours. You can verify by sorting hours by team within the dataset and by checking the legend when you color nodes by team. This helps you plan relief crews for peak loads.
Wall construction and concrete pouring hold the largest task shares. You can see this in the central node breakdown and by checking totals by task type. These points focus on inspection timing and material orders for these tasks.
Completed work holds 77 percent of total hours, while work in progress holds 16 percent, and delayed holds 7 percent. You can confirm by grouping by status. This tells you where to place the foreman’s attention and when to call suppliers.
Pipe fitting and vent installation show frequent delays. You can sort by status within those tasks and see higher delayed counts. This signals a need to check dependencies, staging, or inspection timing for those areas.
Set up the template with your fields. Keep the structure the same each day. Record work, hours, materials, visitors, and safety. Add photos for context. Review totals each day with your team.
Keep the log in the cloud so everyone can view it. Set filters by date and trade. Share across subs so they see today’s plan. Store files by week for quick lookup. A Construction Project Daily Report Template gives you this foundation.
Keep finance aligned. A balance sheet template in Google Sheets helps your office track assets and liabilities, while your field logs show work and hours. This helps cash flow planning and cuts end-of-month stress.
Use the phrase here once. The term construction daily log template means your day-by-day file that crews fill to record tasks, people, and events without missing key items.
It saves time. Fixed fields cut typing and rework. Checklists speed input. Dropdowns reduce errors. Photos add proof for claims and safety.
It raises precision. You capture the same details each day. You see trends in delays and weather. You pull totals for hours, tasks, and incidents. You keep a record for billing and audits.
It improves communication. Field and office use the same view. Subs know what is next. Clients see progress with facts. A Construction Project Daily Report Template makes this clear and repeatable.
General contracting teams track milestones. They record deliveries, lifts, pours, and inspections. They check the weather and permits. They keep all parties aligned. They support pay apps with daily facts.
Specialty crews work across many areas. A consistent method keeps schedules tight across handoffs. A project status reports template helps office staff roll up daily notes into a weekly view for the client. Your field notes feed those summaries.
Use one matching phrase here. The term construction daily report format means the layout of fields and sections you use each day to capture progress, safety, and issues in a repeatable way.
Claims also need proof. Your logs show who was there, what work was done, and what blocked it. Your photos show conditions. Your timestamps show duration. This record helps settle questions fast.
Fill the report on site, not at day’s end. Use phones or tablets for speed. Add photos for incidents and inspections. Record names for visitors and subs. Log weather with source and time.
Keep text short and clear. Avoid jargon. Use standard names for trades and phases. Record times and approvals for any hold or change. Mark follows up so nothing slips.
Store your logs in one file with tabs. Set access by role. Back up weekly. Review trends by week. A Construction Project Daily Report Template helps you stay on track without new tools.
Start with a Construction Project Daily Report Template. Add date, site, and weather. List work performed by area and trade. Record labor counts with hours. Add materials and equipment status. Note safety events and visitors. Attach photos and approvals. Review with the foreman at close.
It is the task log within your daily report. You list each task, who worked on it, and how long it took. You note issues that blocked progress and any fixes. You tie each task to a phase. You track completion, so tomorrow’s plan stays real.
Daily forms can feel dull, yet they win projects. A Construction Project Daily Report Template turns notes into action. You capture the day. You see the work. You spot delays. You move crews with facts. You protect pay and schedule.
Build the template in Google Sheets. Keep fields tight. Use dropdowns, checks, and simple inputs. Add charts that make patterns clear. Share the file so every foreman and manager sees the same truth. Your site runs on shared information.
Use your new logs to support billing and claims. Tie hours to tasks. Tie tasks to phases. Tie photos to incidents. Your record keeps disputes short. Your data supports your schedule pull plans.
You now have the map. Put the Construction Project Daily Report Template in place. Train your leads to fill it during the shift. Review the dashboard each day. Catch slips early. Keep momentum through closeout.
How much did you enjoy this article?


Calculate accounts receivable turnover ratio to measure credit collection speed, improve cash flow, and strengthen your financial strategy. Read on!

Change Management KPIs are the key to tracking adoption, performance, and ROI during transitions. Find out which metrics matter. Read on!

Data collection methods and techniques determine the quality of every insight you act on. Explore key approaches for gathering reliable data. Read on!


