• Home
  • Tools dropdown img
    • Spreadsheet Charts

      • ChartExpo for Google Sheets
      • ChartExpo for Microsoft Excel
    • Power BI Charts

      • Power BI Custom Visuals by ChartExpo
    • Word Cloud

  • Charts dropdown img
    • Chart Category

      • Bar Charts
      • Circle Graphs
      • Column Charts
      • Combo Charts
      • Comparison Charts
      • Line Graphs
      • PPC Charts
      • Sentiment Analysis Charts
      • Survey Charts
    • Chart Type

      • Box and Whisker Plot
      • Clustered Bar Chart
      • Clustered Column Chart
      • Comparison Bar Chart
      • Control Chart
      • CSAT Survey Bar Chart
      • CSAT Survey Chart
      • Dot Plot Chart
      • Double Bar Graph
      • Funnel Chart
      • Gauge Chart
      • Likert Scale Chart
      • Matrix Chart
      • Multi Axis Line Chart
      • Overlapping Bar Chart
      • Pareto Chart
      • Radar Chart
      • Radial Bar Chart
      • Sankey Diagram
      • Scatter Plot Chart
      • Slope Chart
      • Sunburst Chart
      • Tornado Chart
      • Waterfall Chart
      • Word Cloud
    • Google Sheets
      Microsoft Excel
  • Services
  • Pricing
  • Contact us
  • Blog
  • Support dropdown img
      • Gallery
      • Videos
      • Contact us
      • FAQs
      • Resources
    • Please feel free to contact us

      atsupport@chartexpo.com

Categories
All Data Visualizations Data Analytics Surveys
Add-ons/
  • Google Sheets
  • Microsoft Excel
  • Power BI
All Data Visualizations Data Analytics Surveys
Add-ons
  • Google Sheets
  • Microsoft Excel
  • Power BI

We use cookies

This website uses cookies to provide better user experience and user's session management.
By continuing visiting this website you consent the use of these cookies.

Ok

ChartExpo Survey


Home > Blog > Google Sheets

Commission Spreadsheet Template: An Easy Guide

Why should you care about a commission spreadsheet template? Manually managing commissions is time-consuming and prone to errors. Sales teams thrive on accuracy and efficiency, and with a commission spreadsheet template, tracking payments becomes seamless.

Commission Spreadsheet Template

Businesses lose billions annually due to payroll errors. However, a well-designed commission spreadsheet template minimizes these risks. It automates calculations, tracks performance, and generates reports effortlessly.

This isn’t just about numbers; it’s about trust and transparency between employers and employees. For deeper insights, you can pair this template with a business intelligence dashboard. This dashboard will help you visualize trends and patterns better.

Using a commission spreadsheet template also boosts productivity. Instead of spending hours crunching numbers, you can focus on growing your business. Need to gather feedback on your commission structure? Try a free questionnaire maker to collect valuable input from your team.

A commission spreadsheet template ensures fairness and motivates your team to perform better. It’s a win-win for everyone. Even better, learn what aggregated data is. This knowledge will help you understand your template and use it more effectively.

In a fast-paced business environment, tools that streamline processes are invaluable. A commission spreadsheet template is one such tool. It’s practical, efficient, and essential for any organization handling commissions.

Ready to see the difference it can make?

Let’s dive in.

Table of Contents:

  1. What is a Commission Sheet Template?
  2. Why Should You Use a Commission Spreadsheet Template?
  3. How Does a Sales Commission Tracking Spreadsheet Help?
  4. How to Create a Commission Spreadsheet?
  5. How to Analyze a Commission Spreadsheet Template?
  6. Advantages and Disadvantages of a Commission Spreadsheet
  7. Best Practices for Using a Commission Tracking Template
  8. FAQs
  9. Wrap Up

What is a Commission Sheet Template?

Definition: A commission sheet template is a pre-designed tool for tracking and calculating sales commissions. It simplifies the process by automating calculations and organizing data. Businesses use it to ensure accurate and timely payments.

The template typically includes fields for sales figures, commission rates, and employee details. It reduces errors and saves time. Using VLOOKUP for Google Sheets helps quickly retrieve commission data, making calculations even more efficient. Many templates also generate reports for better insights. Whether managing a small team or a large sales force, a commission sheet template keeps everything organized.

Why Should You Use a Commission Spreadsheet Template?

Why should you use a commission spreadsheet template? Because it’s a game-changer for accuracy, efficiency, and transparency. It also helps track business overhead costs, ensuring commissions don’t impact profitability. Let’s break it down.

  • Accurate commission calculations: Manual calculations often lead to costly errors, frustrating employees and employers. A commission spreadsheet template eliminates guesswork, ensuring every payment is precise and reliable.
  • Time-saving and efficient: Spending hours on manual calculations drains productivity and slows operations. Automating the process with a template frees up time for strategic tasks.
  • Clear performance tracking: Understanding individual and team performance is crucial for growth and motivation. This template provides clear metrics, helping you identify top performers and areas for improvement.
  • Transparency and accountability: Employees trust systems that are fair and easy to understand. It ensures everyone knows how their earnings are calculated, reducing disputes.
  • Data-driven insights: Numbers tell a story, and a good template helps you interpret it. Spot trends, set goals, and make informed decisions with organized, actionable data.
  • Customizable and scalable: Every business is unique, and your tools should adapt to your needs. Whether you’re managing five people or fifty, a commission spreadsheet template grows with you.

How Does a Sales Commission Tracking Spreadsheet Help?

Why should you use a sales commission tracking spreadsheet? It solves real problems and makes your life easier. It also streamlines calculations, much like learning how to use Google Sheets improves efficiency in managing data. Here are the key benefits.

  • Accurate earnings calculation: Manual calculations often lead to errors and frustration. This spreadsheet ensures every commission is calculated correctly, keeping employees and employers happy.
  • Performance monitoring made simple: Track individual and team performance with ease. Clear metrics help you identify strengths and areas for improvement, driving better results.
  • Save time and boost efficiency: Automating calculations frees up hours in your workweek. You’ll spend less time on spreadsheets and more time growing your business.
  • Transparency builds trust: Clear, accessible data ensures everyone understands how commissions are calculated. This reduces disputes and fosters a culture of fairness.
  • Spot trends and make smarter decisions: Analyze sales patterns and uncover insights with organized data. A spreadsheet helps you plan strategically and stay ahead of the curve.
  • Customizable, flexible, and motivating: Adapt the tool to fit your unique needs, regardless of team size. Transparent, timely payments keep your team motivated and productive.

How to Create a Commission Spreadsheet?

Why create a commission spreadsheet? Because it’s a simple, powerful way to streamline your sales process. It also helps track gross annual sales, ensuring accurate commission calculations and better financial planning. Let’s walk through the steps to build one that works for you.

  1. Open a spreadsheet tool: Open Excel, Google Sheets, or any other tool you prefer. You will have a blank canvas.
  2. Set up the columns: Create columns for key details like employee names, sales figures, and commission rates. Keep it organized and easy to follow.
  3. Input sales data: Add your sales data manually or import it from another system. Accuracy here ensures reliable calculations later.
  4. Apply formulas: Use formulas to automate commission calculations. This saves time and reduces the risk of errors.
  5. Add totals and summaries: Include rows for totals and summaries. This gives you a clear overview of earnings and performance.
  6. Format for clarity: Use colors, borders, and fonts to make the spreadsheet easy to read. A clean layout improves usability.
  7. Optional enhancements: Add charts, graphs, or conditional formatting for deeper insights. These extras can make your spreadsheet even more powerful.
  8. Save and share: Save your work and share it with your team. A well-built commission spreadsheet keeps everyone informed and aligned.

How to Analyze a Commission Spreadsheet Template?

Why should you use a commission spreadsheet template? Because spreadsheets are the unsung organization heroes—until you need to make sense of the data. Google Sheets functionality makes number crunching easier, but let’s be honest, its data visualization game is weak.

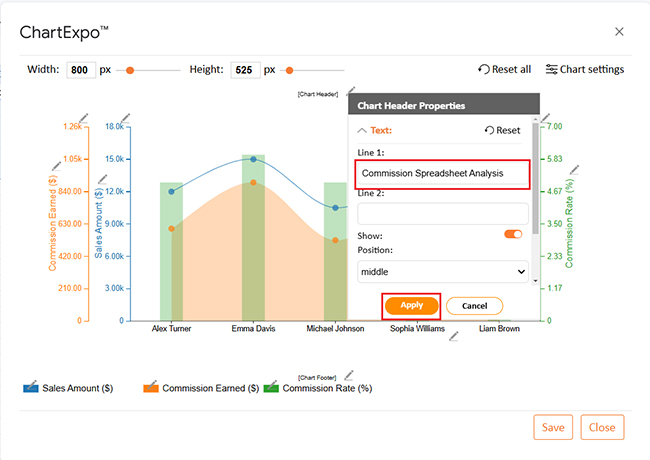
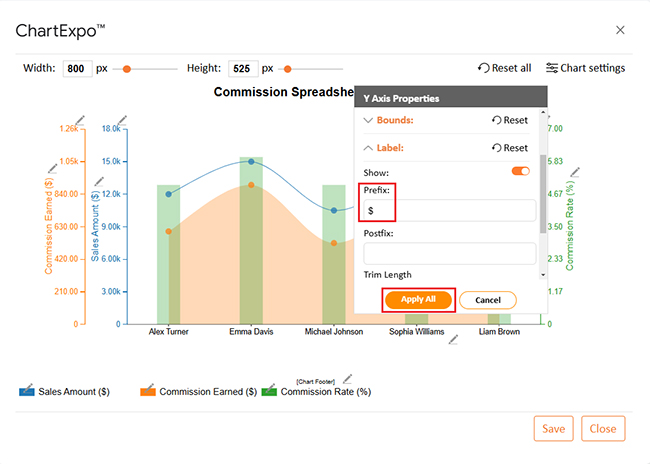
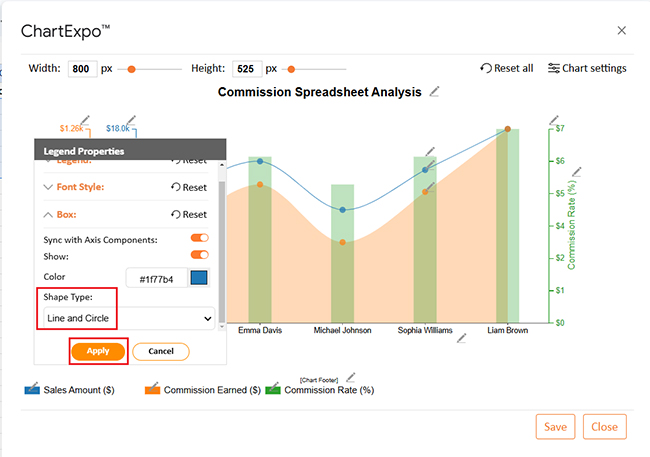
Enter ChartExpo, the superhero of data storytelling. It turns dull rows and columns into vibrant, easy-to-read charts and graphs. Say goodbye to squinting at confusing spreadsheets and hello to clear, actionable insights.

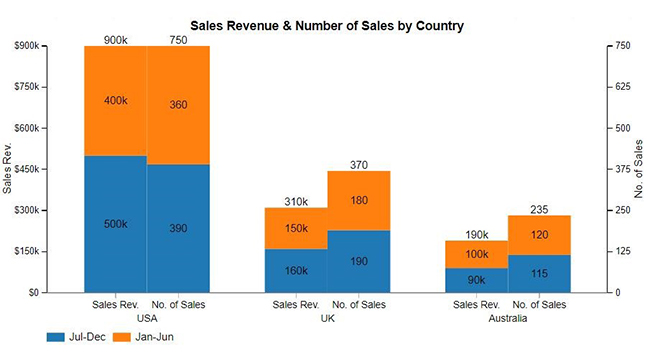
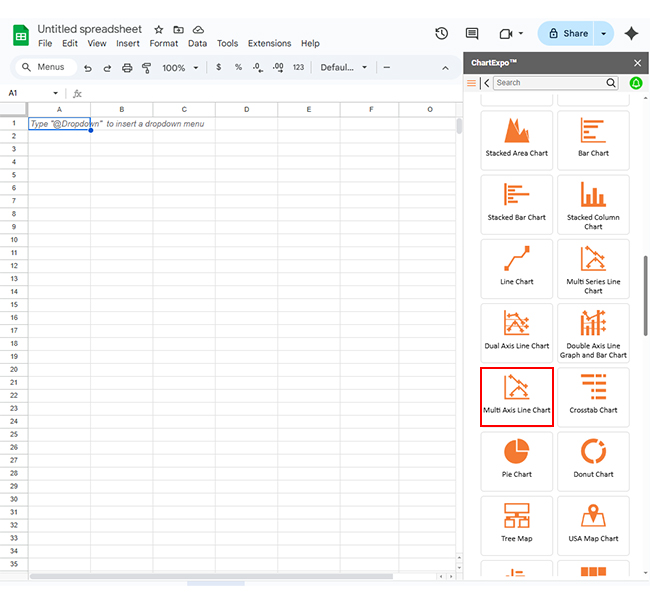
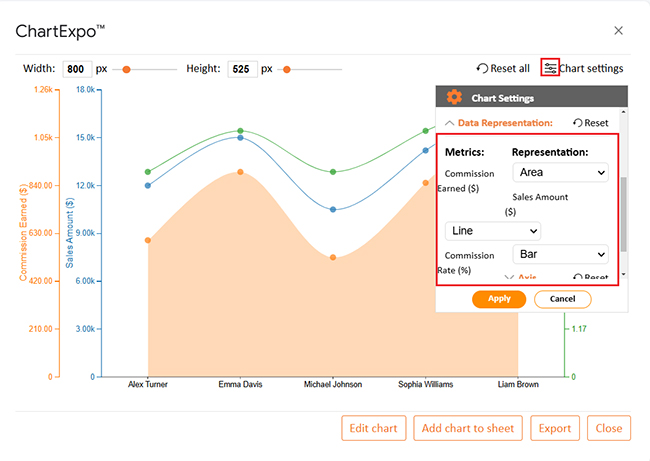
The charts below were created in Excel using ChartExpo:

Multi-Axis Line Chart

Commission Spreadsheet Template

Progress Circle Chart

Commission Spreadsheet Template

Comparison Bar Chart

Commission Spreadsheet Template

Double Bar Graph

Commission Spreadsheet Template

Clustered Stacked Bar Chart

Commission Spreadsheet Template

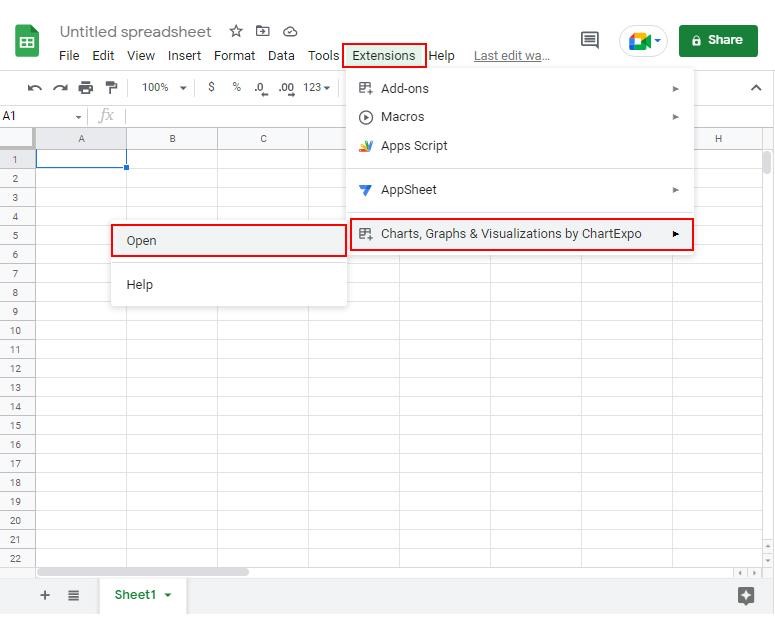
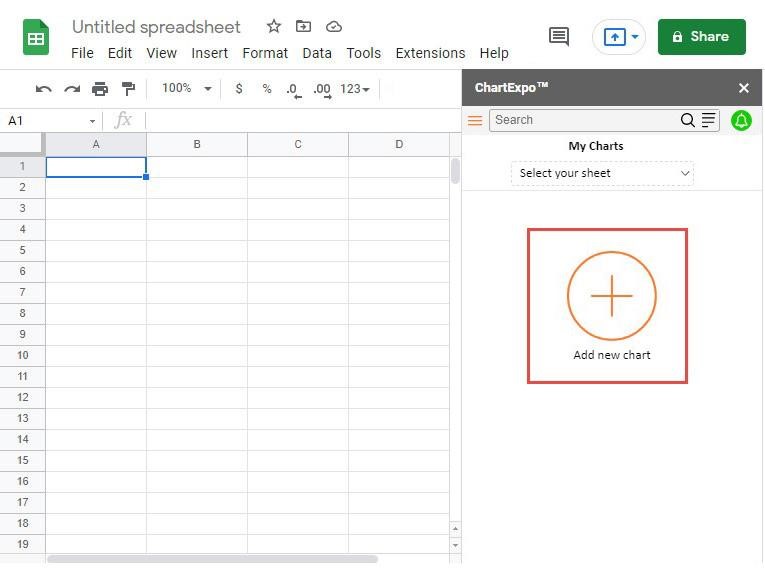
How to Install ChartExpo in Excel?

  1. Open your Excel application.
  2. Open the worksheet and click the “Insert” menu.
  3. You’ll see the “My Apps” option.
  4. In the Office Add-ins window, click “Store” and search for ChartExpo on the My Apps Store.
  5. Click the “Add” button to install ChartExpo in your Excel.

ChartExpo charts are available both in Google Sheets and Microsoft Excel. Please use the following CTAs to install the tool of your choice and create beautiful visualizations with a few clicks in your favorite tool.

Example

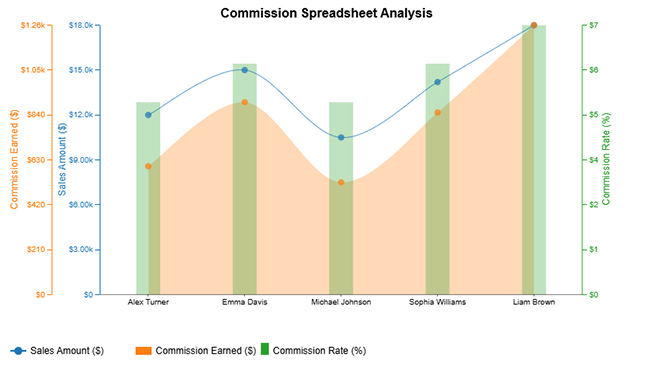
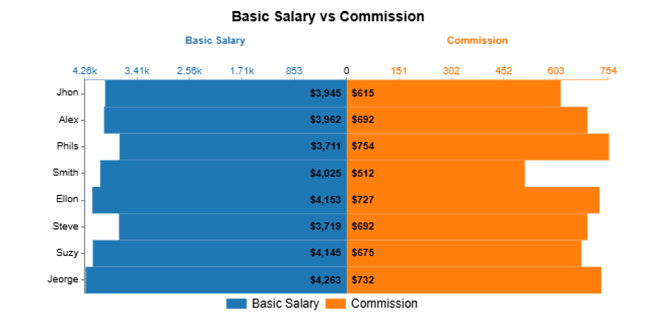
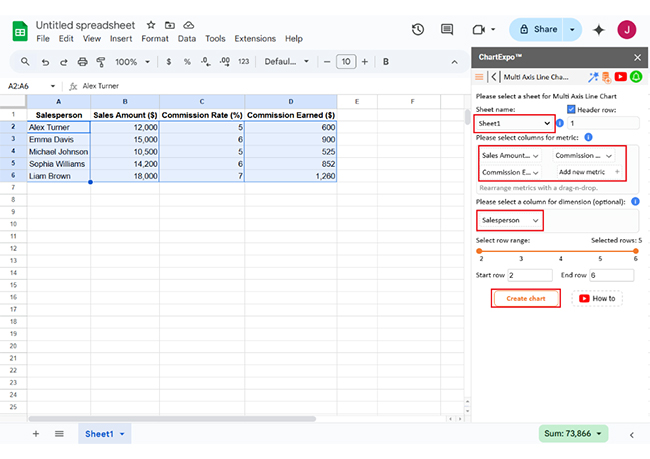
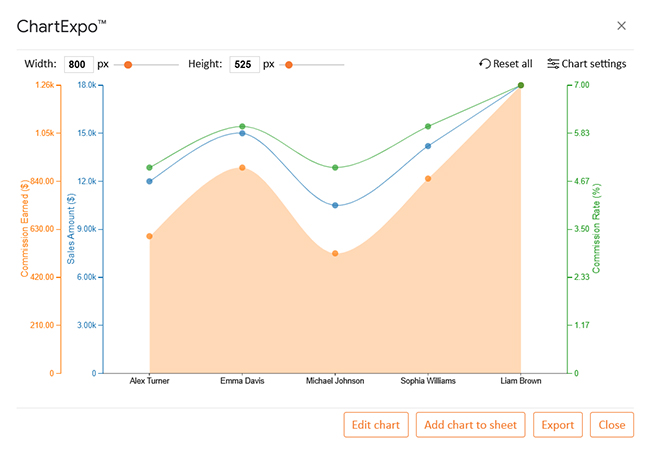
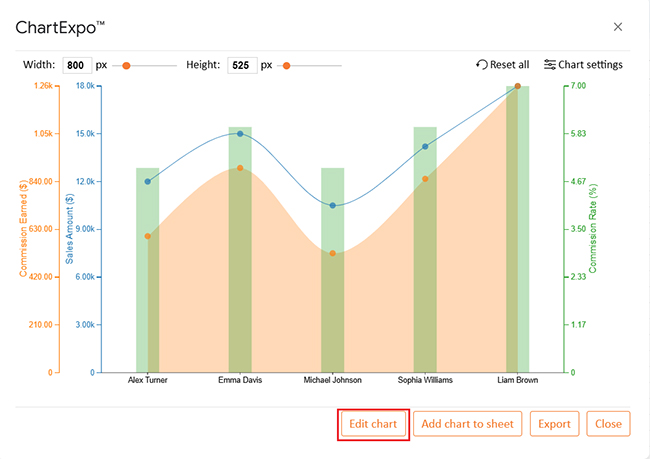
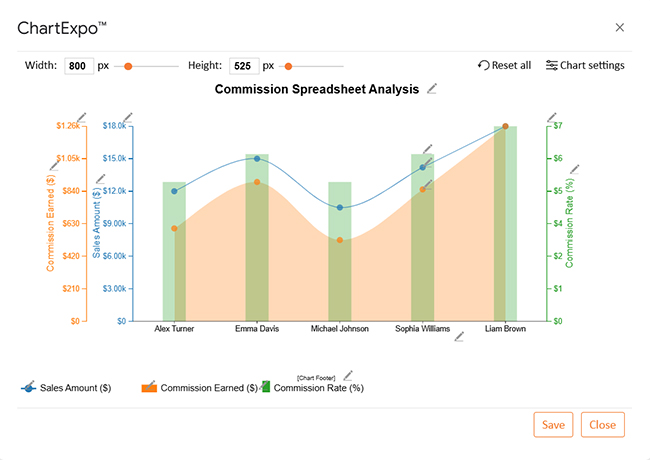
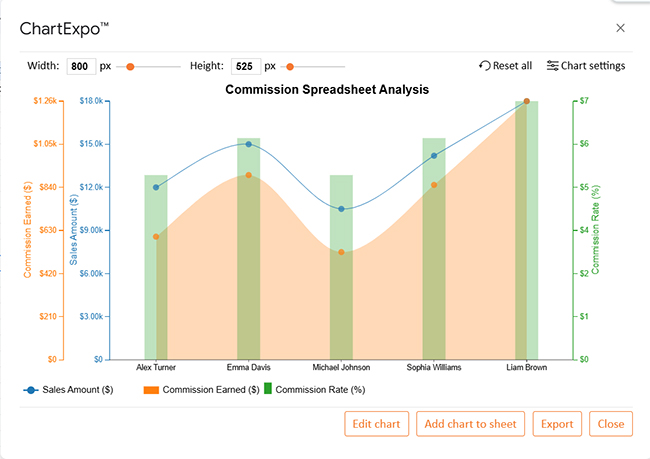
Let’s analyze this sample data and learn how to share a Google Sheet using ChartExpo.

Salesperson Sales Amount ($) Commission Rate (%) Commission Earned ($)
Alex Turner 12,000 5 600
Emma Davis 15,000 6 900
Michael Johnson 10,500 5 525
Sophia Williams 14,200 6 852
Liam Brown 18,000 7 1,260
  • To get started with ChartExpo, install ChartExpo in Google Sheets.
  • Go to Extensions > Charts, Graphs & Visualizations by ChartExpo > Open.
Commission Spreadsheet Template
  • To access the charts library, click the Add new chart button.
Commission Spreadsheet Template
  • Once it loads, scroll through the charts list to locate and choose the “Multi-Axis Line Chart”.
Commission Spreadsheet Template
  • Click the “Create Chart From Selection” button after selecting the data from the sheet, as shown.
Commission Spreadsheet Template
  • Your Multi Axis Line Chart will appear below.
Commission Spreadsheet Template
  • If you want to add anything to the chart, click the Edit Chart button:
Commission Spreadsheet Template
  • Click on Settings and change the “Data Representation” as follows.
Commission Spreadsheet Template
  • Click the pencil icon next to the Chart Header to change the title.
  • It will open the properties dialog. Under the Text section, you can add a heading in Line 1 and enable Show.
  • Give the appropriate title of your chart and click the Apply button.
Commission Spreadsheet Template
  • You can add the Dollar Sign ($) with all values and also change the precision value to zero as follows:
Commission Spreadsheet Template
  • Change the Legend shape of Sales Amount into Line and Circle, and click “Apply”:
Commission Spreadsheet Template
  • Change the Legend shape of Commission Rate into Line and Circle, and click “Apply”:
Commission Spreadsheet Template
  • After making all the changes, click on the “Save” button as follows:
Commission Spreadsheet Template
  • Your final Multi Axis Line Chart will look like the one below.
Commission Spreadsheet Template

Insights

  • Liam Brown had the highest sales and commission.
  • Michael Johnson had the lowest sales and commission.
  • Higher sales generally lead to higher commission rates, encouraging better performance.

Advantages and Disadvantages of a Commission Spreadsheet

Why a commission spreadsheet? It ensures accurate calculations and generates reports on financial analysis for better decision-making. However, manual entry can cause errors, and scalability becomes a challenge as your business grows.

Let’s explore its positives and negatives.

Advantages:

  • Accurate and efficient calculations: A commission spreadsheet ensures precise payments while saving time. Automation minimizes errors and lets you focus on growing your business.
  • Clear performance insights and transparency: Track sales performance and share transparent data with your team. This builds trust and keeps everyone motivated and aligned.
  • Customizable and budget-friendly: Tailor the spreadsheet to fit your unique needs without spending a fortune. It’s a flexible, affordable solution for businesses of all sizes.
  • Data analysis made easy: Use built-in tools to uncover trends and make smarter decisions. A spreadsheet turns raw numbers into actionable insights.
  • Scalability and security considerations: A commission spreadsheet template offers scalable, secure tracking. It adapts to business growth while protecting sensitive data with organized, efficient, and customizable features.

Disadvantages:

  • Manual data entry risks: Human errors are inevitable when entering data manually. A single mistake can lead to incorrect payments and frustrated employees.
  • Limited scalability: Spreadsheets work well for small teams but struggle with larger datasets. As your business grows, the system can become overwhelming and inefficient.
  • Security risks: Spreadsheets are vulnerable to unauthorized access or accidental deletions. Sensitive data, like employee earnings, needs better protection.
  • Lack of advanced automation: While basic formulas help, spreadsheets can’t fully automate complex processes. This limits their efficiency for larger or more dynamic teams.
  • Version control issues: Multiple versions of the same spreadsheet can confuse. Without proper management, keeping everyone on the same page becomes a challenge.

Best Practices for Using a Commission Tracking Template

Tracking commissions keeps your sales team motivated and organized. Using Google Finance in Google Sheets can enhance your template by pulling real-time financial data. Here are the five best practices for using a commission tracking template:

  • Set clear commission structures: Define commission rates, tiers, and bonuses so everyone knows how earnings are calculated. A clear structure avoids confusion and keeps motivation high.
  • Automate calculations: Use formulas for automatic commission calculations. Google Spreadsheet integration ensures accuracy and saves time.
  • Keep data accurate and updated: Promptly enter sales and commission data to prevent discrepancies. Regular updates help track performance and ensure fair payouts.
  • Secure and backup: Protect the sheet with access controls to prevent unauthorized changes. Regularly back up data to avoid losing important records.
  • Collaborate and audit: Use cloud tools for easy sharing while maintaining version control. Periodic audits help catch errors and ensure commission calculations remain fair and transparent.

FAQs

How do you structure a commission sheet?

A commission sheet includes key details: salesperson name, sales amount, commission rate, and total commission earned. Use clear columns for easy tracking. Add date ranges for accuracy. And automate calculations if possible.

How do you make a commission sheet on Google Sheets?

  • Open Google Sheets and create a new sheet.
  • Label columns: Salesperson, Sales Amount, Commission Rate, and Commission Earned.
  • Use formulas (e.g., =B2*C2) for automatic calculations.
  • Apply formatting for clarity.
  • Share securely with the team.

Wrap Up

A commission spreadsheet template is a game-changer for businesses. It simplifies complex calculations, ensuring accuracy every time. There will be no more errors or disputes over payments, which builds trust and keeps your team motivated.

Time is precious, and this template saves plenty of it. Automating calculations saves time, letting you focus on business growth instead of manual number crunching. Understanding what data profiling is helps refine commission structures by analyzing sales data for accuracy.

Transparency is key to a healthy work environment. A commission spreadsheet template makes earnings clear and understandable. Employees know exactly how their commissions are calculated. You can use IMPORTANCE in Google Sheets to create structured data for better tracking and organization.

With this template, performance tracking becomes effortless. You can easily monitor individual and team progress, identify top performers, and identify improvement areas. Data-driven insights help you make smarter decisions. SMART KPIs Examples guide businesses in setting measurable goals for their sales teams.

Customization is another major advantage. Tailor the template to fit your unique needs. Whether you’re a small startup or a growing enterprise, it adapts to your requirements. Scalability ensures it grows with your business.

A commission spreadsheet template is essential—accurate, efficient, and transparent. It saves time, boosts productivity, and keeps your team aligned. To enhance data visualization, install ChartExpo for clear and insightful charts.

How much did you enjoy this article?

GSAd1
Start Free Trial!
149817

Related articles

next previous
Google Sheets11 min read

Google Spreadsheet Timesheet Template: A Visual Guide

A Google spreadsheet timesheet template simplifies time tracking and payroll management. Learn how to create, customize, and analyze timesheets.

Google Sheets9 min read

Google Sheets Transpose: A Complete Guide

Discover what Google Sheets Transpose is and how to flip data in your spreadsheet. You’ll learn methods and tips to enhance data analysis and visualization.

Google Sheets10 min read

Google Workspace for Education for Better Insights

Google Workspace for Education boosts collaboration and remote learning. Explore its features, benefits, and how ChartExpo enhances data analysis.

Google Sheets9 min read

Google Workspace Marketplace for Boosting Insights

Google Workspace Marketplace provides apps to enhance Gmail, Drive, and Docs. Learn about this tool and how to improve data visualization and analysis.

Google Sheets12 min read

Google Sheets CRM Templates for Insightful Decisions

Google Sheets CRM templates help businesses track contacts, sales, and customer data. Learn their benefits, setup steps, and expert tips to boost efficiency.

ChartExpo logo

Turn Data into Visual
Stories

CHARTEXPO

  • Home
  • Gallery
  • Videos
  • Services
  • Pricing
  • Contact us
  • FAQs
  • Privacy policy
  • Terms of Service
  • Sitemap

TOOLS

  • ChartExpo for Google Sheets
  • ChartExpo for Microsoft Excel
  • Power BI Custom Visuals by ChartExpo
  • Word Cloud

CATEGORIES

  • Bar Charts
  • Circle Graphs
  • Column Charts
  • Combo Charts
  • Comparison Charts
  • Line Graphs
  • PPC Charts
  • Sentiment Analysis Charts
  • Survey Charts

TOP CHARTS

  • Sankey Diagram
  • Likert Scale Chart
  • Comparison Bar Chart
  • Pareto Chart
  • Funnel Chart
  • Gauge Chart
  • Radar Chart
  • Radial Bar Chart
  • Sunburst Chart
  • see more
  • Scatter Plot Chart
  • CSAT Survey Bar Chart
  • CSAT Survey Chart
  • Dot Plot Chart
  • Double Bar Graph
  • Matrix Chart
  • Multi Axis Line Chart
  • Overlapping Bar Chart
  • Control Chart
  • Slope Chart
  • Clustered Bar Chart
  • Clustered Column Chart
  • Box and Whisker Plot
  • Tornado Chart
  • Waterfall Chart
  • Word Cloud
  • see less

RESOURCES

  • Blog
  • Resources
  • YouTube
SIGN UP FOR UPDATES

We wouldn't dream of spamming you or selling your info.

© 2025 ChartExpo, all rights reserved.