Categories
WIP reports—what do they show? Businesses track work in progress to stay on top of costs, deadlines, and performance. Without proper reporting, projects can go over budget or fall behind schedule. A structured report helps teams see what’s done, what’s pending, and where adjustments are needed.
Construction, manufacturing, and finance rely on WIP reports to monitor ongoing work. Tracking progress in real time helps reduce waste and improve efficiency. Using Excel plug-ins can enhance reporting accuracy and automate calculations for better insights.


Flexibility is key. Projects change, and teams must adapt. WIP reports help managers adjust timelines, control spending, and improve workflow. A spreadsheet or expense report template in Excel can efficiently track financial details and work progress.
Companies that track work in progress see better results. They identify issues early and help manage budgets more accurately. Creating financial models in Excel alongside WIP reports helps businesses forecast costs and optimize resources.
Why work in the dark? Clear reporting leads to smarter decisions. With structured tracking, businesses gain control over progress, costs, and performance.
Let’s dive in.
Definition: A WIP report tracks work in progress for ongoing projects. It shows costs, completed tasks, and remaining work. Businesses use it to manage budgets, timelines, and resources.
Construction, manufacturing, and finance rely on WIP reports for better decision-making. The report highlights labor costs, materials, and expected completion dates. It helps teams adjust plans and stay on track. Integrating 3-statement financial modeling with WIP reports provides deeper financial insights, ensuring profitability and long-term stability.
Clear reporting with a task tracking spreadsheet improves efficiency, reduces waste, and keeps projects moving forward. Understanding what is an ESG score is also crucial. Why? It helps evaluate a company’s environmental, social, and governance performance, ensuring better reporting.
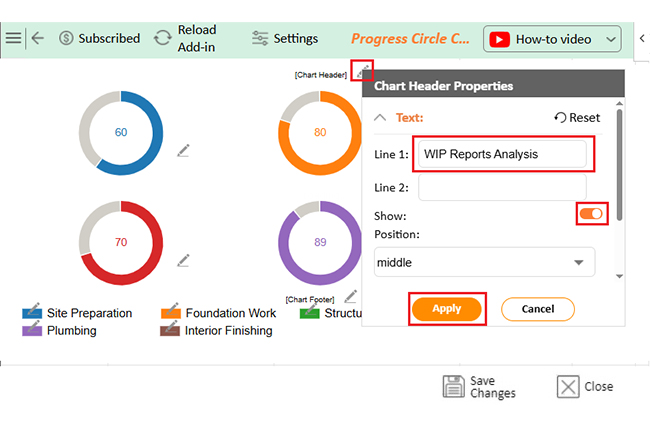
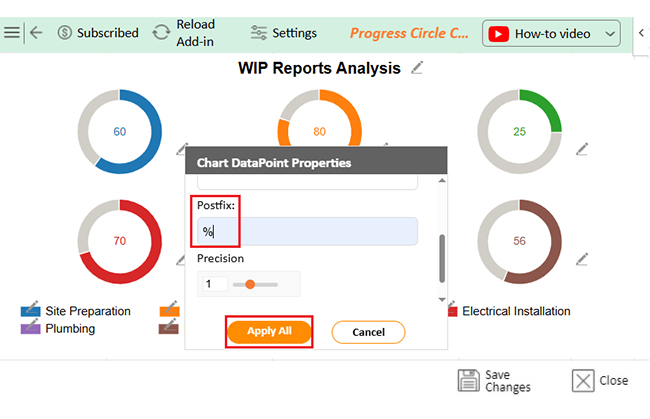
Learn to Design a Progress Circle Chart in Microsoft Excel for an Accurate and Insightful WIP Report


Learn to Design a Progress Circle Chart in Google Sheets for an Accurate and Insightful WIP Report
Keeping projects on track isn’t easy. Budgets shift, deadlines move, and unexpected challenges appear. Without a clear view of progress, teams risk delays and overspending. A Work in Progress (WIP) report brings structure, helping businesses stay in control. It provides real-time insights that improve efficiency and decision-making.
How?
Keeping everyone in the loop is key to a successful project. A clear, concise WIP report is essential. Using a customer satisfaction index can also track how well the project meets client expectations, ensuring effectiveness. Here’s what you should include in your WIP report:
Tracking work in progress (WIP) helps businesses control costs and stay on schedule. Without accurate calculations, companies risk overspending or missing deadlines. Understanding WIP ensures better planning, pricing, and resource allocation. Here’s how to calculate WIP in a few key steps.
Creating a Work in Progress (WIP) report is more than just tracking tasks—it’s about keeping projects on course. A great WIP report ensures transparency, prevents bottlenecks, and helps teams make data-driven decisions.
Here’s how to create a clear and accurate WIP report:
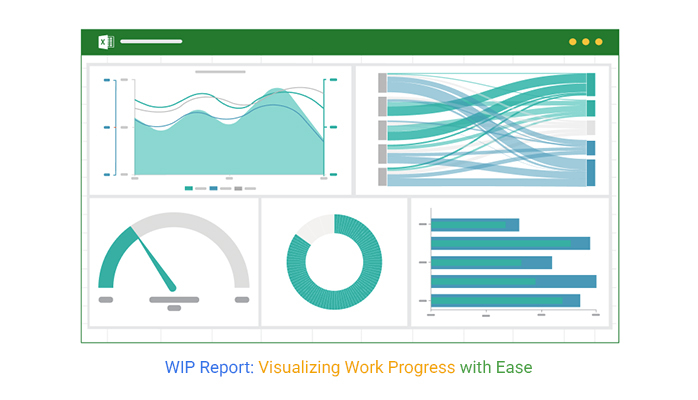
Let’s face it—data without clear visuals is like a map without directions. You might have all the numbers, but they won’t lead you anywhere unless you make sense of them. A Scatter chart or other can help reveal patterns at a glance. Enter the WIP report, your project’s GPS for navigating tasks, progress, and roadblocks.
Data analysis in Excel helps break down complex figures, but raw numbers alone aren’t enough. That’s where ChartExpo comes in. ChartExpo transforms your Excel data into insightful, easy-to-understand visuals that help you truly understand your WIP report.
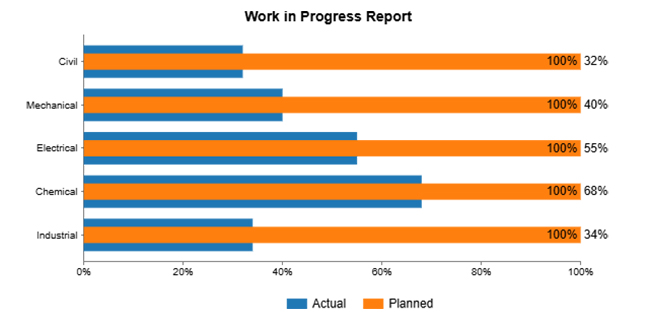
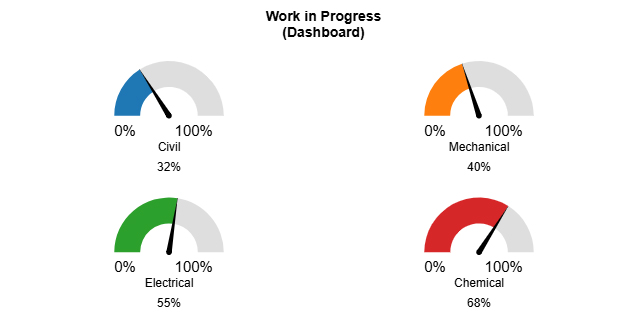
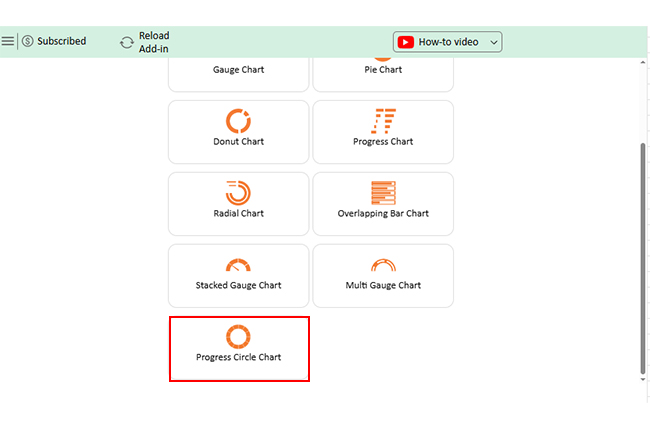
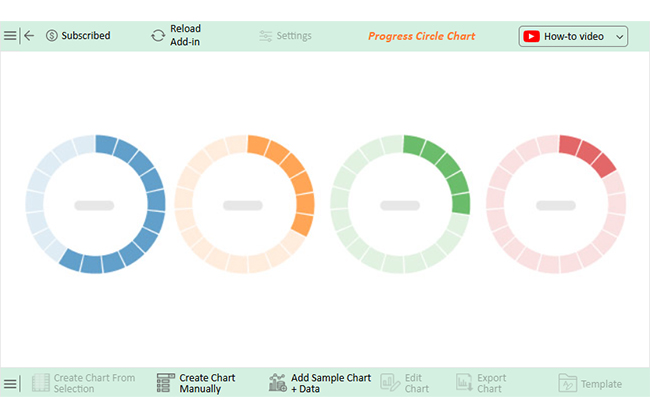
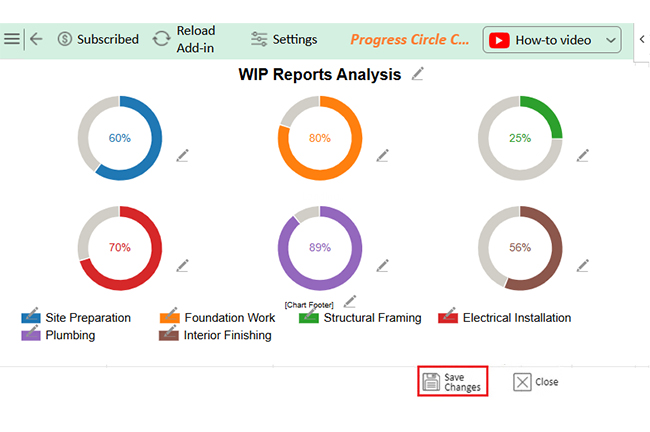
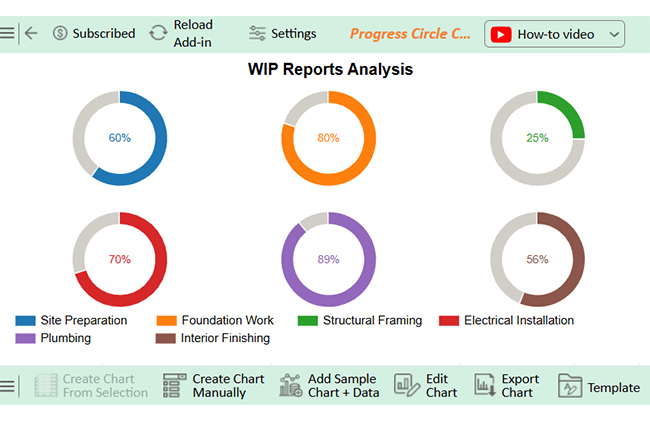
The charts below were created in Excel using ChartExpo:
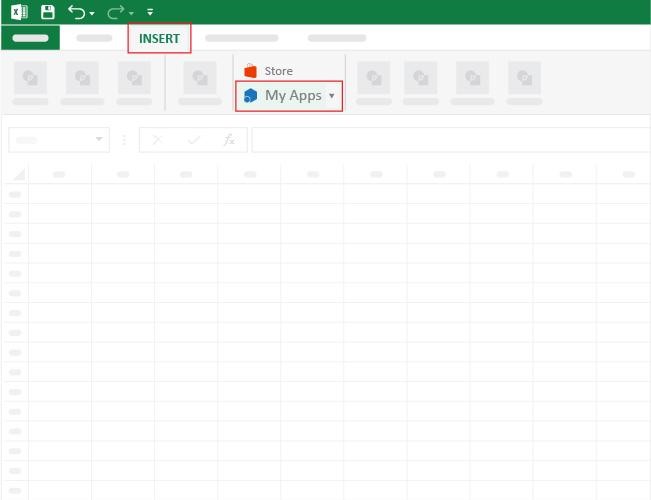
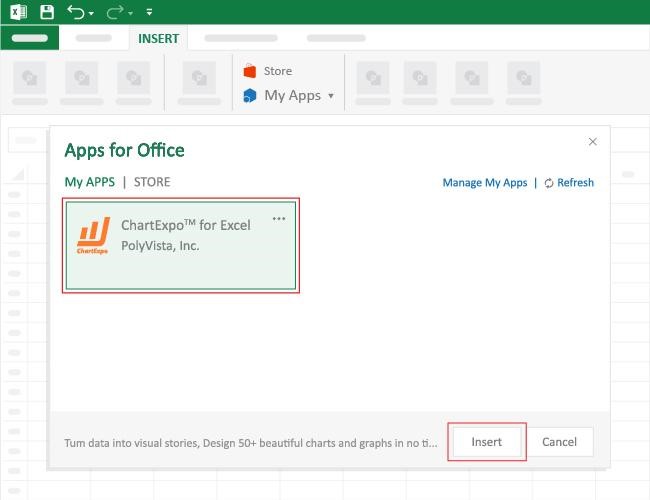
How to Install ChartExpo in Excel?
ChartExpo charts are available both in Google Sheets and Microsoft Excel. Please use the following CTAs to install the tool of your choice and create beautiful visualizations with a few clicks in your favorite tool.
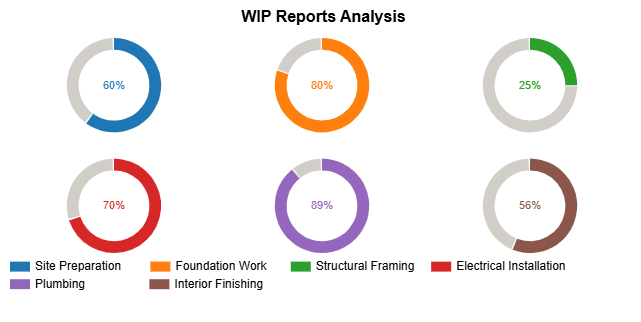
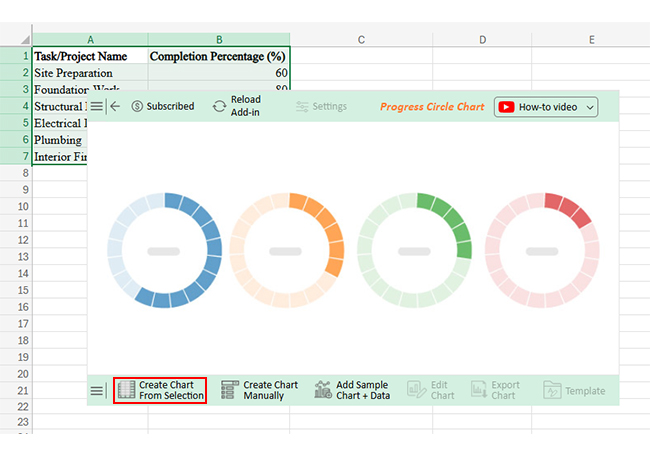
Let’s analyze this sample WIP report data and learn how to add axis labels in Excel using ChartExpo:
| Task/Project Name | Completion Percentage (%) |
| Site Preparation | 60 |
| Foundation Work | 80 |
| Structural Framing | 25 |
| Electrical Installation | 70 |
| Plumbing | 89 |
| Interior Finishing | 56 |
A WIP report is your project’s guiding tool, making it easier to stay on track and make smart decisions. Visualizing progress with line graphs in Excel helps track trends over time and spot potential delays. Here’s how to use it effectively:
WIP (Work-in-Progress) accounting isn’t just numbers—it’s the heartbeat of project finances. But let’s be real, it’s easy to mess up. A small miscalculation can throw off budgets, delay reports, or mislead decision-makers. Here are the most common WIP accounting mistakes to look out for:
Construction projects have many moving parts. Costs change, deadlines shift, and challenges arise. A clear WIP report keeps everything on track, improving efficiency and financial stability. An Excel survey template helps collect data accurately, making reporting quicker and easier.


Work in Progress (WIP) in accounting refers to unfinished goods or projects in production. It includes labor, materials, and overhead costs incurred. WIP is listed as an asset on the balance sheet until completion, then moved to finished goods.
A Work in Progress (WIP) document tracks ongoing tasks, project status, and resource usage. It helps teams monitor progress, identify delays, and manage workloads. This document ensures transparency, keeps stakeholders informed, and supports better decision-making throughout a project’s lifecycle.
A WIP report keeps projects on track. It provides real-time data on costs, progress, and potential risks. Without it, businesses struggle with delays and budget overruns. Understanding what is net working capital helps companies assess short-term financial health alongside WIP reports.
Tracking work in progress improves financial planning. It helps teams allocate resources wisely and avoid overspending. Clear data ensures better decision-making. A CRM template for Excel complements WIP reports by organizing client interactions and project details in one place.
Transparency is key in any project. A well-structured WIP report keeps managers, clients, and stakeholders informed. Everyone stays aligned, reducing confusion and miscommunication.
Accurate reporting makes risk management easier. Identifying delays or cost overruns prevents major setbacks, and proactive adjustments keep the project moving forward. Analyzing revenue vs. EBITDA alongside WIP reports helps businesses measure profitability and operational efficiency more effectively.
Profitability depends on correctly tracking expenses and revenue. A WIP report highlights financial trends, ensuring companies stay within budget. It protects margins and improves long-term planning.
Consistent reporting drives better results. A WIP report is essential for managing construction, manufacturing, or finance, simplifying planning, improving efficiency, and driving success. Install ChartExpo for better visualization and enhanced results.
How much did you enjoy this article?


Calculate accounts receivable turnover ratio to measure credit collection speed, improve cash flow, and strengthen your financial strategy. Read on!

Change Management KPIs are the key to tracking adoption, performance, and ROI during transitions. Find out which metrics matter. Read on!

Data collection methods and techniques determine the quality of every insight you act on. Explore key approaches for gathering reliable data. Read on!


