• Home
  • Tools dropdown img
    • Spreadsheet Charts

      • ChartExpo for Google Sheets
      • ChartExpo for Microsoft Excel
    • Power BI Charts

      • Power BI Custom Visuals by ChartExpo
    • Word Cloud

  • Charts dropdown img
    • Chart Category

      • Bar Charts
      • Circle Graphs
      • Column Charts
      • Combo Charts
      • Comparison Charts
      • Line Graphs
      • PPC Charts
      • Sentiment Analysis Charts
      • Survey Charts
    • Chart Type

      • Box and Whisker Plot
      • Clustered Bar Chart
      • Clustered Column Chart
      • Comparison Bar Chart
      • Control Chart
      • CSAT Survey Bar Chart
      • CSAT Survey Chart
      • Dot Plot Chart
      • Double Bar Graph
      • Funnel Chart
      • Gauge Chart
      • Likert Scale Chart
      • Matrix Chart
      • Multi Axis Line Chart
      • Overlapping Bar Chart
      • Pareto Chart
      • Radar Chart
      • Radial Bar Chart
      • Sankey Diagram
      • Scatter Plot Chart
      • Slope Chart
      • Sunburst Chart
      • Tornado Chart
      • Waterfall Chart
      • Word Cloud
    • Google Sheets
      Microsoft Excel
  • Services
  • Pricing
  • Contact us
  • Blog
  • Support dropdown img
      • Gallery
      • Videos
      • Contact us
      • FAQs
      • Resources
    • Please feel free to contact us

      atsupport@chartexpo.com

Categories
All Data Visualizations Data Analytics Surveys
Add-ons/
  • Google Sheets
  • Microsoft Excel
  • Power BI
All Data Visualizations Data Analytics Surveys
Add-ons
  • Google Sheets
  • Microsoft Excel
  • Power BI

We use cookies

This website uses cookies to provide better user experience and user's session management.
By continuing visiting this website you consent the use of these cookies.

Ok

ChartExpo Survey


Home > Blog > Google Sheets

IMPORTDATA function in Google Sheets: Best Ways to Use It

What is IMPORTDATA in Google Sheets? It’s a function that connects your spreadsheet to live data from the web. You can pull real-time updates from URLs hosting raw, structured data with a single formula. IMPORTDATA transforms your workflow, automating updates and reducing manual effort.

IMPORTDATA in Google Sheets

Imagine tracking stock prices, live sports scores, or weather patterns in real-time. IMPORTDATA can even be used for time series analysis, helping you spot trends over time. It handles all of this with ease. It empowers you to automate repetitive tasks, freeing up time for analysis and decision-making. Whether in marketing, finance, or research, this function has endless applications.

Over 70% of professionals lose valuable time weekly due to manual data handling. IMPORTDATA eliminates that bottleneck. Additionally, it connects your spreadsheets directly to data sources, ensuring updates are automatic, accurate, and timely.

Combining IMPORTDATA with a Google Sheets extension can be highly effective for advanced analyzing and interpreting data. These tools enhance functionality and visualization options, making a profound impact on insights gleaning.

Whether managing projects, analyzing trends, or monitoring performance, IMPORTDATA keeps you ahead. It simplifies data processes and helps you focus on making smarter, real-time decisions.

Table of Contents:

  1. What is IMPORTDATA in Google Sheets?
  2. How to Use the IMPORTDATA Function in Google Sheets?
  3. How to Import Data from One Google Sheet to Another?
  4. How to Analyze Imported Data in Google Sheets?
  5. Benefits of Using Google Sheets IMPORTDATA
  6. Limitations of IMPORTDATA in Google Sheets
  7. FAQs
  8. Wrap Up

What is IMPORTDATA in Google Sheets?

Definition: IMPORTDATA in Google Sheets is a function that imports live data from the web into your spreadsheet. You can pull information from URLs hosting CSV or TSV files with a single formula.

This function automatically updates your data. Therefore, you can track stock prices, weather updates, or sales trends in real-time.

You can even create dashboards in Google Sheets using this live data to visualize trends. IMPORTDATA automates data entry, saving time and reducing errors. It’s easy to use and perfect for handling dynamic or large datasets.

So, let’s learn more about IMPORTDATA to help you make smarter decisions with live, reliable data.

How to Use the IMPORTDATA Function in Google Sheets?

Want to import live data directly to your Google Sheets? The IMPORTDATA function makes it simple. Whether tracking stock prices, weather updates, or analyzing sales trends, this tool ensures your data is always fresh. You can even explore advanced graph design ideas to visualize your imported data effectively.

Here’s how to use it step by step:

  1. Find the data source: Look for a URL that hosts raw data in CSV or TSV format. The data could come from public websites, APIs, or data-sharing platforms that provide structured files.
  2. Open Google Sheets: Create a new spreadsheet or open an existing one where you want to import the data. Ensure it’s organized so the imported data doesn’t overwrite anything important.
  3. Enter the IMPORTDATA formula: Click on an empty cell and type =IMPORTDATA(“URL”). Replace “URL” with the link to your data source, and ensure the URL is correct and accessible.
  4. Press Enter: After typing the formula, press Enter to execute it. The data will load into your spreadsheet automatically within seconds.
  5. Data refresh: The function automatically refreshes when the source file updates. It ensures you always have the latest data without re-entering the formula.

How to Import Data from One Google Sheet to Another?

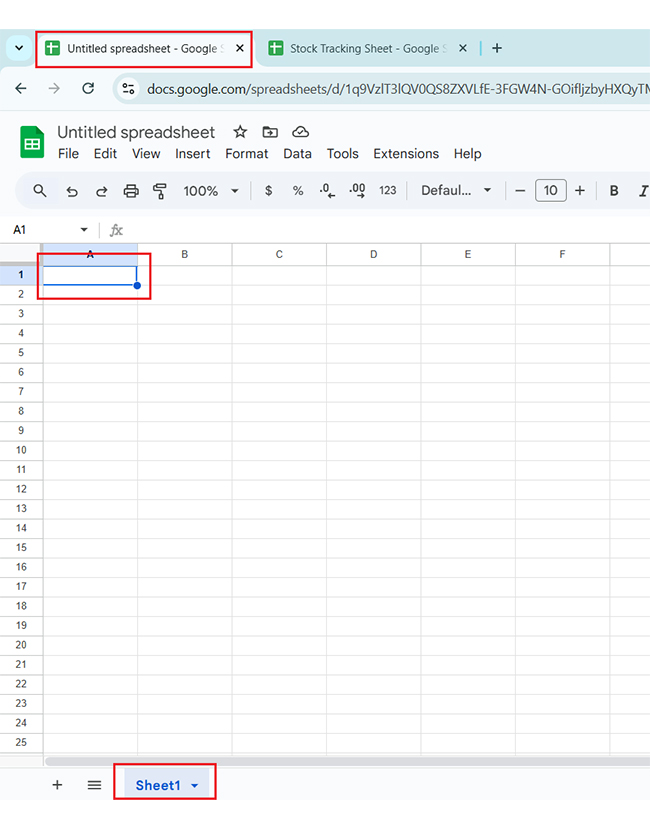
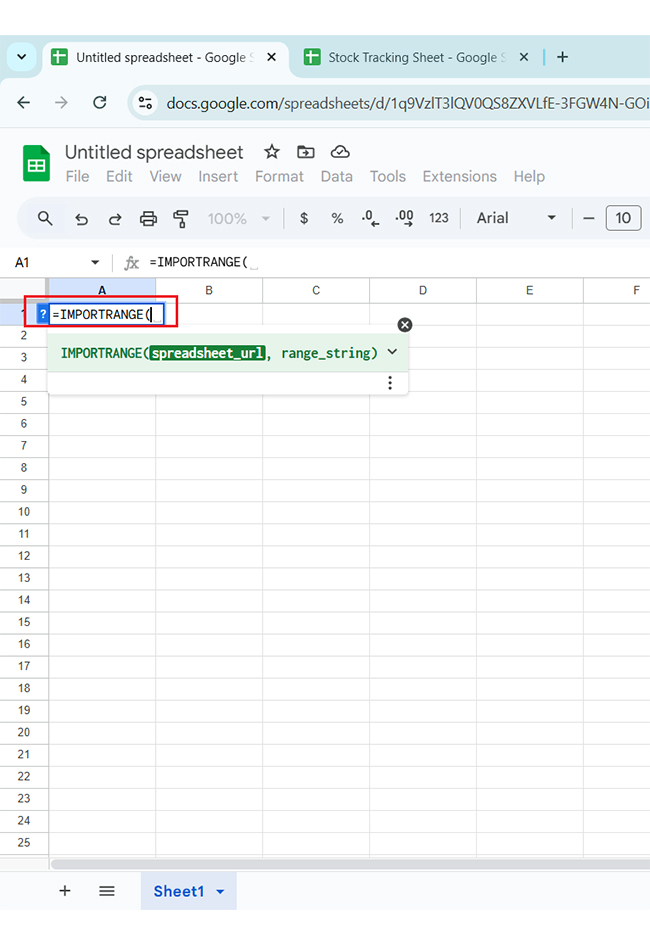
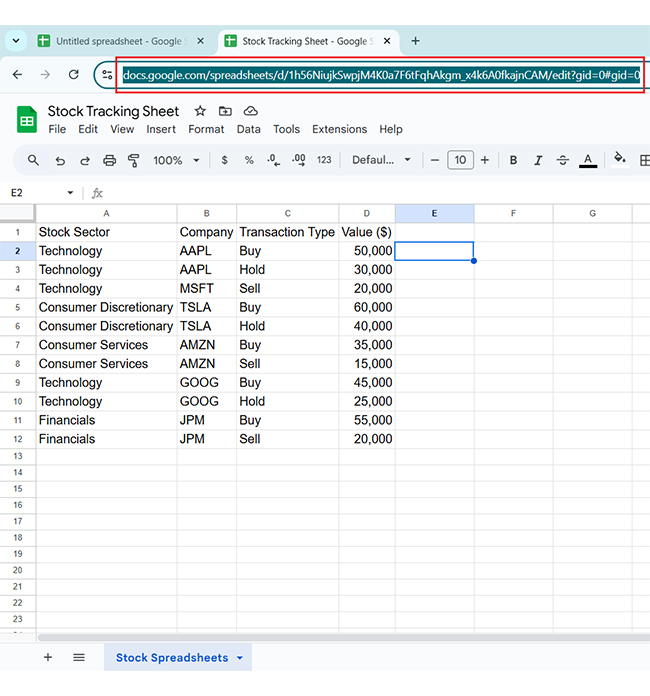
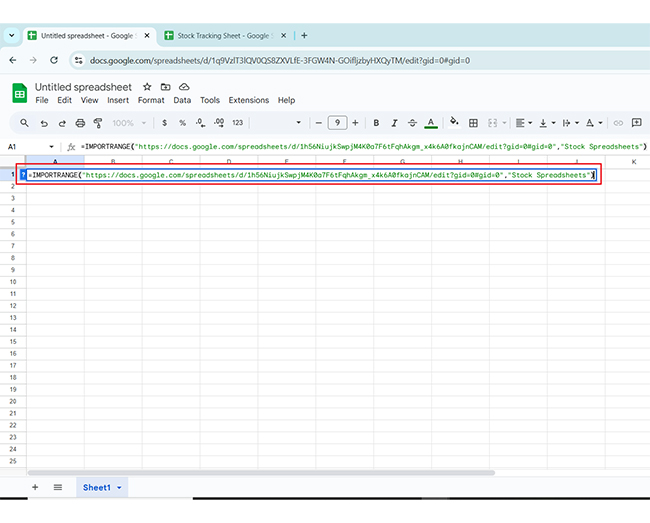
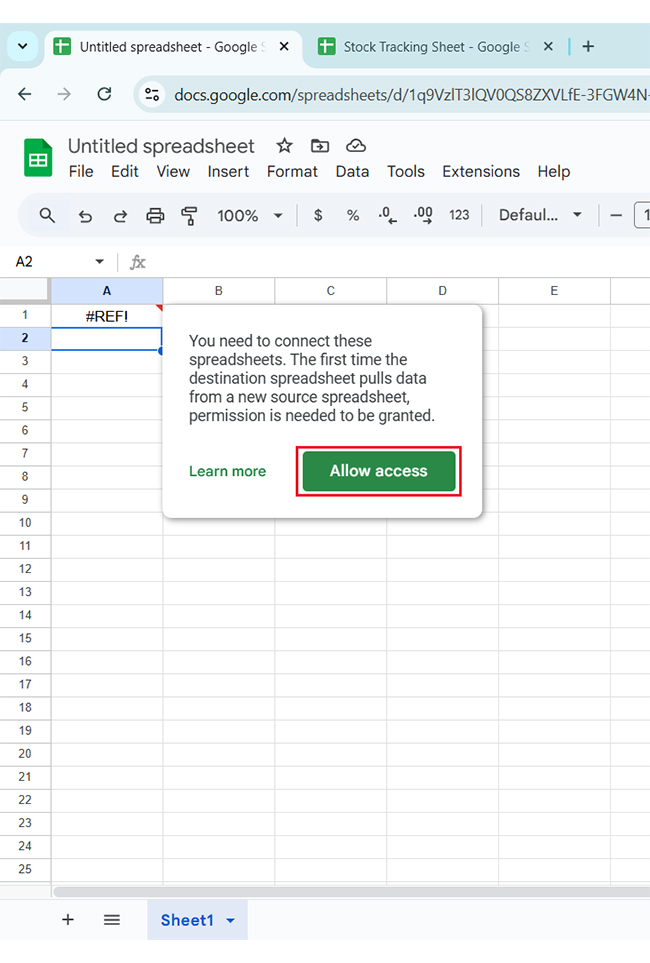
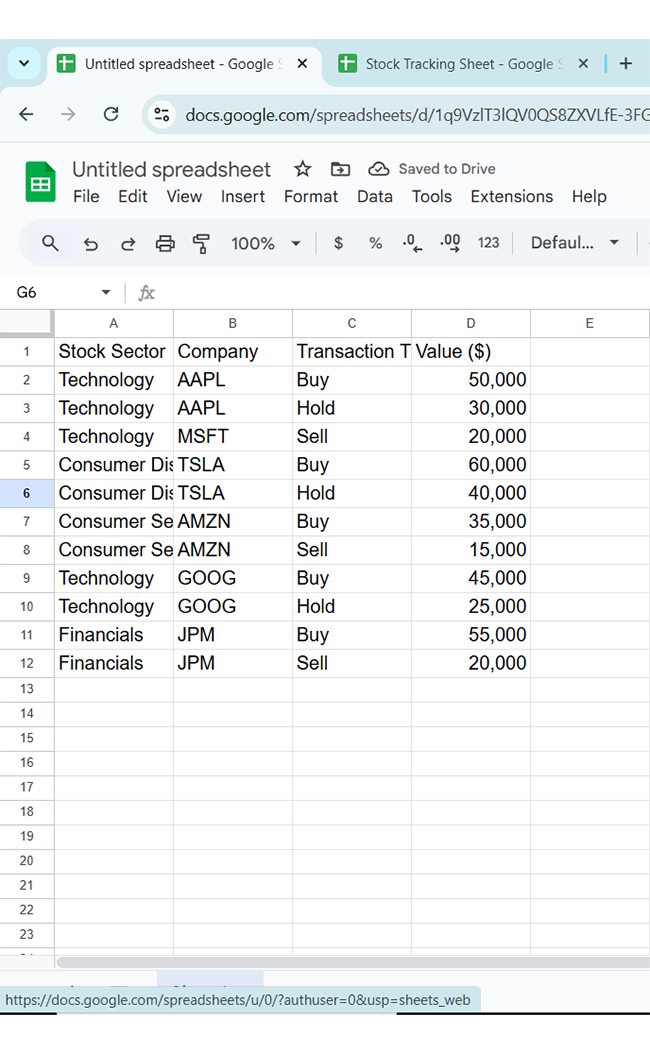
Need to pull data from one Google Sheet into another? Google Sheets combines reports, shares updates, or consolidates information. Once your data is imported, a chart maker can help turn it into clear, actionable visuals. Follow these simple steps to import data seamlessly:

  • Identify the data you want to import: Choose the sheet with the information you need as your source.
IMPORTDATA in Google Sheets
  • Open the destination sheet: Make sure it’s ready to receive the imported data.
IMPORTDATA in Google Sheets
  • Apply the formula: Fetch the data using =IMPORTRANGE (“spreadsheet_url”, “range_string”).
IMPORTDATA in Google Sheets
  • Copy the source sheet URL: Copy the URL from the source sheet’s address bar.
IMPORTDATA in Google Sheets
  • Paste the URL in the formula: Replace spreadsheet_url with the URL and define the data range.
IMPORTDATA in Google Sheets
  • Click “Allow access”: Authorize the connection when prompted.
IMPORTDATA in Google Sheets
  • View the imported data: The data will populate and update automatically.
IMPORTDATA in Google Sheets

How to Analyze Imported Data in Google Sheets?

What is IMPORTDATA in Google Sheets? It’s a handy tool for pulling live data into your spreadsheets. What about analysis? Use data visualization – it plays a vital role in turning numbers into insights.

Here’s the catch: Google Sheets, an alternative to Excel, lacks advanced visuals, but ChartExpo fills that gap. This powerful add-on bridges the gap, offering insightful, interactive charts. It even provides trend chart examples to help you identify patterns and make better decisions.

ChartExpo transforms your imported data into visuals that make analysis effortless and impactful. Are you ready to elevate your data game?

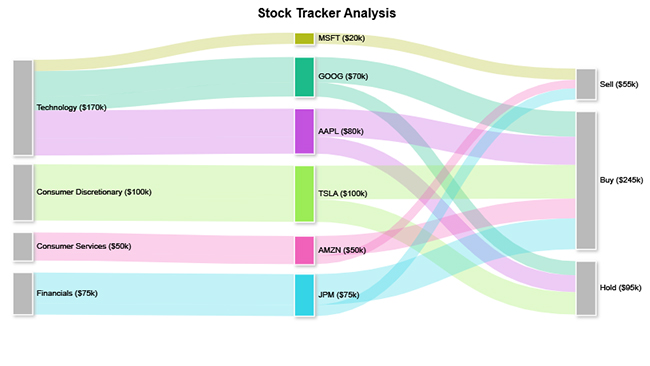
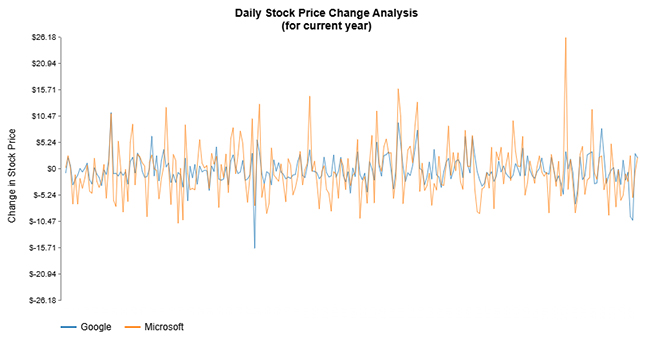
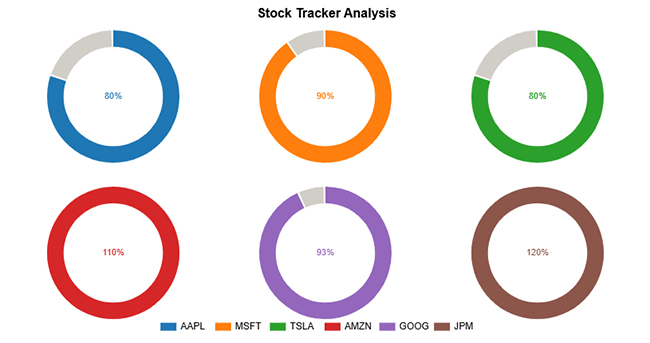
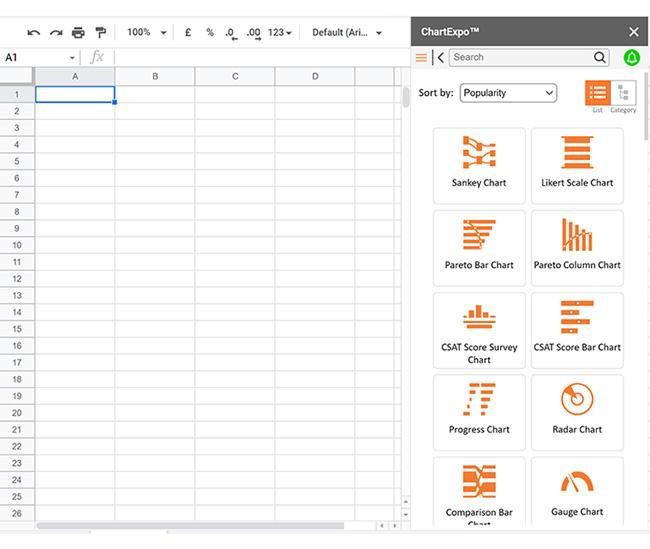
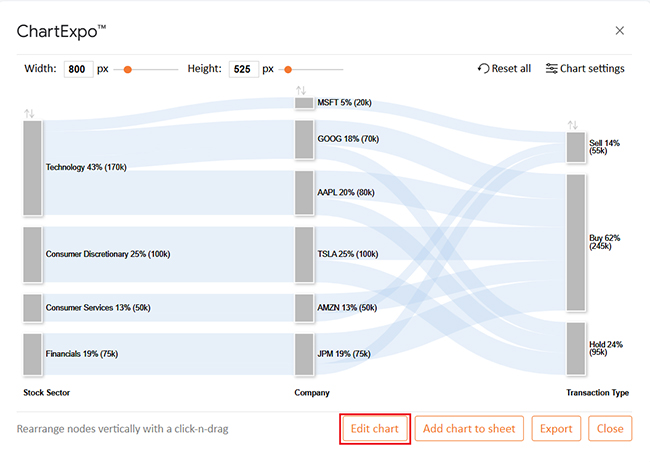
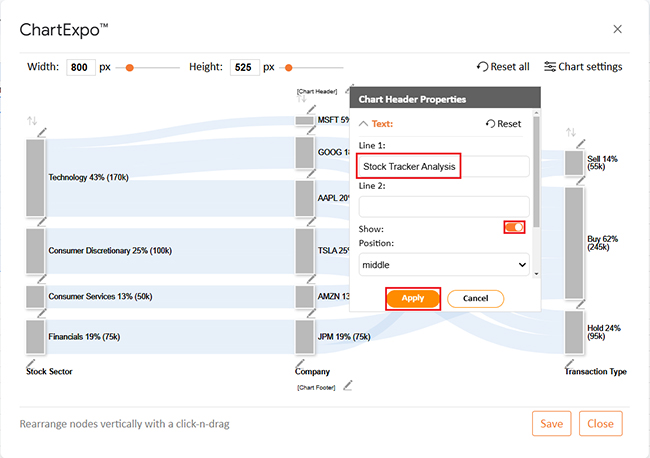
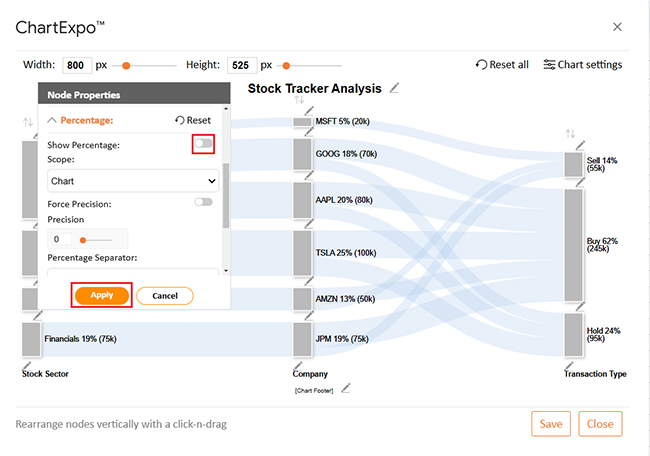
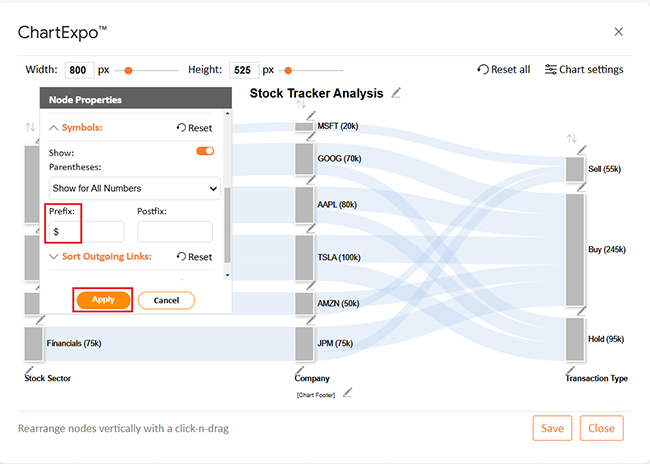
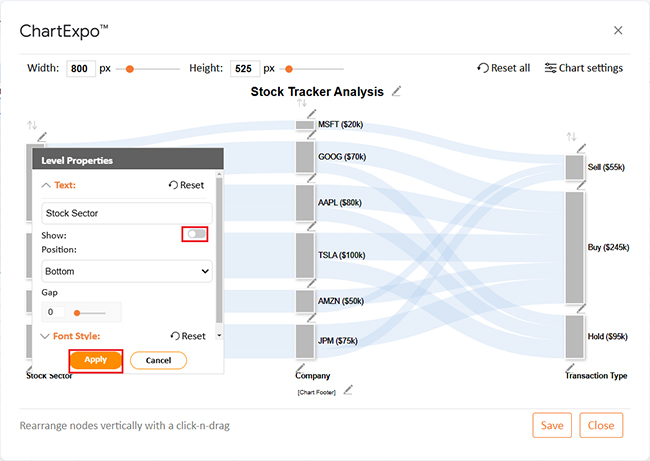
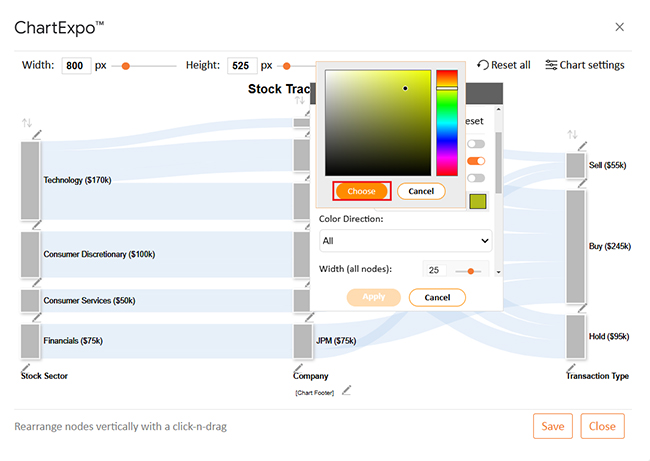
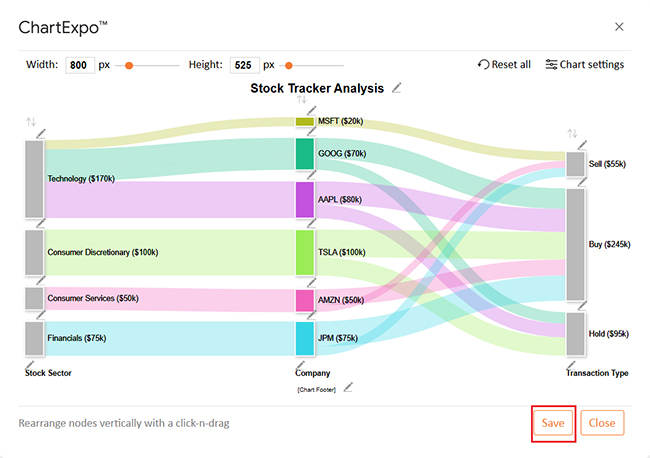
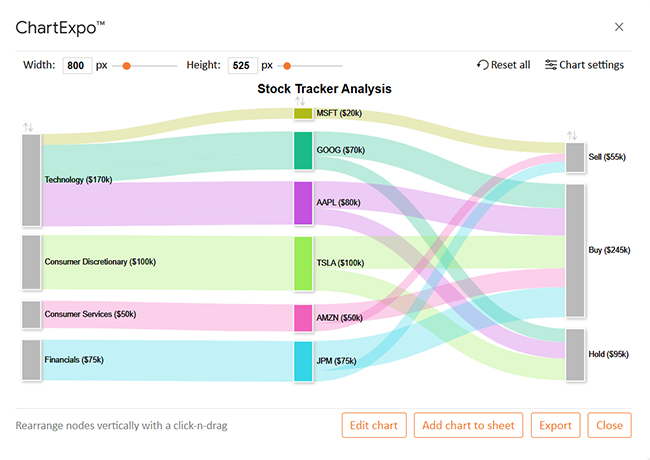
Below are the top five charts for “Stock Tracker Analysis” created in Google Sheets using ChartExpo:

Sankey Chart:

IMPORTDATA in Google Sheets

Multi Series Line Chart:

IMPORTDATA in Google Sheets

Progress Circle Chart:

IMPORTDATA in Google Sheets


Horizontal Waterfall Chart

IMPORTDATA in Google Sheets

Multi Axis Spider Chart:

IMPORTDATA in Google Sheets

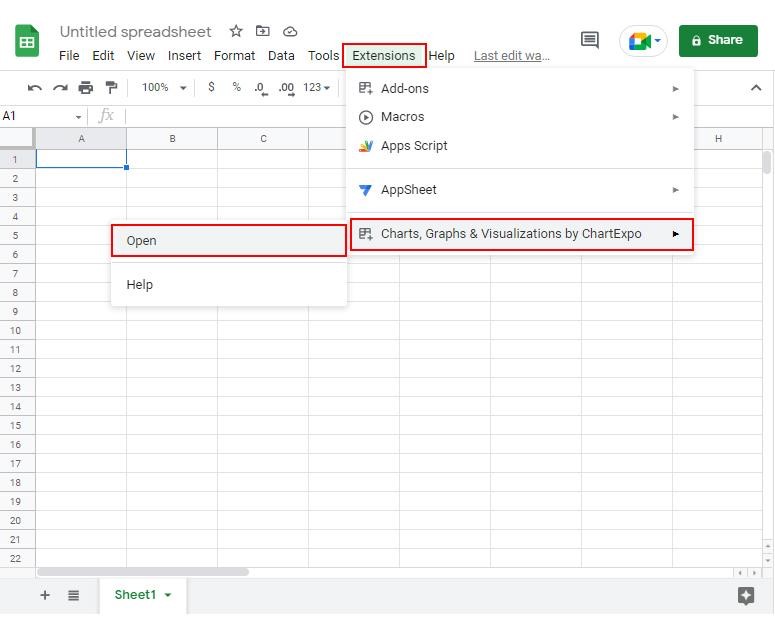
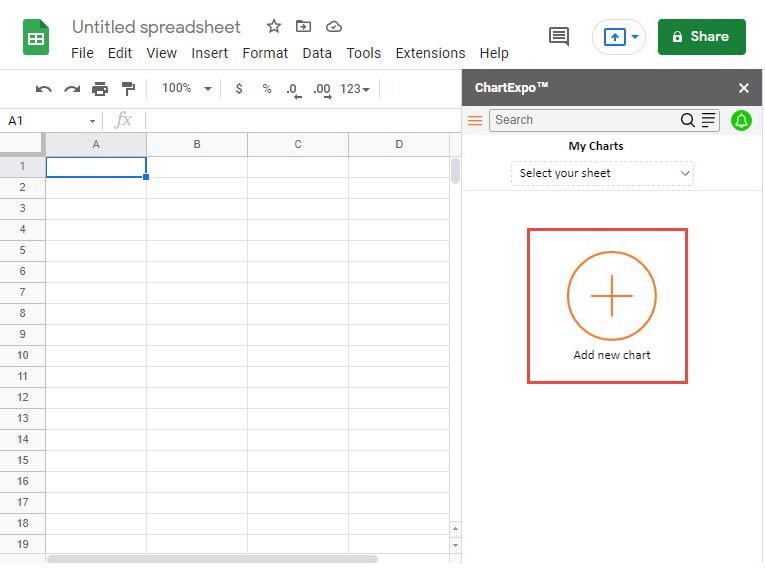
How to Install ChartExpo in Google Sheets?

  1. To start using ChartExpo, download it directly from the Google Sheets program. To do this, select Extensions from the top toolbar.
  2. A menu will appear. Click the Get add-ons option.
  3. Search for ChartExpo, and click on Charts, Graphs & Visualizations by ChartExpo when it appears in the results.
  4. Click the Install button. You will have to confirm your Google account and accept some permissions.

ChartExpo charts are available both in Google Sheets and Microsoft Excel. Please use the following CTAs to install the tool of your choice and create beautiful visualizations in a few clicks in your favorite tool.

Example

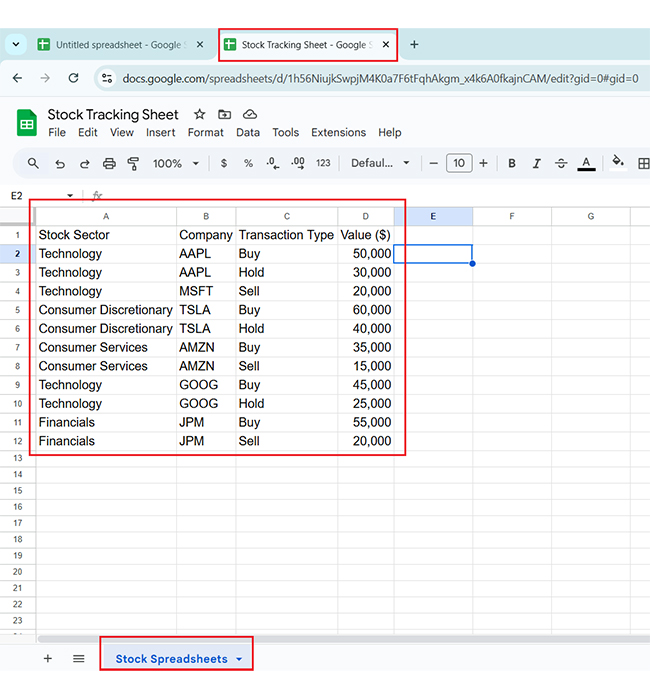
Let’s use this sample data to learn how to create a chart in Google Sheets using ChartExpo. Need a Google Sheets Progress bar for your data? Follow these steps as well:

Stock Sector Company Transaction Type Value ($)
Technology AAPL Buy 50,000
Technology AAPL Hold 30,000
Technology MSFT Sell 20,000
Consumer Discretionary TSLA Buy 60,000
Consumer Discretionary TSLA Hold 40,000
Consumer Services AMZN Buy 35,000
Consumer Services AMZN Sell 15,000
Technology GOOG Buy 45,000
Technology GOOG Hold 25,000
Financials JPM Buy 55,000
Financials JPM Sell 20,000
  • To get started with ChartExpo, install ChartExpo in Google Sheets.
  • Go to Extensions > Charts, Graphs & Visualizations by ChartExpo > Open.
IMPORTDATA in Google Sheets
  • To access the charts library, click the Add new chart button.
IMPORTDATA in Google Sheets
  • Once ChartExpo is loaded. Click on “Sankey Chart”.
IMPORTDATA in Google Sheets
  • After selecting the sheet that contains your data, choose the Metrics option. Add the corresponding numbers.
  • To add dimensional data, click the Dimensions button and enter the desired values:
IMPORTDATA in Google Sheets
  • Click the Create chart button to complete the process.
IMPORTDATA in Google Sheets
  • Click the Edit chart button to make custom changes.
  • Click the pencil icon next to the Chart Header to change the chart’s title.
  • It will open the properties dialog. Under the Text section, you can add a heading in Line 1 and enable the Show option. Give the appropriate title of your chart and click the Apply button.
IMPORTDATA in Google Sheets
  • You can disable the percentage value:
IMPORTDATA in Google Sheets
  • You can add the dollar sign with all values as follows:
IMPORTDATA in Google Sheets
  • You can disable the chart footer labels as follows:
IMPORTDATA in Google Sheets
  • You can change the colors of the center Nodes:
IMPORTDATA in Google Sheets
  • Change all the legend shapes into circles and click the “Save” button:
IMPORTDATA in Google Sheets
  • Your final chart will appear as shown below.
IMPORTDATA in Google Sheets

Insights

  • Technology: High activity with AAPL and GOOG focused on buying and holding; MSFT shows selling.
  • Consumer Discretionary: TSLA emphasizes buying.
  • Consumer Services: AMZN emphasizes buying.
  • Financials: JPM shows a balance of buying and selling.
  • Overall: Buying dominates, reflecting strong investment interest across sectors.

Benefits of Using Google Sheets IMPORTDATA

Google Sheets’ IMPORTDATA function is a game-changer when managing data. Instead of spending hours updating spreadsheets manually, it automates the process, saving you time and energy. Here’s why it’s a must-have tool:

  • Instant updates: IMPORTDATA ensures that your sheet always has the latest information. Therefore, you no longer need to manually refresh or update data as it automatically pulls fresh content.
  • Effortless integration: With one command, you can merge data from external sources like websites, APIs, or databases. This makes consolidating and organizing information quicker and more seamless.
  • Team-friendly: Using IMPORTDATA ensures collaborators see the same updated data. This enhances data presentation and improves teamwork efficiency.
  • Customizable: You can refine the data imported into your sheet by customizing the query. Whether filtering specific rows or selecting particular columns, the tool offers flexibility to tailor your imports.
  • Minimized mistakes: Since the data is imported automatically, the chances of human errors are drastically reduced. It leads to more accurate, consistent data without typos or incorrect entries.

Limitations of IMPORTDATA in Google Sheets

Using the IMPORTDATA function in Google Sheets is handy but has limitations. While it simplifies data importing, it may not meet all your business analytics needs. Here’s what you need to know:

  • File format restrictions: IMPORTDATA only supports plain text or CSV files, so other formats like Excel or JSON are out. So, if your data isn’t in the right format, convert it first.
  • Public URLs only: This function requires publicly accessible URLs. Private or password-protected links won’t work, and sensitive or restricted data can’t be imported directly.
  • Data size caps: Large datasets may exceed the function’s limits, causing errors or incomplete imports. If your file is too large, you’ll need to shrink its size or divide it into smaller sections.
  • There is no built-in error handling. If the function encounters an issue, it fails without providing clear explanations. This makes troubleshooting time-consuming and sometimes frustrating.
  • Limited data control and transformation: You can’t directly manipulate or reorganize the data structure during import. Any customization requires extra steps, like using additional formulas or scripts like VLOOKUP for Google Sheets.
  • Performance and consistency issues: Frequent updates or unstable internet connections can slow the sheet or cause import failures. Inconsistent data loading can disrupt workflows relying on real-time information.

FAQs

What does IMPORTDATA do in Google Sheets?

IMPORTDATA in Google Sheets pulls data from external sources directly into your spreadsheet. It connects to a URL and imports live data, such as CSV or TSV files. This function keeps your sheet updated without manual input.

How do I automatically import data into Google Sheets?

Use the IMPORTDATA function to import data into Google Sheets automatically. Within the function, enter the URL of a CSV or TSV file. Google Sheets will automatically fetch and update the data, keeping your sheet current without manual effort.

How do I edit imported data in Google Sheets?

  1. Select the imported data.
  2. Right-click and choose “Copy”.
  3. Go to a new sheet or section.
  4. Right-click and select “Paste Special” > “Paste values only”.
  5. Edit the pasted data as needed.

Wrap Up

IMPORTDATA in Google Sheets is a simple yet powerful tool. It pulls live data from URLs into your spreadsheet, whether in CSV or TSV format. The function makes it easy – you don’t need complex setups or extra software—just a formula and a URL.

This feature is perfect for automating data updates. You no longer need to copy-paste information manually. Your spreadsheet refreshes automatically whenever the source changes, saving time and ensuring accuracy. For example, it can help you manage a budget on Google Sheets efficiently by keeping the numbers updated in real-time.

However, Google Sheets alone isn’t enough for advanced data visualization. While it handles data collection well, it lacks powerful charting options. ChartExpo helps transform raw data into meaningful visualizations, making it an excellent alternative to Excel.

ChartExpo integrates smoothly with Google Sheets and provides a variety of stunning charts and graphs. With a few clicks, your data becomes clearer and easier to understand. Additionally, using tools like remove duplicates in Google Sheets helps keep your imported data clean and accurate.

Conclusively, IMPORTDATA provides live, up-to-date information. Moreover, combining it with advanced visualization tools allows you to unlock the power of your data.

Do not hesitate.

Install ChartExpo to simplify data handling and enhance decision-making.

How much did you enjoy this article?

GSAd1
Start Free Trial!
148123

Related articles

next previous
Google Sheets11 min read

Google Spreadsheet Timesheet Template: A Visual Guide

A Google spreadsheet timesheet template simplifies time tracking and payroll management. Learn how to create, customize, and analyze timesheets.

Google Sheets9 min read

Google Sheets Transpose: A Complete Guide

Discover what Google Sheets Transpose is and how to flip data in your spreadsheet. You’ll learn methods and tips to enhance data analysis and visualization.

Google Sheets10 min read

Google Workspace for Education for Better Insights

Google Workspace for Education boosts collaboration and remote learning. Explore its features, benefits, and how ChartExpo enhances data analysis.

Google Sheets9 min read

Google Workspace Marketplace for Boosting Insights

Google Workspace Marketplace provides apps to enhance Gmail, Drive, and Docs. Learn about this tool and how to improve data visualization and analysis.

Google Sheets12 min read

Google Sheets CRM Templates for Insightful Decisions

Google Sheets CRM templates help businesses track contacts, sales, and customer data. Learn their benefits, setup steps, and expert tips to boost efficiency.

ChartExpo logo

Turn Data into Visual
Stories

CHARTEXPO

  • Home
  • Gallery
  • Videos
  • Services
  • Pricing
  • Contact us
  • FAQs
  • Privacy policy
  • Terms of Service
  • Sitemap

TOOLS

  • ChartExpo for Google Sheets
  • ChartExpo for Microsoft Excel
  • Power BI Custom Visuals by ChartExpo
  • Word Cloud

CATEGORIES

  • Bar Charts
  • Circle Graphs
  • Column Charts
  • Combo Charts
  • Comparison Charts
  • Line Graphs
  • PPC Charts
  • Sentiment Analysis Charts
  • Survey Charts

TOP CHARTS

  • Sankey Diagram
  • Likert Scale Chart
  • Comparison Bar Chart
  • Pareto Chart
  • Funnel Chart
  • Gauge Chart
  • Radar Chart
  • Radial Bar Chart
  • Sunburst Chart
  • see more
  • Scatter Plot Chart
  • CSAT Survey Bar Chart
  • CSAT Survey Chart
  • Dot Plot Chart
  • Double Bar Graph
  • Matrix Chart
  • Multi Axis Line Chart
  • Overlapping Bar Chart
  • Control Chart
  • Slope Chart
  • Clustered Bar Chart
  • Clustered Column Chart
  • Box and Whisker Plot
  • Tornado Chart
  • Waterfall Chart
  • Word Cloud
  • see less

RESOURCES

  • Blog
  • Resources
  • YouTube
SIGN UP FOR UPDATES

We wouldn't dream of spamming you or selling your info.

© 2025 ChartExpo, all rights reserved.