• Home
  • Tools dropdown img
    • Spreadsheet Charts

      • ChartExpo for Google Sheets
      • ChartExpo for Microsoft Excel
    • Power BI Charts

      • Power BI Custom Visuals by ChartExpo
    • Word Cloud

  • Charts dropdown img
    • Chart Category

      • Bar Charts
      • Circle Graphs
      • Column Charts
      • Combo Charts
      • Comparison Charts
      • Line Graphs
      • PPC Charts
      • Sentiment Analysis Charts
      • Survey Charts
    • Chart Type

      • Box and Whisker Plot
      • Clustered Bar Chart
      • Clustered Column Chart
      • Comparison Bar Chart
      • Control Chart
      • CSAT Survey Bar Chart
      • CSAT Survey Chart
      • Dot Plot Chart
      • Double Bar Graph
      • Funnel Chart
      • Gauge Chart
      • Likert Scale Chart
      • Matrix Chart
      • Multi Axis Line Chart
      • Overlapping Bar Chart
      • Pareto Chart
      • Radar Chart
      • Radial Bar Chart
      • Sankey Diagram
      • Scatter Plot Chart
      • Slope Chart
      • Sunburst Chart
      • Tornado Chart
      • Waterfall Chart
      • Word Cloud
    • Google Sheets
      Microsoft Excel
  • Services
  • Pricing
  • Contact us
  • Blog
  • Support dropdown img
      • Gallery
      • Videos
      • Contact us
      • FAQs
      • Resources
    • Please feel free to contact us

      atsupport@chartexpo.com

Categories
All Data Visualizations Data Analytics Surveys
Add-ons/
  • Google Sheets
  • Microsoft Excel
  • Power BI
All Data Visualizations Data Analytics Surveys
Add-ons
  • Google Sheets
  • Microsoft Excel
  • Power BI

We use cookies

This website uses cookies to provide better user experience and user's session management.
By continuing visiting this website you consent the use of these cookies.

Ok

ChartExpo Survey


Home > Blog > Microsoft Excel

How to Categorize Expenses for Better Visual Impact

How do you categorize expenses? This simple question holds the key to financial clarity. Why? Because managing money starts with understanding where it goes.

Every dollar you spend tells a story. Groceries, utilities, entertainment—each fits into a category. By organizing expenses, you gain insight into habits. It helps you set priorities and align spending with goals. Moreover, using a monthly budget makes this process even more effective.

How to categorize expenses

Effective expense categorization isn’t complicated. Identify fixed costs, like rent and subscriptions, and separate them from variables. This will bring clarity and show where to cut back and where to invest more.

Many apps and tools now simplify the process, letting you tag and sort transactions quickly. Excel plug-ins help to automate tracking and categorization. However, understanding how to categorize expenses effectively still requires focus. Your chosen categories should reflect your unique needs and goals, ensuring the process stays relevant and valuable.

Financial peace of mind starts with knowledge. Categorizing expenses gives you control over your money. It’s the foundation of every budget and the secret to achieving long-term financial goals.

Let’s dive deeper…

Table of Contents:

  1. What is a Tax-Deductible Business Expense?
  2. What is Categorizing Business Expenses?
  3. Why Do You Need to Categorize Expenses for Business?
  4. Top 38 Business Expense Categories
  5. How to Categorize Expenses for Business?
  6. Best Way to Categorize Expenses
  7. How Do You Keep Track of Business Expenses?
  8. How to Analyze and Categorize Expenses?
  9. Pros and Cons of Small Business Expense Categorization
  10. Best Practices for Categorizing Expenses
  11. FAQs
  12. Wrap Up

What is a Tax-Deductible Business Expense?

Definition: A tax-deductible business expense is essential to running your business. These expenses reduce your taxable income, lowering the taxes you owe. Examples include rent, utilities, office supplies, and employee salaries. Travel for business, marketing costs, and professional services may also qualify.

The expense must be ordinary and necessary for your industry to be deductible. Incorporating business analytics into your financial process can help identify and track these expenses effectively.

Keeping detailed records ensures accurate deductions and compliance with tax laws. Proper documentation prevents issues during audits and keeps your business finances in order.

What is Categorizing Business Expenses?

Definition: Categorizing business expenses is key to understanding where your money goes. It’s more than keeping receipts—it’s about making sense of spending. Organized expenses simplify tax prep and highlight areas to cut costs or invest more. Here’s how to break them down:

  • Office supplies and expenses: Pens, paper, and computers keep the office running smoothly. These small costs add up fast and are fully deductible.
  • Utilities: Electricity, internet, and phone bills are essential for operations. Clear data presentation makes tracking and organizing these expenses easier for tax time.
  • Travel and entertainment: Business trips, client dinners, and conferences fall here. Only business-related portions qualify, so track them carefully.
  • Employee compensation: Salaries, wages, and bonuses are vital. Benefits like health insurance or retirement contributions are also important.
  • Professional fees: Legal, accounting, or consulting fees count. These services keep your business compliant and efficient.

Why Do You Need to Categorize Expenses for Business?

Running a business means keeping a close eye on every dollar. But without categorizing expenses, it’s easy to lose track. Why is this so important? Because understanding where your money goes isn’t just smart—it’s essential. Here are the reasons why expense categorization matters for your business.

  • Financial clarity: Categorizing expenses helps you see exactly how your money is spent. It highlights overspending, unnecessary costs, and opportunities to save.
  • Budgeting: A well-categorized expense system simplifies budgeting. It allows you to allocate funds wisely and keep your financial goals on track.
  • Tax preparation: Accurate expense categories ensure you claim all allowable deductions. Hence, you save time and money during tax season and reduce stress.
  • Financial reporting: Organized expenses simplify creating reports for stakeholders or lenders. Therefore, clear records boost your credibility and improve decision-making.
  • Audit preparedness: Having categorized expenses means you’re always ready for an audit. Data visualizations help present this information clearly, ensuring compliance and reducing the risk of fines or penalties.

Top 38 Business Expense Categories

Tracking business expenses is key to smart financial management. Clear categories simplify budgeting, tax deductions, and reporting. Organized expenses give you a clear view of your business finances. Here are 38 must-know categories to get started.

  1. Advertising and Marketing
  2. Office Supplies
  3. Rent or Lease (Office Space)
  4. Utilities
  5. Employee Salaries and Wages
  6. Contract Labor
  7. Employee Benefits
  8. Insurance (Business, Liability, etc.)
  9. Legal and Professional Services
  10. Accounting and Bookkeeping
  11. Travel Expenses
  12. Meals and Entertainment
  13. Training and Development
  14. Transportation and Mileage
  15. Vehicle Expenses
  16. Technology and Software Subscriptions
  17. Website Hosting and Maintenance
  18. Internet and Phone Services
  19. Business Loan Interest
  20. Bank Fees and Charges
  21. Depreciation and Amortization
  22. Maintenance and Repairs
  23. Shipping and Postage
  24. Inventory and Supplies
  25. Cost of Goods Sold (COGS)
  26. Research and Development
  27. Permits and Licenses
  28. Taxes and Licenses
  29. Dues and Subscriptions (Professional Organizations)
  30. Charitable Contributions
  31. Gifts for Clients or Employees
  32. Payroll Taxes
  33. Equipment Purchases
  34. Furniture and Fixtures
  35. Freight and Logistics
  36. Health and Safety Compliance
  37. Printing and Stationery
  38. Miscellaneous Expenses

How to Categorize Expenses for Business?

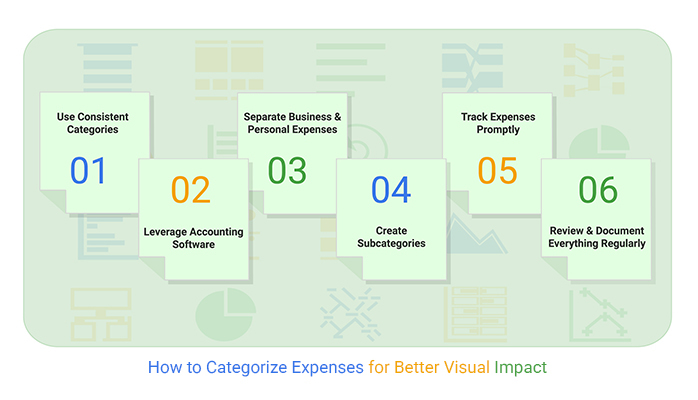
Keeping track of business expenses doesn’t have to be overwhelming. You can create a system that works for you by breaking it into clear steps. Let’s walk through the process:

  • Collect records: Gather receipts, invoices, and transactions in one place.
How to categorize expenses
  • Define categories: Create clear, relevant categories like “Marketing”, “Travel”, or “Supplies”.
How to categorize expenses
  • Sort expenses: Assign each record to the right category for clarity.
How to categorize expenses
  • Record data: Log categorized expenses in a tool or spreadsheet accurately.
How to categorize expenses
  • Review regularly: Analyze expenses for trends and adjust categories if needed.
How to categorize expenses
  • Save everything: Secure receipts and records for taxes and audits.
How to categorize expenses

Best Way to Categorize Expenses

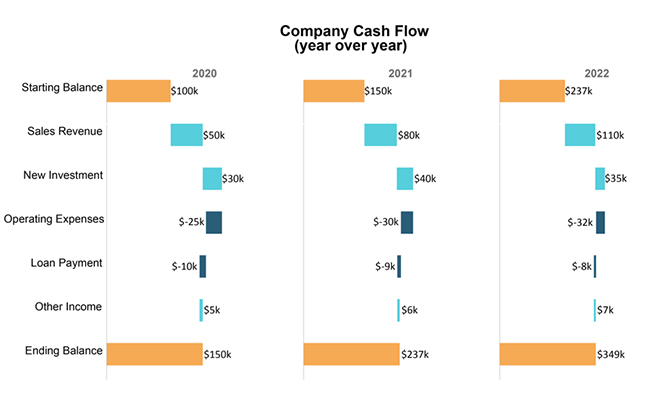
Use a system that’s simple, efficient, and fits your needs. A Cash Flow Diagram can help visualize spending and income for a better organization. Here are five steps to make categorizing expenses easier and more effective.

  1. Start with core categories and subcategories: Group expenses into rent, utilities, and marketing categories. Add subcategories for finer details, like digital ads or office supplies.
  2. Use accounting tools and automate: Leverage tools like QuickBooks or Wave to simplify categorization. Automating repetitive tasks saves time and reduces errors.
  3. Assign transactions promptly: Don’t let receipts pile up. To stay organized, categorize expenses as soon as they occur.
  4. Align with tax rules: Make sure your categories match tax requirements. This will ensure you’re ready for deductions and avoid headaches during the tax season.
  5. Review and analyze regularly: Periodically check your categories to ensure accuracy. Use visual summaries like graphs to spot trends and improve decision-making.

How Do You Keep Track of Business Expenses?

Keeping track of business expenses doesn’t have to be overwhelming. A few smart habits can make the process seamless and stress-free. Want to stay on top of your finances? Here are five practical ways to manage and track your expenses effectively.

  • Use accounting software: Leveraging tools like QuickBooks or FreshBooks helps simplify tracking. These programs automate categorization and generate helpful reports.
  • Maintain clear records and categories: Keep detailed records of all transactions. Organize them into specific categories to make tracking easier and more accurate.
  • Monitor bank and credit card activity: Review statements regularly to catch errors or unauthorized charges. This ensures all expenses are accurately accounted for.
  • Use dedicated business accounts: Separate your personal and business finances using dedicated accounts. This keeps records clean and simplifies tax preparation.
  • Set a routine for tracking: Schedule regular check-ins – weekly or monthly – to log and review expenses. Consistency prevents financial surprises and keeps you in control.

How to Analyze and Categorize Expenses?

How do you categorize expenses? It’s a question every business owner faces. Sorting your spending is key to financial clarity, but analyzing that data takes it further. Enter data visualization—the secret weapon of data analysis.

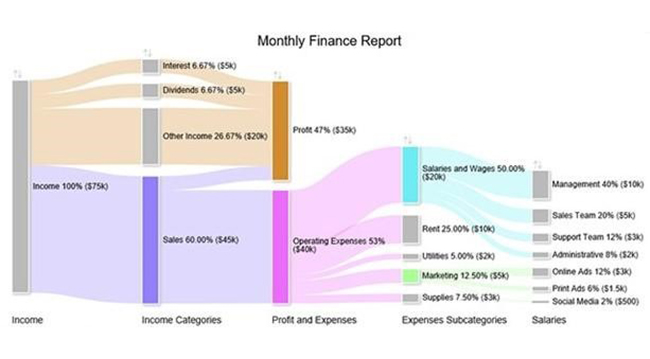
Excel does the job for basic tasks, unlike Picasso when painting a clear picture. Data visualization tools like ChartExpo transform raw numbers into clear, actionable visuals. They make understanding spending patterns faster and more effective. How? With advanced visualizations like the Sankey Diagram.

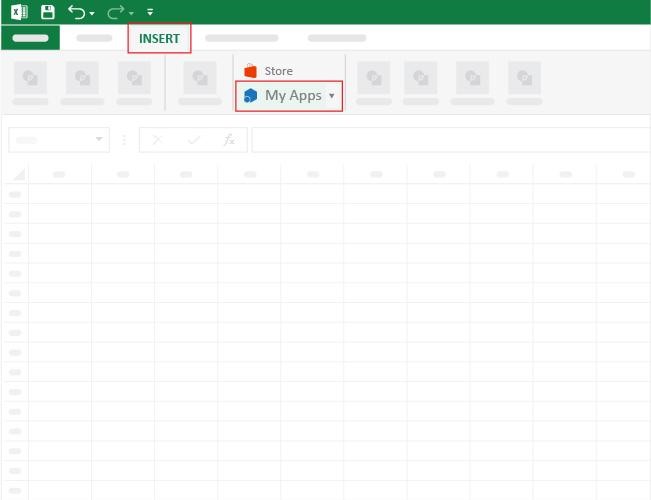
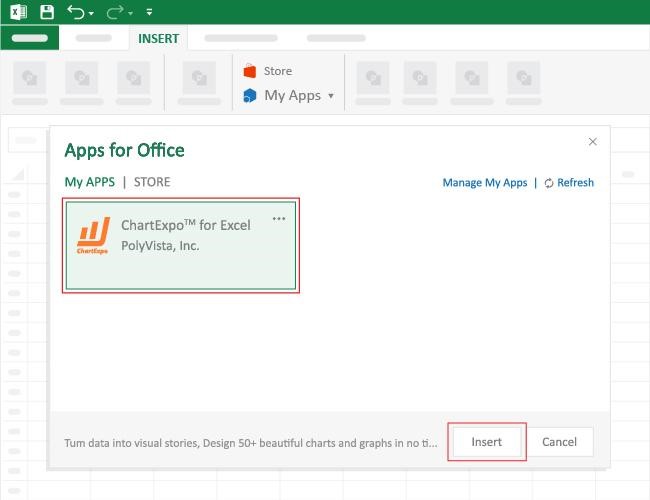
Ready to upgrade your expense tracking? Install ChartExpo.
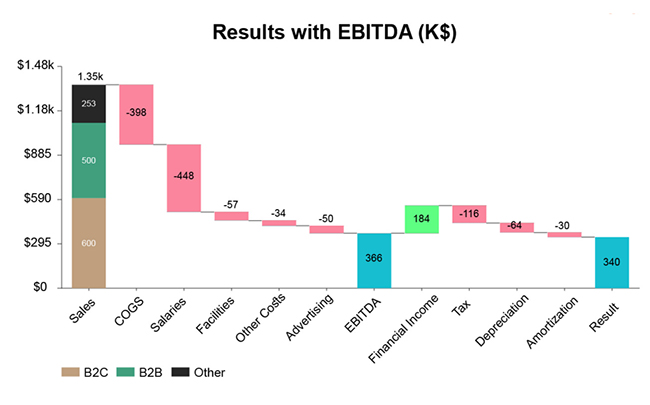
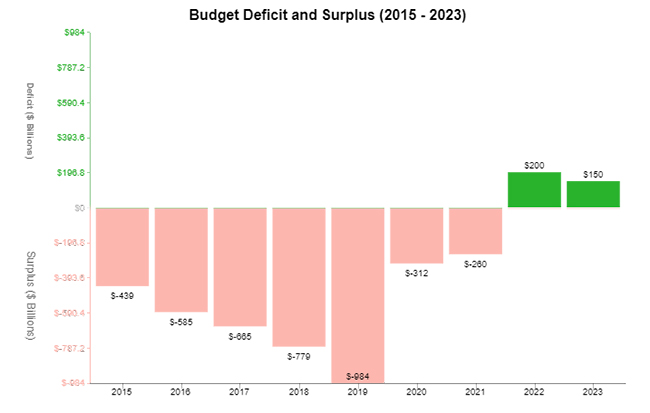
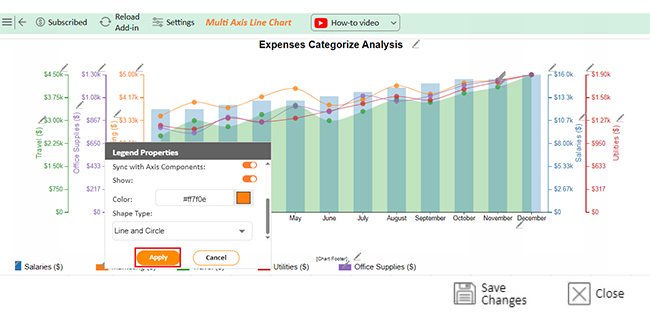
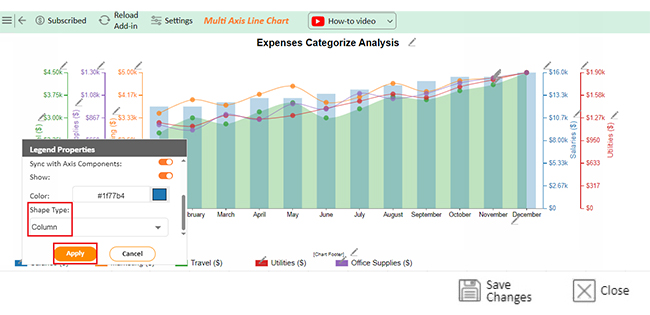
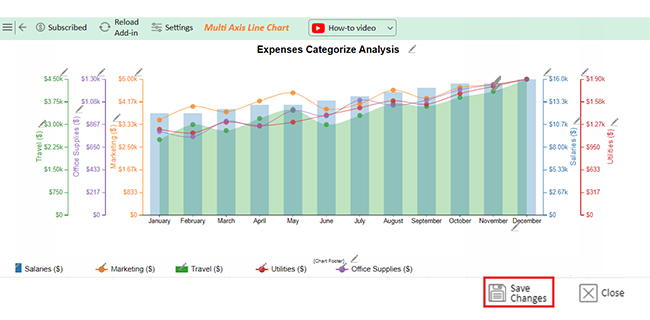
The charts below were created in Excel using ChartExpo;

Multi-Axis Line Chart:

How to categorize expenses

Sankey Chart:

How to categorize expenses

Stacked Waterfall Chart:

How to categorize expenses

Horizontal Waterfall Chart:

How to categorize expenses

Trend Chart:

How to categorize expenses

How to Install ChartExpo in Excel?

  1. Open your Excel application.
  2. Open the worksheet and click the “Insert” menu.
  3. You’ll see the “My Apps” option.
  4. In the Office Add-ins window, click “Store” and search for ChartExpo on my Apps Store.
  5. Click the “Add” button to install ChartExpo in your Excel.

ChartExpo charts are available both in Google Sheets and Microsoft Excel. Please use the following CTAs to install the tool of your choice and create beautiful visualizations with a few clicks in your favorite tool.

Example

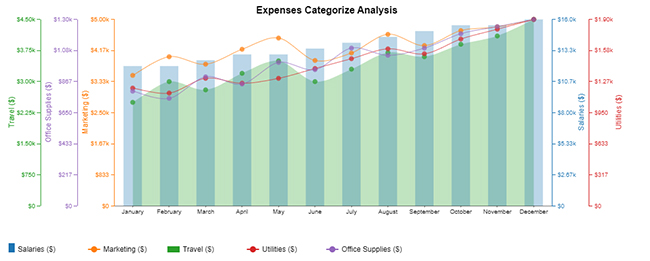
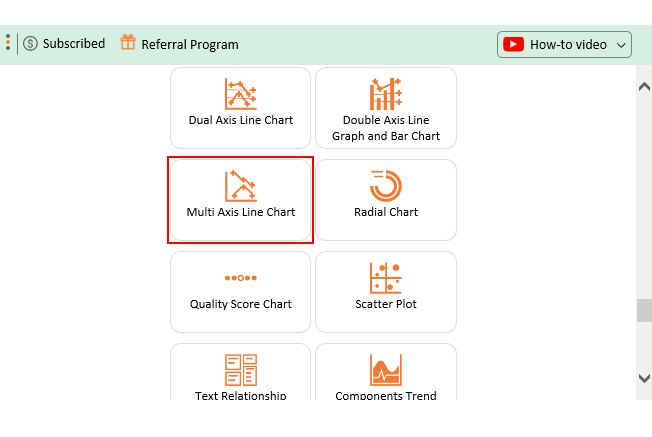
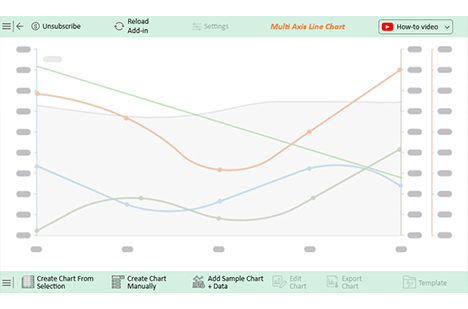
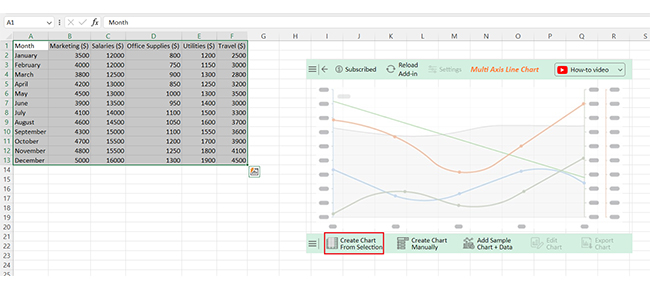
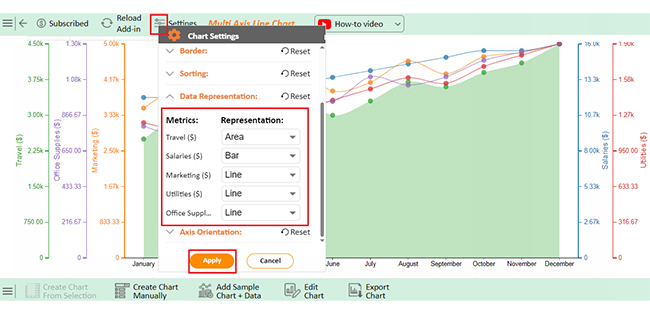
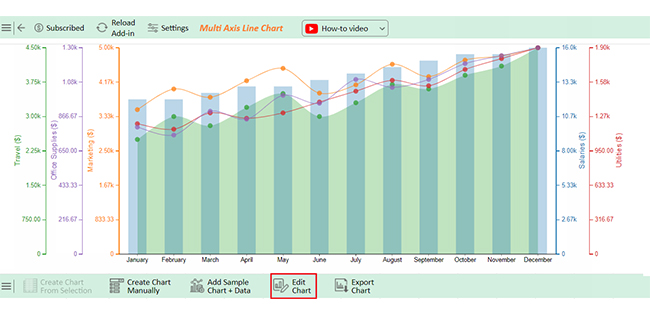
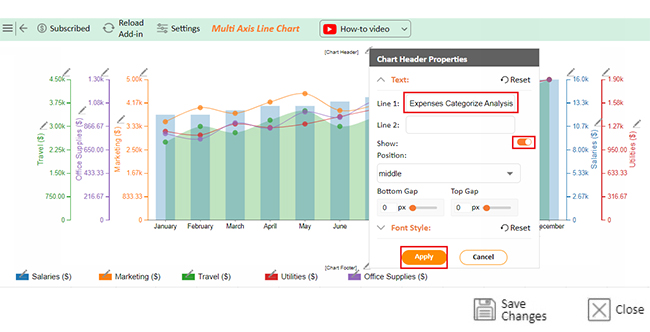
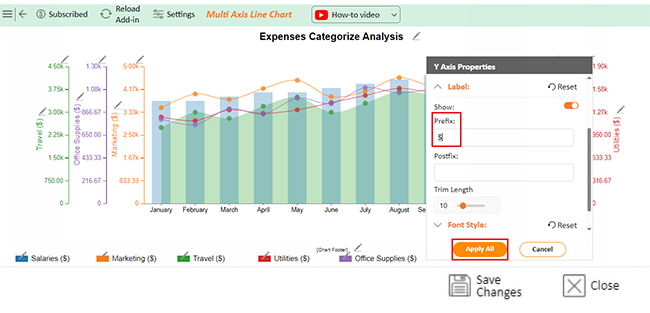
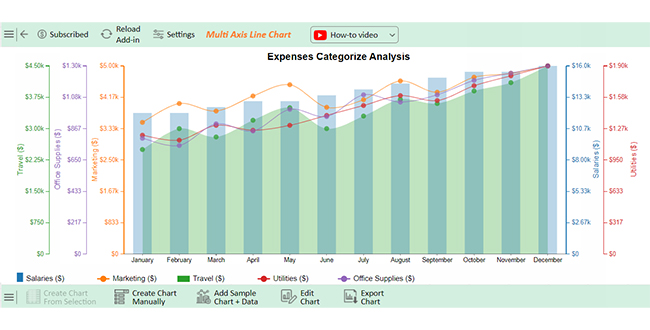
Let’s analyze this sample data in Excel using ChartExpo. ChartExpo provides the best graphs for categorical data for easy interpretation.

Month Marketing ($) Salaries ($) Office Supplies ($) Utilities ($) Travel ($)
January 3500 12000 800 1200 2500
February 4000 12000 750 1150 3000
March 3800 12500 900 1300 2800
April 4200 13000 850 1250 3200
May 4500 13000 1000 1300 3500
June 3900 13500 950 1400 3000
July 4100 14000 1100 1500 3300
August 4600 14500 1050 1600 3700
September 4300 15000 1100 1550 3600
October 4700 15500 1200 1700 3900
November 4800 15500 1250 1800 4100
December 5000 16000 1300 1900 4500


  • To get started with ChartExpo, install ChartExpo in Excel.
  • Now Click on My Apps from the INSERT.
How to categorize expenses
  • Choose ChartExpo from My Apps, then click Insert.
How to categorize expenses
  • Once it loads, scroll through the charts list to locate and choose the “Multi Axis Line Chart”.
How to categorize expenses
  • You will see a Multi Axis Line Chart on the screen.
How to categorize expenses
  • Click the “Create Chart From Selection” button after selecting the data from the sheet, as shown.
How to categorize expenses
  • Change Data presentation as follows;
How to categorize expenses
  • If you want to add anything to the chart, click the Edit Chart button:
How to categorize expenses
  • Click the pencil icon next to the Chart Header to change the title.
  • It will open the properties dialog. Under the Text section, you can add a heading in Line 1 and enable Show.
  • Give the appropriate title of your chart and click the Apply.
How to categorize expenses
  • You can add the sign of ($) with all field values and also change the precision value to zero:
How to categorize expenses
  • Change the Legend shape of “Sales” into a Line and Circle and click the “Apply” button.
How to categorize expenses
  • Change the shape of “Orders” into a Column and click the “Apply” button:
How to categorize expenses
  • Click the “Save Changes” button to persist the changes made to the chart.
How to categorize expenses
  • Your final Multi Axis Line Chart will appear as shown below.
How to categorize expenses

Insights

  • Steady growth was observed across all expense categories over 12 months.
  • Salaries and utilities show consistent increases, signaling higher operational costs.
  • Marketing and travel expenses spike in the second half, likely due to expansion or events.
  • Office supplies grow modestly, reflecting gradual operational scaling.

Pros and Cons of Small Business Expense Categorization

Managing expenses is vital for any small business. It’s the key to staying on top of your finances. But expense categorization? That’s where things can get tricky. While it offers many benefits, it also comes with a few challenges. Let’s dive in…

Pros

  • Financial clarity: Categorizing expenses clearly shows where your money goes. Moreover, pinpointing areas of unnecessary spending supports smarter financial decisions.
  • Tax benefits: Accurately categorized expenses make deductions much easier. This ensures you don’t miss out on savings during tax filing.
  • Budget management: Organized expenses allow you to set more realistic budgets by showing where funds are needed most. It helps you avoid overspending and maintain financial stability.
  • Simplified reporting: Neatly categorized expenses help create financial reports faster and easier. Using Excel charts can make presenting data to stakeholders or preparing for audits more efficient and visually clear.

Cons

  • Time-consuming: Manually categorizing expenses can take hours, especially for small businesses with high transaction volumes. Therefore, it becomes an added task in an already packed schedule.
  • Errors: Misclassifying expenses can lead to inaccurate reports, skewing decision-making. Such errors can also cause problems during tax filing or audits.
  • Complexity: Some expenses are tricky to classify because they overlap multiple categories, leading to confusion and inconsistent records.
  • Software dependence: Many businesses use accounting software to categorize expenses, simplifying the process. However, software issues or costs can pose challenges, especially for startups on tight budgets.

Best Practices for Categorizing Expenses

Properly categorizing expenses is essential for financial clarity and smarter decisions. Pro tip: Different types of charts and graphs help visualize spending patterns and make tracking more effective. Here are six best practices to make it easier:

  • Use consistent categories: Use the same categories for all expenses. This prevents confusion and keeps reports accurate.
  • Leverage accounting software: Use tools to automate and simplify tracking. They save time and reduce errors.
  • Separate business and personal expenses: Always keep these distinct. It protects your records and simplifies tax filing.
  • Create subcategories: Break down broad categories into smaller ones, giving you a detailed view of spending.
  • Track expenses promptly: Record expenses as soon as they happen. Delays lead to missed details and errors.
  • Review and document everything regularly: Check your categories and keep detailed records. Staying updated avoids issues and helps you adapt.

FAQs

How do you classify operating expenses?

Operating expenses include rent, utilities, salaries, and office supplies. These are the costs essential for day-to-day operations. They exclude non-operational costs like interest or taxes and focus solely on running the business.

What is an example category you would list for expenses?

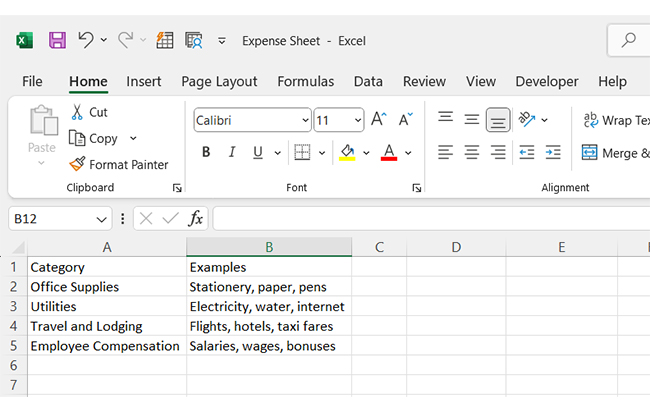
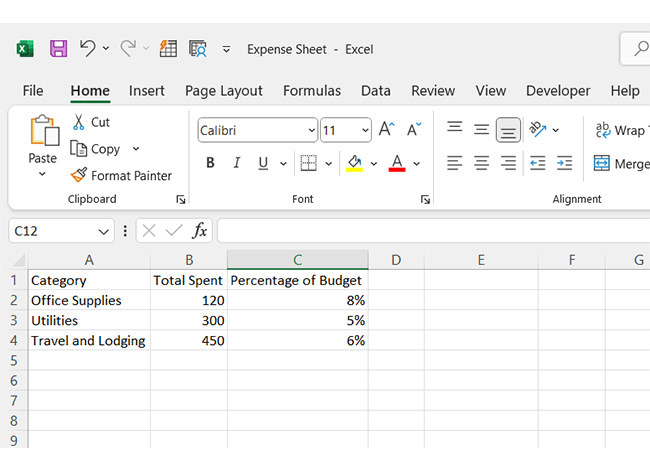
An example expense category is “Office Supplies”. This includes paper, pens, printers, and other necessary materials. Tracking this category helps monitor how much is spent on day-to-day office operations and aids in budgeting efficiently.

How do you categorize event expenses?

Event expenses can be categorized into sections like venue costs, catering, marketing, and equipment. Each category tracks specific costs related to the event’s planning and execution. It helps you understand spending patterns and ensures your event stays within budget.

Wrap Up

Categorizing expenses is essential for financial success. It helps you understand how your money is spent. You can make informed decisions about saving and investing by tracking your spending. A proper system also enhances cash flow analysis, giving you a clearer view of your financial health.

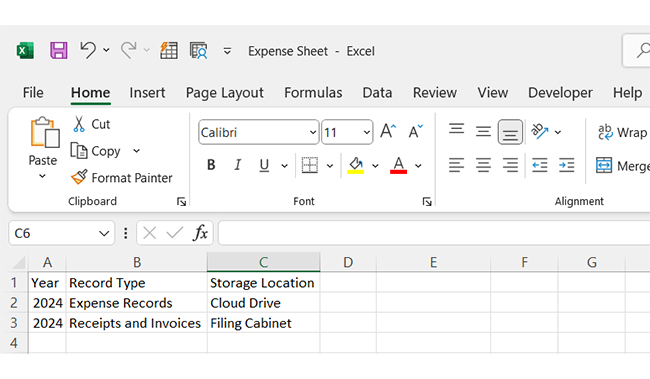
Start by gathering all your financial records. Collect receipts, invoices, and bank statements. That`s the foundation for organizing your expenses.

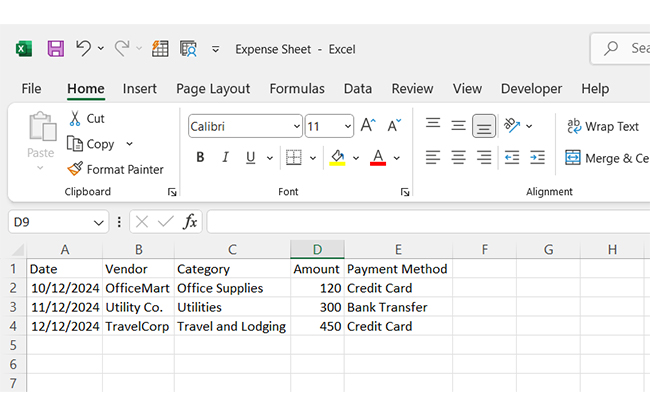
Define clear categories based on your needs. These could include office supplies, marketing, or utilities. To make tracking your expenses easy, organize them into these categories. Using a digital dashboard can streamline this process and provide real-time insights.

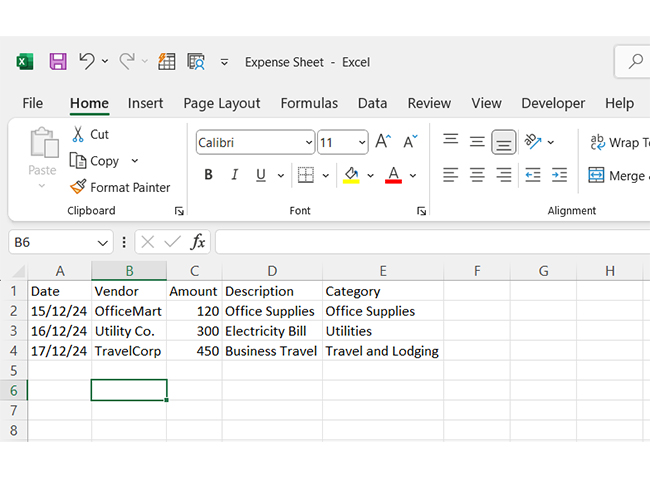
Once categorized, record all expenses. You can use spreadsheets or accounting software to help you stay organized and avoid overlooking expenses.

Review your expenses regularly and analyze your spending trends to find areas to cut back. These insights enable data-driven decision-making for smarter financial planning. Periodic reviews keep your finances in check and help you stay on budget.

Finally, align your categories with tax rules. Ensure you can easily access the right records during tax season. Proper categorization makes tax preparation smoother and more efficient.

Categorizing expenses gives you control over your finances. Hence, install ChartExpo to create a clear system that helps you make better decisions and stay financially secure.

How much did you enjoy this article?

ExcelAd2
Start Free Trial!
148060

Related articles

next previous
Microsoft Excel10 min read

Compound Interest in Excel for Smarter Reporting

Discover compound interest in Excel and how it works. Learn its formulas, calculation tips, and common errors to avoid for more accurate financial analysis.

Microsoft Excel9 min read

KPI Dashboard in Excel: A Complete Guide

A KPI dashboard in Excel helps track key metrics and streamline data visualization. Discover how to create, analyze, and use it with clear guides and examples.

Microsoft Excel11 min read

How to Plot a Speedometer Chart in Excel?

Create a Speedometer Chart in Excel to track KPIs, goals, and performance metrics visually. Explore templates, examples, and step-by-step instructions for better dashboards.

Microsoft Excel13 min read

Excel for Teachers for Insightful Preparation

Excel for teachers simplifies grading, tracks attendance, and organizes data. Find its key features, expert tips, and how ChartExpo enhances data visualization.

Microsoft Excel14 min read

How to Make a Cash Flow Diagram in Excel?

Learn how to make a Cash Flow Diagram in Excel. It will help you learn to visualize and analyze inflows and outflows of your business cash flow.

ChartExpo logo

Turn Data into Visual
Stories

CHARTEXPO

  • Home
  • Gallery
  • Videos
  • Services
  • Pricing
  • Contact us
  • FAQs
  • Privacy policy
  • Terms of Service
  • Sitemap

TOOLS

  • ChartExpo for Google Sheets
  • ChartExpo for Microsoft Excel
  • Power BI Custom Visuals by ChartExpo
  • Word Cloud

CATEGORIES

  • Bar Charts
  • Circle Graphs
  • Column Charts
  • Combo Charts
  • Comparison Charts
  • Line Graphs
  • PPC Charts
  • Sentiment Analysis Charts
  • Survey Charts

TOP CHARTS

  • Sankey Diagram
  • Likert Scale Chart
  • Comparison Bar Chart
  • Pareto Chart
  • Funnel Chart
  • Gauge Chart
  • Radar Chart
  • Radial Bar Chart
  • Sunburst Chart
  • see more
  • Scatter Plot Chart
  • CSAT Survey Bar Chart
  • CSAT Survey Chart
  • Dot Plot Chart
  • Double Bar Graph
  • Matrix Chart
  • Multi Axis Line Chart
  • Overlapping Bar Chart
  • Control Chart
  • Slope Chart
  • Clustered Bar Chart
  • Clustered Column Chart
  • Box and Whisker Plot
  • Tornado Chart
  • Waterfall Chart
  • Word Cloud
  • see less

RESOURCES

  • Blog
  • Resources
  • YouTube
SIGN UP FOR UPDATES

We wouldn't dream of spamming you or selling your info.

© 2025 ChartExpo, all rights reserved.