• Home
  • Tools dropdown img
    • Spreadsheet Charts

      • ChartExpo for Google Sheets
      • ChartExpo for Microsoft Excel
    • Power BI Charts

      • Power BI Custom Visuals by ChartExpo
    • Word Cloud

  • Charts dropdown img
    • Chart Category

      • Bar Charts
      • Circle Graphs
      • Column Charts
      • Combo Charts
      • Comparison Charts
      • Line Graphs
      • PPC Charts
      • Sentiment Analysis Charts
      • Survey Charts
    • Chart Type

      • Box and Whisker Plot
      • Clustered Bar Chart
      • Clustered Column Chart
      • Comparison Bar Chart
      • Control Chart
      • CSAT Survey Bar Chart
      • CSAT Survey Chart
      • Dot Plot Chart
      • Double Bar Graph
      • Funnel Chart
      • Gauge Chart
      • Likert Scale Chart
      • Matrix Chart
      • Multi Axis Line Chart
      • Overlapping Bar Chart
      • Pareto Chart
      • Radar Chart
      • Radial Bar Chart
      • Sankey Diagram
      • Scatter Plot Chart
      • Slope Chart
      • Sunburst Chart
      • Tornado Chart
      • Waterfall Chart
      • Word Cloud
    • Google Sheets
      Microsoft Excel
  • Services
  • Pricing
  • Contact us
  • Blog
  • Support dropdown img
      • Gallery
      • Videos
      • Contact us
      • FAQs
      • Resources
    • Please feel free to contact us

      atsupport@chartexpo.com

Categories
All Data Visualizations Data Analytics Surveys
Add-ons/
  • Google Sheets
  • Microsoft Excel
  • Power BI
All Data Visualizations Data Analytics Surveys
Add-ons
  • Google Sheets
  • Microsoft Excel
  • Power BI

We use cookies

This website uses cookies to provide better user experience and user's session management.
By continuing visiting this website you consent the use of these cookies.

Ok

ChartExpo Survey


Home > Blog > Power BI

DAX Median: How to Calculate and Use It in Power BI

DAX (Data Analysis Expression) functions in Power BI help in the creation of calculated columns, complex calculations, and measures. It aids powerful data manipulation, visualization, and analysis. That will, in turn, lead to effective decision-making.

How to Find Out Median

One of the complex calculations you can perform using DAX functions is the DAX median. This guide will help you figure out how to find out median, why you should calculate the median in Power BI, and the advantages of calculating the median in DAX.

Table of Content:

  1. What is the DAX Median?
  2. Understanding Power BI DAX Median
  3. Why You Should Calculate the Median in Power BI?
  4. When to use the Optimized median measure in Dax?
  5. DAX Median Syntax in Power BI
  6. Return Value of DAX Median 
  7. How to Find Out the Median in Power BI?
  8. Dax Median Example:
  9. How to Analyze the DAX Median in Power BI?
  10. Best Practice for Using Power BI Median
  11. Advantages of Calculating the Median DAX
  12. Limitations of DAX Median Function
  13. DAX Median – FAQs
  14. Wrap Up

First…

What is the DAX Median?

Definition: The MEDIAN function in DAX calculates the median value of a set of numbers. It’s the middle value in a sorted list of numbers, or the average of the two middle values if the list has an even number of elements.

In DAX, the MEDIAN function is used to calculate the median of a dataset. The formula syntax is:

  • MEDIAN(<column>)

The function returns the median value of the specified column. For instance:

  • MEDIAN(Table[Column])

Understanding Power BI DAX Median

The median in Power BI represents the middle value of a dataset when arranged in ascending or descending order. It calculates the (median) value for a given column and provides insights into the central tendency of a data distribution, especially useful when analyzing measures like the number of Days between two Dates to understand typical durations or intervals.

Why You Should Calculate the Median in Power BI?

The median provides a robust measure of central tendency that is less influenced by outliers compared to the mean. That comes in handy when dealing with Power BI datasets that contain extreme (or skewed) values.

It’s also used in conjunction with other statistical measures to provide a comprehensive understanding of the characteristics of your dataset.

When to use the Optimized median measure in Dax?

Use the Optimized Median Measure in DAX for large datasets, skewed data, and dynamic reports where traditional median calculations may slow performance. It helps analyze non-normally distributed data while ensuring efficient and responsive reporting in Power BI.

DAX Median Syntax in Power BI

The DAX syntax for calculating the Median in Power BI is as follows:

Median = MEDIAN(<Column>)
  • <Column>: The column containing the numeric data for which you want to calculate the median.

For example, if you have a column called SalesAmount, the DAX formula to calculate the median would be:

Median Sales = MEDIAN(Sales[SalesAmount])

Return Value of DAX Median

The return value of DAX’s MEDIAN function is the middle value in a sorted set of numbers. If there is an odd number of values, it returns the middle number. If there is an even number of values, it returns the average of the two middle values.

  • For example, in the dataset {1, 3, 5, 7, 9}, the median is 5.
  • For the dataset {1, 3, 5, 7}, the median is (3 + 5) / 2 = 4.

How to Find Out the Median in Power BI?

You can find the median using the MEDIAN function within a calculated column or measure. Here’s how to do just that.

Using a Calculated Column

Navigate to the dataset in Power BI Desktop, and go to the “Modeling” tab in the ribbon. Next, click on “New Column” in the Calculations group. Enter the formula using the MEDIAN function, and reference the column for which you want to calculate the median. For instance:

MedianColumn = MEDIAN(’Table’[Column])

To create the calculated column, press “Enter.”

Using a Measure

Navigate to the dataset in Power BI Desktop, and go to the “Modeling” tab in the ribbon. Next, click on “New Measure” in the Calculations group. Enter the formula using the MEDIAN function, and reference the column for which you want to calculate the median in Power BI. For instance:

MedianMeasure = MEDIAN(’Table’[Column])

Dax Median Example:

See Total Sales for Each Customer for Learning How to Find Out Median

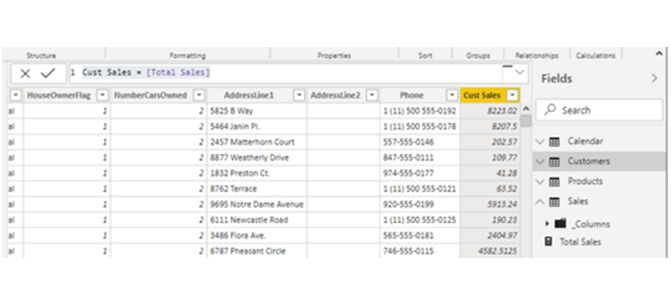
From the image above, you can see the total sales for each customer. All you needed to do was add a visual to the report canvas (1 below), add the calculated column (2), and set the aggregation to MEDIAN (3).

Set the Aggregation to MEDIAN for Learning How to Find Out Median

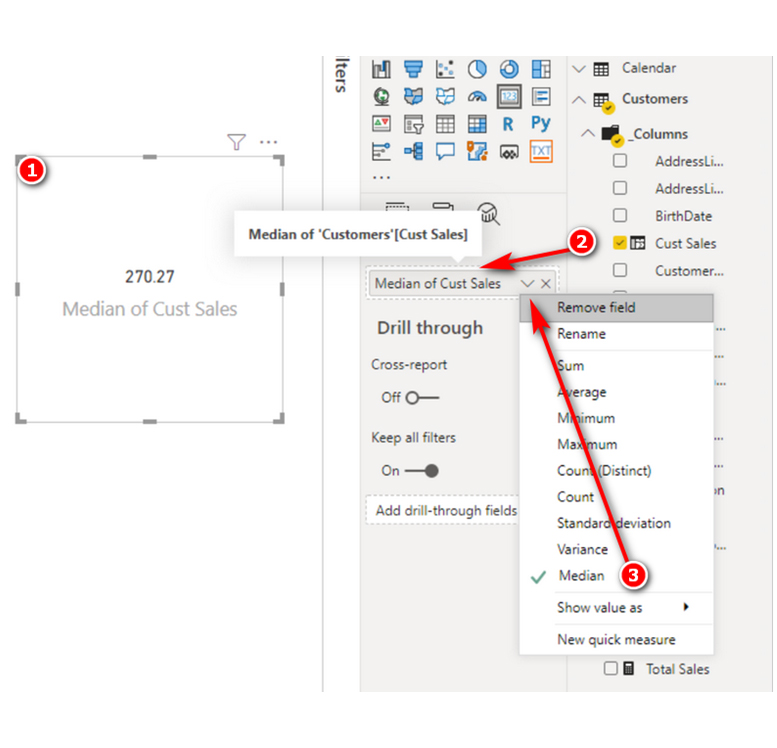
From the image above, the answer is 270.27. The issue with this approach is that you’ll have to write a calculated column to get the answer. Yes, there is a time and place for a calculated column, but you don’t need to create a calculated column to get this answer.

The calculated column above is conceptually easy for anyone to understand. It’s easy to write. You can solve the problem one step at a time. You can see the interim results, and anyone with an Excel background can do it with very little understanding of DAX. Understanding the MEDIANX function is much harder. It’s harder until you realize that MEDIANX is doing the exact thing as this calculated column.

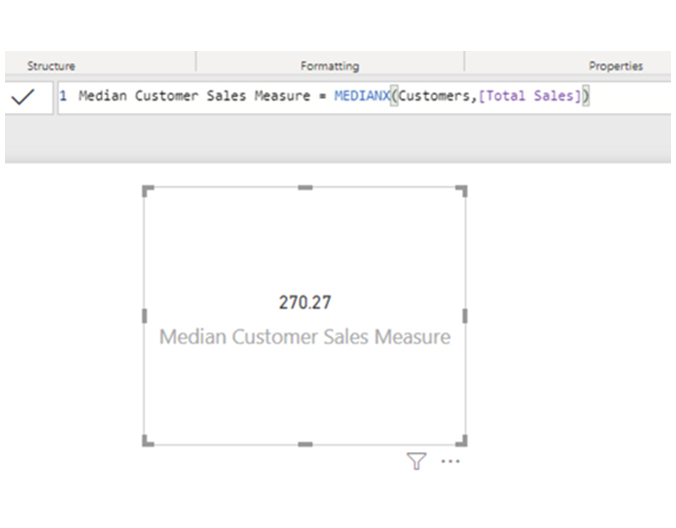
Here’s the MEDIANX formula.

Median Customer Sales Measure = MEDIANX(Customers,[Total Sales]).

MEDIAN formula for Learning How to Find Out Median

How to Analyze the DAX Median in Power BI?

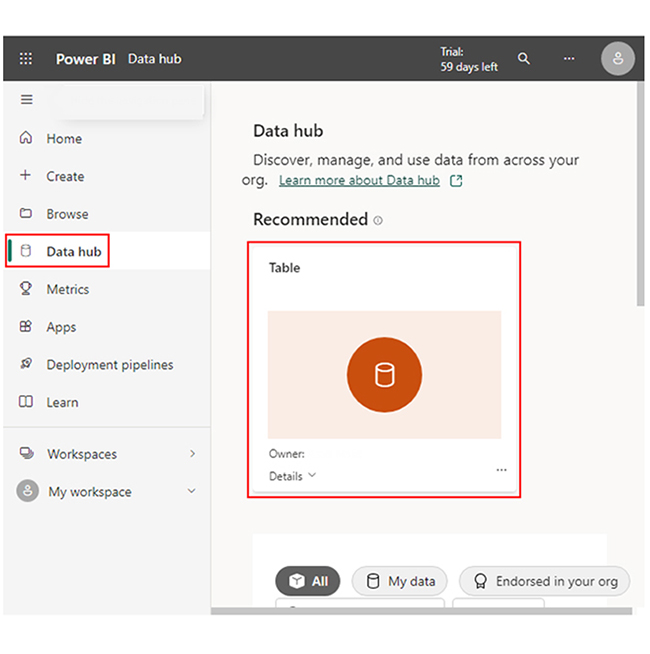
Stage 1: Logging in to Power BI
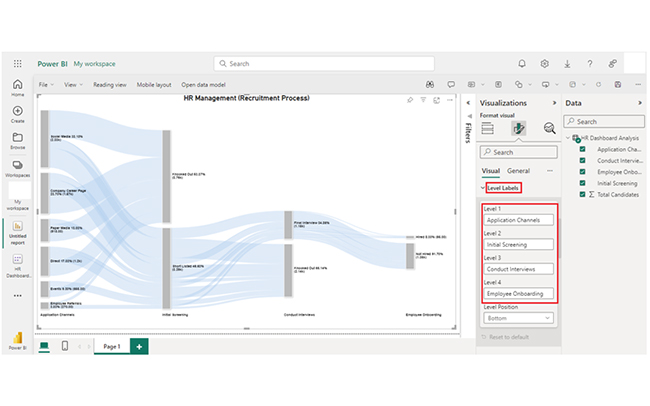
  • Log in to Power BI.
  • Enter your email address and click the “Submit” button.
Enter email to login to Power BI
    • You are redirected to your Microsoft account.
    • Enter your password and click “Sign in“.
Enter Password to login to Power BI
  • You can choose whether to stay signed in.
Click on stay signed in
  • Once done, the Power BI home screen will open.

Stage 2: Creating a Data Set and Selecting the Data Set to Use in Your Chart

  • Go to the left-side menu and click the “Create” button.
  • Select “Paste or manually enter data“.
select Paste or manually enter data in Power BI ce487
  • We’ll use the sample data below for this example.
Application Channels Initial Screening Conduct Interviews Employee Onboarding
Total Candidates
Social Media Short Listed Final Interview Hired 32
Social Media Short Listed Final Interview Not Hired 400
Social Media Short Listed Knocked Out 800
Social Media Knocked Out 1100
Company Career Page Short Listed Final Interview Hired 20
Company Career Page Short Listed Final Interview Not Hired 250
Company Career Page Short Listed Knocked Out 500
Company Career Page Knocked Out 900
Events Short Listed Final Interview Hired 5
Events Short Listed Final Interview Not Hired 100
Events Short Listed Knocked Out 200
Events Knocked Out 350
Paper Media Short Listed Final Interview Hired 3
Paper Media Short Listed Final Interview Not Hired 80
Paper Media Short Listed Knocked Out 135
Paper Media Knocked Out 700
Employee Referrals Short Listed Final Interview Hired 10
Employee Referrals Short Listed Final Interview Not Hired 70
Employee Referrals Short Listed Knocked Out 80
Employee Referrals Knocked Out 110
Direct Short Listed Final Interview Hired 25
Direct Short Listed Final Interview Not Hired 150
Direct Short Listed Knocked Out 425
Direct Knocked Out 600
  • Paste the data table above into the “Power Query” window. After that, select the “Create a dataset only” option.
Select Create a Dataset Only After Learning How to Find Out Median
  • Navigate to the left-side menu, and click on the “Data Hub” option. Power BI will populate the data set list. You’ll get an error message if no data set has been created.
Click on Data Hub After Learning How to Find Out Median
  • Click on the “Create Report” dropdown.
Click on Create Report After Learning How to Find Out Median
  • To add the Power BI Sankey Diagram Extension by ChartExpo, you’ll have to use an add-in or Power BI visual from AppSource. Navigate to the right side of the Power BI dashboard, and open the Power BI Visualizations panel. Next, click the ellipsis symbol (…) to import the Power BI Sankey Diagram extension by ChartExpo. In the following menu that opens, select the “Get more visuals” option.
Select Get More Visuals After Learning How to Find Out Median
  • Enter “ChartExpo” in the highlighted search box. You’ll see the “Sankey Diagram for Power BI by ChartExpo” as shown in the image below.
Enter ChartExpo in Search Box After Learning How to Find Out Median
  • After that, click on the Sankey Diagram, and also click the highlighted “Add” button.
Click Add Button After Learning How to Find Out Median
  • Power BI will add the “Sankey Diagram for Power BI by ChartExpo” icon in the visualization panel.
See Sankey Diagram Icon in Visualization Panel After Learning How to Find Out Median
  • To draw a Sankey Diagram with ChartExpo’s Power BI extension, select the “Sankey Diagram for Power BI by ChartExpo” icon in the visualization panel. You’ll see a window similar to the one below opened in the report section of your dashboard.
Open in Report Section of Dashboard After Learning How to Find Out Median
  • You’ll have to select the fields to use in the Sankey chart.
  • Here’s the sequence to follow when selecting the fields:
    • Application Channels
    • Initial Screening
    • Conduct Interviews
    • Employee Onboarding
    • Total Candidates
Select Fields in Sankey Chart After Learning How to Find Out Median
  • You’ll have to provide your email address or a ChartExpo License key. Add the key under the Visual section. After that, you’ll see the Sankey Chart displayed on your screen.
Add Key Under Visual Section After Learning How to Find Out Median
  • You can add the top header text in the chart under the General section.
Add Header Rext in Chart Under General Section After Learning How to Find Out Median
  • After that, click on Visual to set the number and also enable the options.
Click Visual to Set Number After Learning How to Find Out Median
  • You can change the “Node Font Style.”
Change Node Font Style After Learning How to Find Out Median
  • You can change the “Level Font Style.”
Change Level Font Style After Learning How to Find Out Median
  • You can see the Level Labels as shown below:
See Level Labels After Learning How to Find Out Median
  • Here’s how to change the Nodes color.
Change Nodes Color After Learning How to Find Out Median
  • You’ve seen “How to change Level 1 color.” You can follow the same steps to change the Nodes color of other levels.
Change All Nodes Color After Learning How to Find Out Median
  • Here’s the final look of the HR Dashboard in Power BI using ChartExpo after changing the all-nodes color.
Final How to Find Out Median

Insights

  • Social Media is the primary application channel with the highest number of candidates (1100).
  • Company Career Page has the second-highest number of candidates (900).
  • Paper Media and Events have comparatively lower candidate counts of 700 and 350, respectively.
  • The direct application has 600 candidates.

Unlock Key Insights with Median Calculation for Effective Graphs:

Discover the power of calculating the median in Power BI with this practical tutorial, where you’ll learn how to effortlessly find the median value for your data and visualize it through dynamic charts and graphs.

By using Power BI’s built-in functions and visualizations, you can quickly calculate the median and gain deeper insights into your dataset. Whether you’re analyzing trends, comparing distributions, or identifying central tendencies, the median is a crucial statistical measure that adds context to your visuals.

This guide will show you how to integrate the median into your reports, ensuring your team has the data-driven insights they need to make informed decisions.

What is the Best Practice for Using Power BI Median?

  • Understand the Data Distribution: You need to have a good grasp of your data distribution. Assess whether it is skewed, contains outliers, or follows a normal distribution.
  • Communicate Context: Always provide the context about what the median values represent and how they were calculated. This helps stakeholders understand the significance of the median in the data analysis.
  • Handle Missing Data Appropriately: Address null (or missing) values in the dataset before calculating the median. You may opt to exclude, impute, or handle missing values in a way that aligns with your analysis goals.
  • Use Median Alongside Other Measures: The median should be used alongside other statistical measures like mean, mode, and quartiles to gain a comprehensive understanding of the dataset’s characteristics.

What are the Advantages of Calculating the Median DAX?

  • Robustness to Outliers: Unlike the mean, the median is less sensitive to outliers. It offers a more robust measure of central tendency, especially in datasets with extreme values (or skewed distributions).
  • Reflects Central Tendency: The median accurately reflects the central tendency of the data distribution, especially in cases where the mean might be influenced by outliers. It offers a clearer picture of the typical value (or midpoint) of the dataset.
  • Ease of Interpretation: The median is easy to interpret and understand. The calculation directly identifies the middle value of a dataset, and it also provides clear insights into the data distribution.
  • Suitability for Non-Numeric Data: Unlike the mean which is only applied to numeric data, the median can be applied to both numeric and non-numeric data types like text or dates. This versatility makes it applicable across multiple datasets and analysis scenarios.

Limitations of the DAX Median Function

  • Performance with Large Datasets

The DAX MEDIAN function can be slower with large datasets, especially when used in complex reports or when dealing with millions of rows. It may impact performance compared to other aggregation methods.

  • Does Not Handle Blank Values Well

The MEDIAN function in DAX may return incorrect results if there are blank or null values in the column unless explicitly handled in the formula.

  • No Support for Weighted Median

Unlike some other tools, the DAX MEDIAN function does not support calculating a weighted median (where different values are given different levels of importance based on weight).

  • Limited to Numeric Data

The DAX MEDIAN function only works on numeric data types. It cannot be used for text, dates, or other non-numeric data.

  • No Custom Sorting

The MEDIAN function in DAX sorts the data internally before calculation, and you cannot specify a custom sorting order (e.g., sorting by a specific column before calculating the median).

DAX Median – FAQs

What is the DAX function for the median?

The DAX function for calculating the median in Power BI is MEDIAN().

Is there a function for the median?

Yes, in Power BI and DAX, the function for calculating the median is MEDIAN(). It computes the median value of a column (or expression) in a dataset.

How do you insert a median function?

To insert a median function in Power BI, use the formula MEDIAN(). After that, use the column or expression you want to calculate the median within the formula.

Wrap Up

DAX median calculates the middle value of a dataset. It helps in the robust analysis of data. With the DAX median, you can get a reliable measure of central tendency less influenced by outliers, and that aids in accurate data interpretation and decision-making.

To get the most out of the DAX median calculation, you should always validate your results. And that involves checking with other tools or manual calculations. Validating your results helps you ascertain that the median values align with expectations.

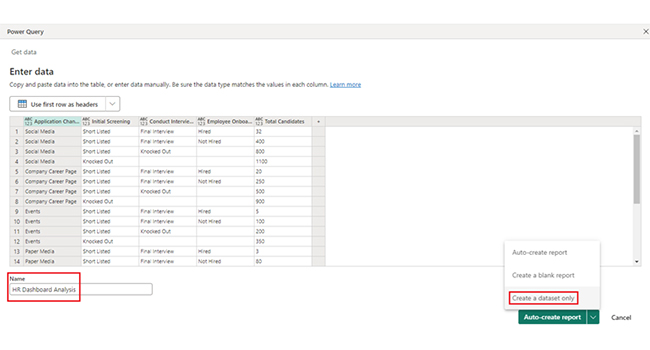
Aside from calculating the DAX median, this guide also reveals how to create an attractive dashboard in Power.

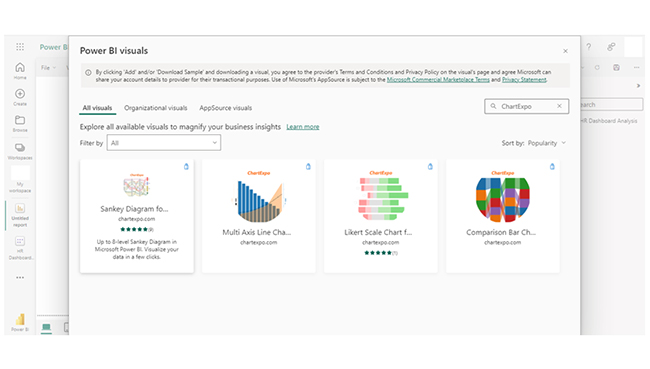
Now you know how to find out the median, what data will you be analyzing using the Sankey Chart in Power BI?

How much did you enjoy this article?

PBIAd1
Start Free Trial!
143495

Related articles

next previous
Power BI12 min read

Power BI Group By Guide for Effective Data Insights

Learn how Power BI Group By helps you aggregate data, clarify trends, and create reports by grouping values to make large datasets manageable & insightful.

Power BI12 min read

How to Create Sankey Diagram in Microsoft Power BI?

Learn How to Create Sankey Diagram in Microsoft Power BI using Desktop & Web Service. What they are and how to use them effectively.

Power BI8 min read

Power BI Artificial Intelligence: Insights Using Visuals

Discover all there is to know about the Power BI artificial intelligence. You'll also discover how AI is used in Power BI, and how to use it for analysis and more.

Power BI9 min read

Budgeting in Healthcare: Use Visuals to Spot Budget Gaps

This guide helps you discover what budgeting in healthcare is. You'll also discover the factors that affect hospital budgets and types of budgeting in healthcare.

Power BI9 min read

Predictive Analytics in Power BI for Making Insightful Visuals

This guide shows you everything you need to know about Predictive Analytics in Power BI. It also shows you how it works, and how to interpret the results.

ChartExpo logo

Turn Data into Visual
Stories

CHARTEXPO

  • Home
  • Gallery
  • Videos
  • Services
  • Pricing
  • Contact us
  • FAQs
  • Privacy policy
  • Terms of Service
  • Sitemap

TOOLS

  • ChartExpo for Google Sheets
  • ChartExpo for Microsoft Excel
  • Power BI Custom Visuals by ChartExpo
  • Word Cloud

CATEGORIES

  • Bar Charts
  • Circle Graphs
  • Column Charts
  • Combo Charts
  • Comparison Charts
  • Line Graphs
  • PPC Charts
  • Sentiment Analysis Charts
  • Survey Charts

TOP CHARTS

  • Sankey Diagram
  • Likert Scale Chart
  • Comparison Bar Chart
  • Pareto Chart
  • Funnel Chart
  • Gauge Chart
  • Radar Chart
  • Radial Bar Chart
  • Sunburst Chart
  • see more
  • Scatter Plot Chart
  • CSAT Survey Bar Chart
  • CSAT Survey Chart
  • Dot Plot Chart
  • Double Bar Graph
  • Matrix Chart
  • Multi Axis Line Chart
  • Overlapping Bar Chart
  • Control Chart
  • Slope Chart
  • Clustered Bar Chart
  • Clustered Column Chart
  • Box and Whisker Plot
  • Tornado Chart
  • Waterfall Chart
  • Word Cloud
  • see less

RESOURCES

  • Blog
  • Resources
  • YouTube
SIGN UP FOR UPDATES

We wouldn't dream of spamming you or selling your info.

© 2025 ChartExpo, all rights reserved.