Categories
The percentage of total in Power BI is one of the most important metrics that helps users draw meaningful insights from their analysis and make data-driven decisions.


In this guide, you’ll discover how to calculate the percentage of the total in Power BI and why such calculations are important.
First…
Definition: The percentage of the total in Power BI is used to express the proportion of a value compared to the total of the values given. It’s widely used to figure out the contribution of each item to the overall total. Results from this calculation are usually expressed as a percentage. It’s used to visualize relative importance (or distribution) within a Power BI dataset.
Calculating the percentage of the total in Power BI is essential for several reasons:
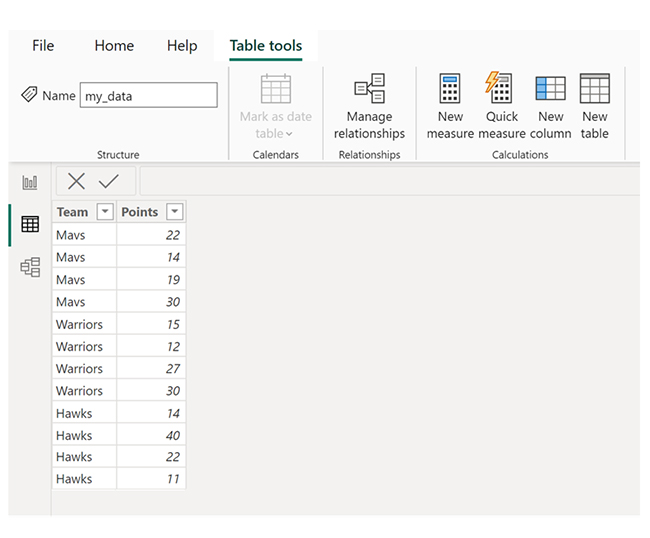
Let’s say there’s a table in Power BI named my_data, the table contains points scored by basketball players on multiple teams.
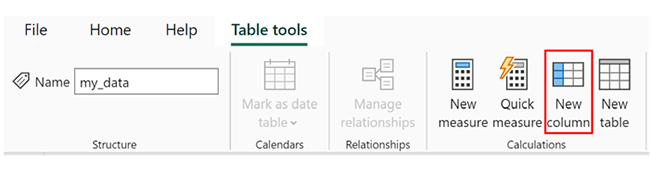
There’s the option of adding a new column to show how each value in the Points column represents a percentage of the total values in the Points column. To do that, click the “Table Tools” tab. From the options that come up, click the “New column” icon.
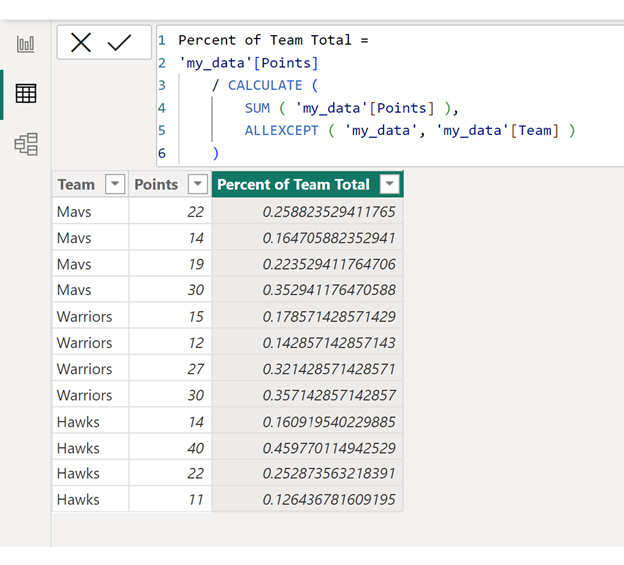
After that, input the formula below into the formula bar:
A new column named “Percent of Team Total” will be created. The column shows you how each value in the “Points” column represents a percentage of the total values in the Points column for each team.
To showcase the values as percentages, click the dropdown arrow next to the Format option. After that, click Percentage.
Each of the values in the Percent of Team Total column will be showcased as percentages.
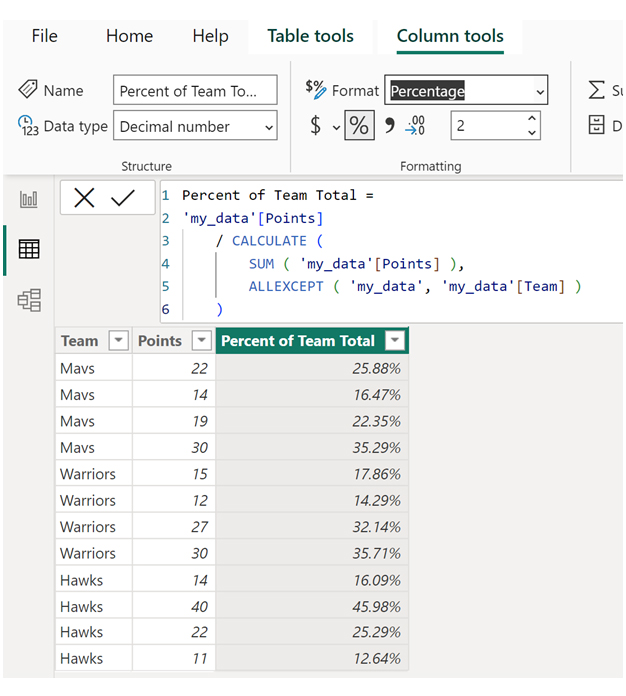
Here’s an easy way of interpreting the values in the Percent of Team Total column:
Adding up all the percentages will give a total of 100%.
Total Mavs Points: 25.88% + 16.47% + 22.35% + 35.29% = 100%.
You’ll notice the same pattern in other teams in the table.
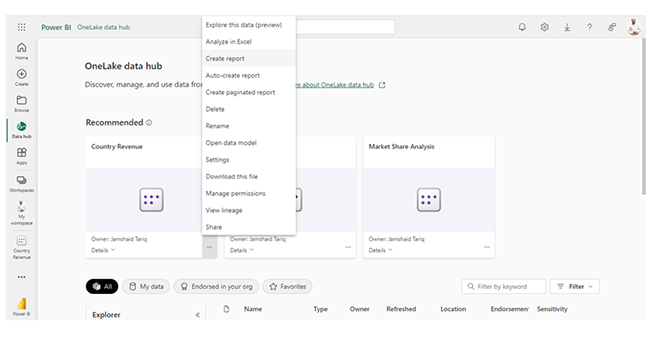
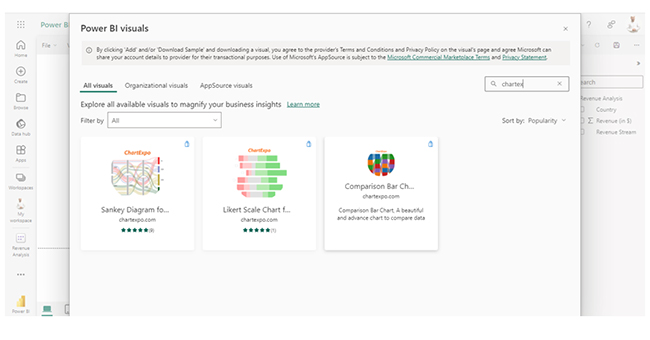
These are the steps to help you evaluate the Power BI percent of total by category:
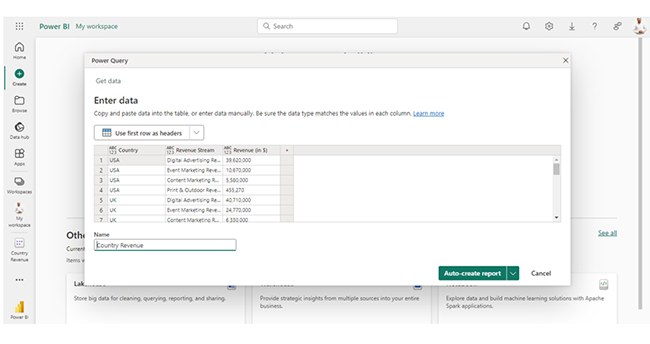
Stage 1: Logging in to Power BI


| Country | Revenue Stream | Revenue (in $) |
| USA | Digital Advertising Revenue | 39,620,000 |
| USA | Event Marketing Revenue | 10,670,000 |
| USA | Content Marketing Revenue | 5,580,000 |
| USA | Print & Outdoor Revenue | 455,270 |
| UK | Digital Advertising Revenue | 40,710,000 |
| UK | Event Marketing Revenue | 24,770,000 |
| UK | Content Marketing Revenue | 6,330,000 |
| UK | Print & Outdoor Revenue | 552,190 |
| DNK | Digital Advertising Revenue | 47,040,000 |
| DNK | Event Marketing Revenue | 29,070,000 |
| DNK | Content Marketing Revenue | 7,740,000 |
| DNK | Print & Outdoor Revenue | 600,690 |
| DNK | Media Relations Revenue | 106,430 |
| AUS | Digital Advertising Revenue | 53,790,000 |
| AUS | Event Marketing Revenue | 38,530,000 |
| AUS | Content Marketing Revenue | 6,590,000 |
| AUS | Print & Outdoor Revenue | 9,040,000 |
| AUS | Media Relations Revenue | 6,130,000 |
| FR | Digital Advertising Revenue | 57,860,000 |
| FR | Event Marketing Revenue | 50,450,000 |
| FR | Content Marketing Revenue | 3,560,000 |
| FR | Print & Outdoor Revenue | 18,790,000 |
| FR | Media Relations Revenue | 15,460,000 |
| IND | Digital Advertising Revenue | 60,470,000 |
| IND | Event Marketing Revenue | 63,200,000 |
| IND | Content Marketing Revenue | 2,080,000 |
| IND | Print & Outdoor Revenue | 29,500,000 |
| IND | Media Relations Revenue | 30,020,000 |
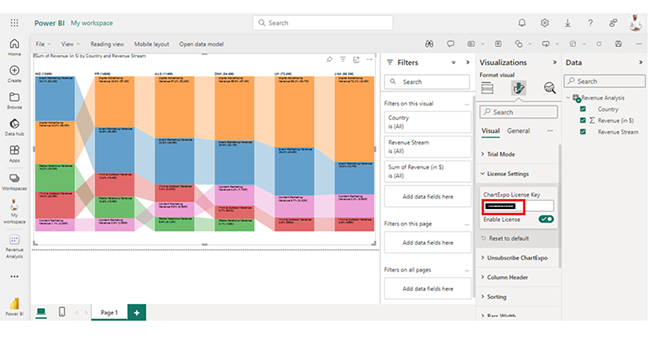
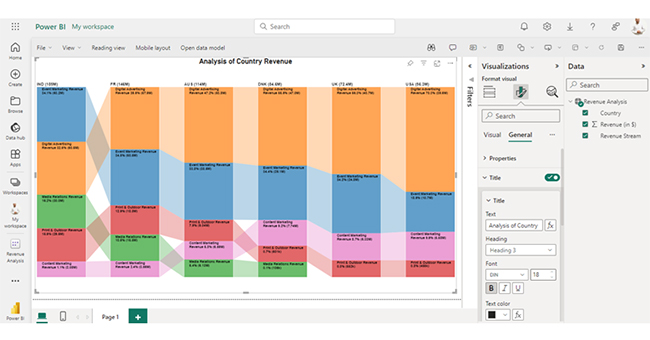
Here are the major insights from the chart:
Calculating the percentage of the total in Power BI offers several advantages that enhance data analysis and visualization. Here are some key advantages:
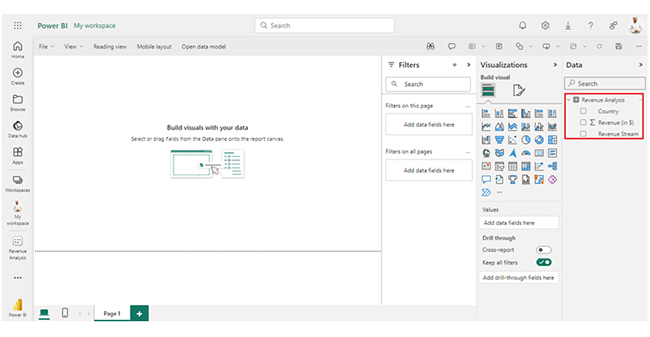
First, you need to create a measure using DAX to calculate the percentage. After that, add it to the visualization along with other relevant fields for comparison.
The formula below is used for calculating percentage with DAX in Power BI:
Measure for Total Sales:
Total Sales = SUM(Sales[SalesAmount])
Measure for Sales Percentage:
Sales Percentage = DIVIDE(SUM(Sales[SalesAmount]), [Total Sales], 0)
A good grasp of the percentage of total in Power BI helps users analyze the relative contributions within the data. Calculating it involves comparing individual values against the total. To do that, use DAX to create a measure that divides the value by the total, and multiplies it by 100.
The percentage of total in Power BI plays a crucial role in:
Following the steps in this guide will make you a proficient Power BI user over time. This way, you’ll be able to create interactive and engaging visualizations.
Now you know the benefits of calculating the percentage of total in Power BI, what type of data will you be analyzing, and what will you be looking out for?
How much did you enjoy this article?


Discover diverse and high-quality Power BI report examples for inspiration and insights. Elevate your reporting with strategic visualization techniques.

A Customer Relationship Management Dashboard centralizes data, tracks key metrics, and drives smarter business decisions. Discover now!

Explore Healthcare Dashboard Examples and learn how to turn complex healthcare data into clear, actionable insights for better decision-making.


