• Home
  • Tools dropdown img
    • Spreadsheet Charts

      • ChartExpo for Google Sheets
      • ChartExpo for Microsoft Excel
    • Power BI Charts

      • Power BI Custom Visuals by ChartExpo
    • Word Cloud

  • Charts dropdown img
    • Chart Category

      • Bar Charts
      • Circle Graphs
      • Column Charts
      • Combo Charts
      • Comparison Charts
      • Line Graphs
      • PPC Charts
      • Sentiment Analysis Charts
      • Survey Charts
    • Chart Type

      • Box and Whisker Plot
      • Clustered Bar Chart
      • Clustered Column Chart
      • Comparison Bar Chart
      • Control Chart
      • CSAT Survey Bar Chart
      • CSAT Survey Chart
      • Dot Plot Chart
      • Double Bar Graph
      • Funnel Chart
      • Gauge Chart
      • Likert Scale Chart
      • Matrix Chart
      • Multi Axis Line Chart
      • Overlapping Bar Chart
      • Pareto Chart
      • Radar Chart
      • Radial Bar Chart
      • Sankey Diagram
      • Scatter Plot Chart
      • Slope Chart
      • Sunburst Chart
      • Tornado Chart
      • Waterfall Chart
      • Word Cloud
    • Google Sheets
      Microsoft Excel
  • Services
  • Pricing
  • Contact us
  • Blog
  • Support dropdown img
      • Gallery
      • Videos
      • Contact us
      • FAQs
      • Resources
    • Please feel free to contact us

      atsupport@chartexpo.com

Categories
All Data Visualizations Data Analytics Surveys
Add-ons/
  • Google Sheets
  • Microsoft Excel
  • Power BI
All Data Visualizations Data Analytics Surveys
Add-ons
  • Google Sheets
  • Microsoft Excel
  • Power BI

We use cookies

This website uses cookies to provide better user experience and user's session management.
By continuing visiting this website you consent the use of these cookies.

Ok

ChartExpo Survey


Home > Blog > Surveys

Customer Care Surveys for Enhanced Insights

Customer care surveys are like the ultimate truth serum for businesses. They reveal what customers think about their experiences, frustrations, and desires.

Customer Care Surveys

But here’s the catch – surveys alone are like pieces of a puzzle waiting to be assembled.

Don’t worry – you don’t need to be a spreadsheet wizard or a data scientist. We will walk you through the process, leaving no stone unturned. From importing the data, cleaning, and organizing it to performing various analyses and creating visually appealing visualizations.

In the end, you’ll be a master at deciphering what your customers are trying to tell you. And who knows, you might even discover a few surprising insights along the way.

Table of Contents:

  1. What are Customer Care Surveys?
  2. Why are Customer Care Surveys Important?
  3. Best Survey Questions for Customer Care Surveys
  4. Advantages of Customer Care Surveys
  5. How to Crafting Effective Customer Care Surveys?
  6. How to Interpreting Customer Care Surveys?
  7. Wrap Up

Let’s get started.

What are Customer Care Surveys?

Customer care surveys are feedback tools used by businesses to gauge customer satisfaction. They consist of questions about a customer’s experience with a product or service. These surveys help understand customers’ likes and dislikes, creating room for improvements and building stronger customer relationships. Therefore, gathering and analyzing this feedback is essential for businesses aiming to provide better service and products.

Why are Customer Care Surveys Important?

Customer care surveys are like the secret sauce that keeps your business thriving and your customers smiling. Stick around, and let me show you how important these surveys are.

  • Customer feedback: First off, they’re like the customer’s secret diary. You get to peek inside their minds and find out what they think about your product or service. Gone are the days of guesswork; now, you can harness pure, unfiltered customer feedback with these survey ideas.
  • Measure customer satisfaction: Have you ever wondered if your customers are doing cartwheels of joy or rolling their eyes in frustration? Surveys are your satisfaction meter, giving you a precise reading of how happy or grumpy your customers are.
  • Identify improvement areas: Imagine customer care surveys as treasure maps, leading you to where things need fixing. These surveys will expose everything – from website hiccups to slow customer service. Once identified, you can prioritize and make necessary changes to enhance the customer experience.
  • Enhance customer loyalty: Picture this – a satisfied customer is like a loyal friend who brings more friends to the party. Fixing issues raised in surveys not only makes one customer happy; you’re building an army of brand advocates.
  • Competitive advantage: In the ruthless arena of business, standing out is the name of the game. Surveys demonstrate a commitment to listening to your customers, showing that you care. And caring is cool! When you act on their feedback, you create a unique selling point, helping you gain a competitive edge.
  • Data-driven decision-making: Data is the secret sauce behind smart business moves. Customer care surveys hand you that data on a silver platter. Thus, you can take more efficiently your data-driven decision-making about product development, marketing strategies, or customer service training.

Choosing the Best Survey Questions for Customer Care Surveys

Selecting the right customer care survey questions is like choosing the perfect ingredients for a delicious dish. It requires careful thought and consideration. Here’s how to whip up the ideal survey:

  1. Define your objectives: Before writing the questions, you must know what you’re trying to achieve. Are you aiming to measure customer satisfaction, gather product feedback, or understand user preferences? Define your objectives clearly to guide question creation.
  2. Identify key metrics: What data points will lead you to your treasure? Think of these as your X marks the spot. To measure customer satisfaction, you can ask about overall satisfaction, product quality, and customer support. If you’re collecting product feedback, inquire about features, usability, and improvements.
  3. Consider your audience: Your audience’s characteristics matter. Tailor your questions to their demographics, interests, and familiarity with your product or service. What’s relevant to one group may not be to another. For instance, tech-savvy users appreciate detailed technical questions, while beginners prefer simpler language.
  4. Keep it clear and concise: Imagine your survey is a conversation with a friend. You wouldn’t confuse them with jargon or convoluted sentences, right? Keep your questions clear, concise, and free from ambiguity. Avoid jargon or technical terms unless you’re sure your audience understands them.
  5. Use closed and open-ended questions: Mix it up! Closed-ended questions (e.g., multiple-choice or rating scale questions) are great for quantitative data collection, allowing for easy analysis. Open-ended questions (e.g., “What suggestions do you have?”) provide qualitative insights and can uncover unexpected issues or ideas. Balance both types to get a comprehensive view.

Advantages of Customer Care Surveys

Crafting effective customer care surveys is crucial to gather valuable insights. Here are some sample surveys you can consider:

  • Overall Satisfaction

On a scale of 1 to 10, how satisfied are you with our customer care services?

  • Communication

How would you rate the clarity and effectiveness of communication from our customer care team?

  • Response Time

Were you satisfied with the response time from our customer care team?

  • Problem Resolution

How well did our customer care team resolve your issue?

  • Knowledge and Expertise

To what extent did you find our customer care representatives knowledgeable and helpful?

  • Accessibility

How easy was it for you to reach our customer care team when you needed assistance?

  • Courtesy and Professionalism

How would you rate the courtesy and professionalism of our customer care representatives?

  • Feedback Process

Did you feel that your feedback and concerns were actively listened to and addressed?

  • Likelihood to Recommend

On a scale of 1 to 10, how likely are you to recommend our customer care services to others?

  • Suggestions for Improvement

What specific improvements or changes would you suggest for our customer care services?

How to Crafting Effective Customer Care Surveys?

Let’s say you want to conduct a customer care survey with the following questions.

  • How satisfied were you with the timeliness of the service?
  • How satisfied are you with the cleanliness of the work area after the service?
  • How satisfied are you with the overall value for the price you paid?

You want your respondents to provide an answer to each question using the response scale below:

  1. Extremely Dissatisfied
  2. Dissatisfied
  3. Neutral
  4. Satisfied
  5. Extremely Satisfied

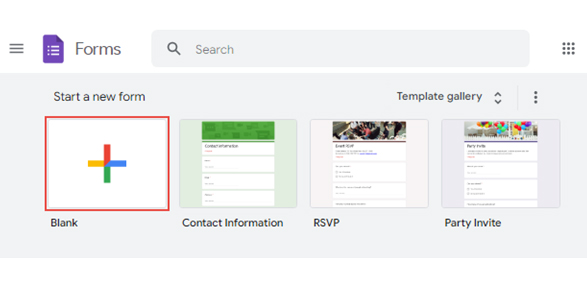
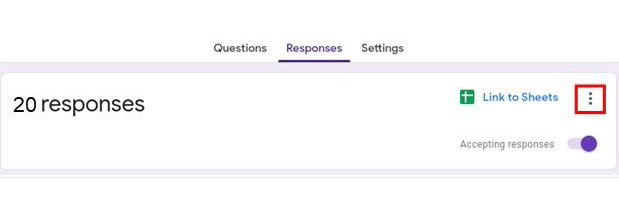
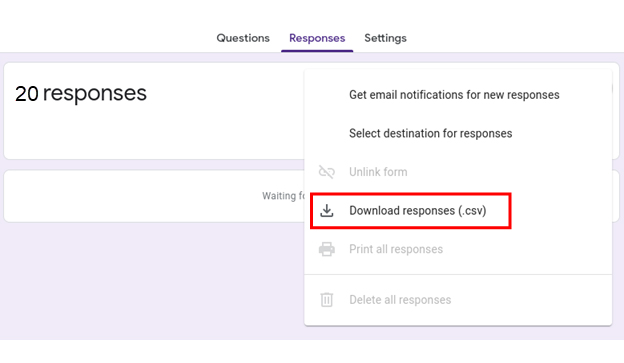
To create your survey using Google Forms;

  • Open Google Forms and sign in with your Google account.
  • Click the “Blank” button to create a new form.
Google Form Survey Template ce472 1
  • Give your form a title and description that reflects your brand or purpose.
  • Choose the type of question you want to use, such as multiple-choice, checkbox, or short answer.
  • Type your question in the “Untitled Question” section for multiple-choice questions. Then write “Option 1” and choose “Add option” for more options.
Google Form Survey Template ce472 2
  • You can customize the look and feel of your survey to match your brand or theme.
  • Preview the form before sharing it with your target audience.
  • Click the share button to distribute it to your target audience.
Google Form Survey Template ce472 3
  • Once you collect enough responses, click the “Link to Sheets” button.
Google Form Survey Template ce472 4
  • Download the responses as a .csv file from the drop-down menu.
Google Form Survey Template ce472 5

How to Interpreting Customer Care Surveys?

Data visualizations are the superheroes of survey analysis, rescuing us from the clutches of mind-numbing spreadsheets. They transform raw data into captivating visuals, revealing hidden patterns and insights with a single glance. But alas, Excel falls short when it comes to the art of visual storytelling.

Fear not, for ChartExpo is here to rescue you.

It’s time to level up your survey analysis game and unleash the power of data visualizations. ChartExpo’s powerful tools and charts allow you to analyze customer care surveys like a boss.

Benefits of Using ChartExpo

  • ChartExpo’s visualization arsenal is as vast as a galaxy, offering many options tailored to your data’s needs. All you have to do is pick the best.
  • ChartExpo’s user interface is so intuitive that visualizing data is as easy as breathing. Its magical touch helps you conjure insightful, appealing charts without needing to speak the language of code.
  • ChartExpo is the Picasso of data visualization, allowing you to unleash your inner artist. Customize your visuals with colors, fonts, and styles to create masterpieces that embody your unique flair.
  • With ChartExpo, your investment is worth its weight in gold. Enjoy a free 7-day trial, then unlock a world of data visualization wonders at $10 monthly.

How to Install ChartExpo in Excel?

  1. Open your Excel application.
  2. Open the worksheet and click the “Insert” menu.
  3. You’ll see the “My Apps” option.
  4. In the office Add-ins window, click “Store” and search for ChartExpo on my Apps Store.
  5. Click the “Add” button to install ChartExpo in your Excel.

ChartExpo charts are available both in Google Sheets and Microsoft Excel. Please use the following CTA’s to install the tool of your choice and create beautiful visualizations in a few clicks in your favorite tool.

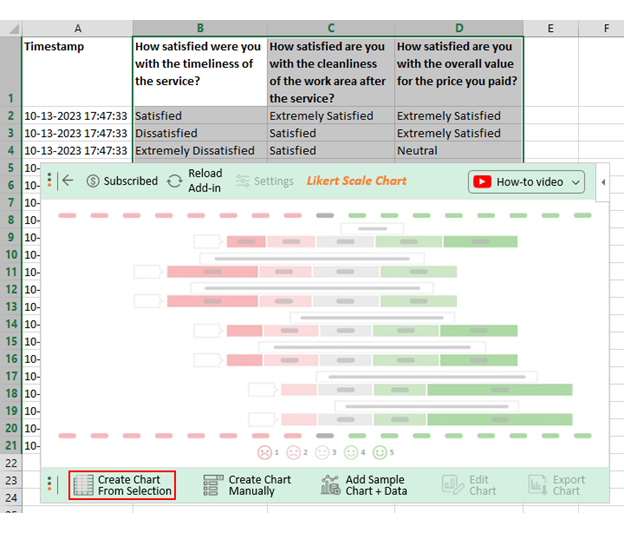
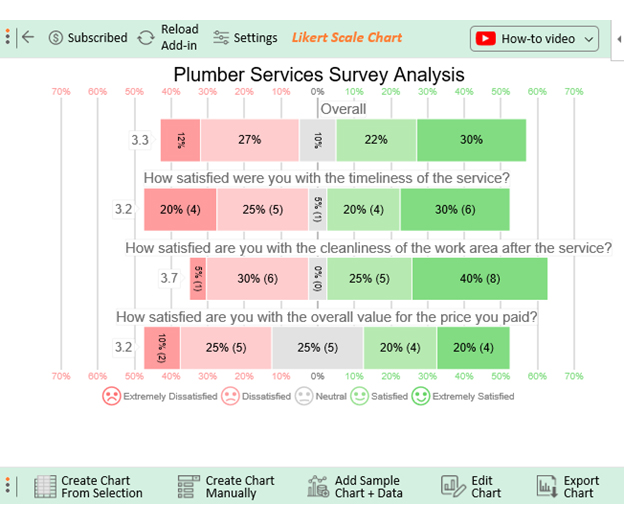
Let’s say your survey yields the data table below.

Timestamp How satisfied were you with the timeliness of the service? How satisfied are you with the cleanliness of the work area after the service? How satisfied are you with the overall value for the price you paid?
10-13-2023 17:47:33 Satisfied Extremely Satisfied Extremely Satisfied
10-13-2023 17:47:33 Dissatisfied Satisfied Extremely Satisfied
10-13-2023 17:47:33 Extremely Dissatisfied Satisfied Neutral
10-13-2023 17:47:33 Extremely Satisfied Extremely Satisfied Neutral
10-13-2023 17:47:33 Dissatisfied Dissatisfied Dissatisfied
10-13-2023 17:47:33 Extremely Dissatisfied Satisfied Dissatisfied
10-13-2023 17:47:33 Extremely Satisfied Dissatisfied Extremely Dissatisfied
10-13-2023 17:47:33 Neutral Extremely Satisfied Satisfied
10-13-2023 17:47:33 Extremely Dissatisfied Satisfied Extremely Dissatisfied
10-13-2023 17:47:33 Extremely Satisfied Extremely Satisfied Extremely Satisfied
10-13-2023 17:47:34 Satisfied Dissatisfied Satisfied
10-13-2023 17:47:35 Satisfied Extremely Satisfied Satisfied
10-13-2023 17:47:36 Dissatisfied Dissatisfied Satisfied
10-13-2023 17:47:37 Extremely Satisfied Extremely Satisfied Neutral
10-13-2023 17:47:38 Satisfied Extremely Dissatisfied Dissatisfied
10-13-2023 17:47:39 Dissatisfied Extremely Satisfied Neutral
10-13-2023 17:47:40 Extremely Satisfied Dissatisfied Extremely Satisfied
10-13-2023 17:47:41 Extremely Satisfied Dissatisfied Dissatisfied
10-13-2023 17:47:42 Dissatisfied Extremely Satisfied Neutral

This table contains example data. Expect many responses and questions in real life.

  • To get started with ChartExpo, install ChartExpo in Excel.
  • Now Click on My Apps from the INSERT menu.
insert chartexpo in excel
  • Choose ChartExpo from My Apps, then click Insert.
open chartexpo in excel
  • Once it loads, choose the “Likert Scale Chart” from the charts list.
search likert scale chart in excel
  • Click the “Create Chart From Selection” button after selecting the data from the sheet, as shown.
Create Chart From Selection ce472
  • When you click the “Create Chart From Selection” button, you have to map responses with numbers manually. The Likert scale has this arrangement:
  • Extremely Dissatisfied = 1
  • Dissatisfied = 2
  • Neutral = 3
  • Satisfied = 4
  • Extremely Satisfied = 5
  • Once all is set, click the “Create Chart” button.
Map Likert Scale Chart ce472
  • ChartExpo will generate the visualization below for you.
Customer Care Surveys Design Template
  • If you want to have the chart’s title, click Edit Chart, as shown in the above image.
  • Click the pencil icon next to the Chart Header to change the title.
  • It will open the properties dialog. Under the Text section, you can add a heading in Line 1 and enable Show.
  • Give the appropriate title of your chart and click the Apply button.
Apply Tittle on Chart ce472
  • Let’s say you want to add text responses instead of numbers against every emoji.
  • Click the pencil icon next to the respective emoji. Expand the “Label” properties and write the required text. Then click the “Apply All” button.
  • Click the “Save Changes” button to persist the changes.
Apply Label on Chart ce472
  • Your final chart will appear below.
Final Customer Care Surveys

Insights

  • 50% of customers expressed satisfaction with the timeliness of the service. 45% expressed dissatisfaction, and 5% had no strong opinion.
  • 65% reported satisfaction with the cleanliness of the work area after the service, while 35% expressed dissatisfaction.
  • 40% indicated satisfaction with the overall value for the price paid, while 35% expressed dissatisfaction.
  • In summary;
    • 52% of customers are satisfied with Plumber Services, with 30% being extremely satisfied.
    • 39% expressed dissatisfaction, with 12% being extremely dissatisfied.
    • 10% remained neutral.

FAQs

What are customer care surveys?

Customer care surveys are a feedback tool to gather insights about customer experiences with products or services. Typically, it consists of questions to assess satisfaction, preferences, and areas for improvement.

What are 5 good survey questions?

  1. On a scale of 1 to 10, how satisfied are you with our product/service?
  2. What do you like most about our product/service?
  3. What improvements would you suggest?
  4. How often do you use our product/service?
  5. Would you recommend us to a friend?

What is the role of customer care?

Customer care plays a pivotal role in business by providing support, resolving issues, and ensuring customer satisfaction. It enhances brand loyalty, fosters positive relationships, and can lead to repeat business and referrals. Thus, it significantly contributes to a company’s success and growth.

Wrap Up

Our journey through customer care surveys and Excel analysis has been nothing short of enlightening. We’ve unveiled the importance of these surveys as the compass guiding businesses through the maze of customer satisfaction.

We’ve also discovered the importance of clear objectives, identifying key metrics, and tailoring questions to your audience. With these skills, you can tackle any survey analysis mission with confidence. Data visualizations are your superhero cape, making your insights leap off the page and into action.

Although a trusty companion, Excel often falls short of creating dazzling data presentations. That’s where ChartExpo steps in, helping you create charts and graphs that captivate and enlighten you. It’s the dynamic duo you never knew you needed.

Conclusively, whatever your customer care objective is, analyzing Excel surveys with ChartExpo is your ticket to success. Embrace the power of surveys, Excel, and ChartExpo, and let the journey of customer care excellence begin!

How much did you enjoy this article?

PBIAd1
Start Free Trial!
131251

Related articles

next previous
Surveys7 min read

Workplace Culture Surveys: Visual Perception, Not Guesswork

This guide dives deep into what the workplace culture survey is. You'll also discover what an employee culture survey is, and top 10 culture survey questions.

Surveys11 min read

How to Interpret 4-Point Likert Scale Results?

Click to learn How to Create, Gather and Analyze Data Using the 4-Point Likert Scale? A complete guide with definition, examples, uses, and applications.

Surveys7 min read

Benchmark for Surveying: Visual Insights

This guide dives deep into benchmarks for surveying. It shows you what it is, and the types of benchmarks in the survey. You'll also discover how to analyze it.

Surveys13 min read

5 Point Likert Scale Analysis, Interpretation & Examples

Dive deep into the realm of 5-point Likert Scale Analysis and Interpretation to unravel the sentiments behind your responses. Gain actionable insights today.

Surveys11 min read

3-Point Likert Scale: Range Interpretation & Analysis

Learn the basics of the 3-point Likert scale, including examples, benefits, and when it's best applied in research and feedback forms.

ChartExpo logo

Turn Data into Visual
Stories

CHARTEXPO

  • Home
  • Gallery
  • Videos
  • Services
  • Pricing
  • Contact us
  • FAQs
  • Privacy policy
  • Terms of Service
  • Sitemap

TOOLS

  • ChartExpo for Google Sheets
  • ChartExpo for Microsoft Excel
  • Power BI Custom Visuals by ChartExpo
  • Word Cloud

CATEGORIES

  • Bar Charts
  • Circle Graphs
  • Column Charts
  • Combo Charts
  • Comparison Charts
  • Line Graphs
  • PPC Charts
  • Sentiment Analysis Charts
  • Survey Charts

TOP CHARTS

  • Sankey Diagram
  • Likert Scale Chart
  • Comparison Bar Chart
  • Pareto Chart
  • Funnel Chart
  • Gauge Chart
  • Radar Chart
  • Radial Bar Chart
  • Sunburst Chart
  • see more
  • Scatter Plot Chart
  • CSAT Survey Bar Chart
  • CSAT Survey Chart
  • Dot Plot Chart
  • Double Bar Graph
  • Matrix Chart
  • Multi Axis Line Chart
  • Overlapping Bar Chart
  • Control Chart
  • Slope Chart
  • Clustered Bar Chart
  • Clustered Column Chart
  • Box and Whisker Plot
  • Tornado Chart
  • Waterfall Chart
  • Word Cloud
  • see less

RESOURCES

  • Blog
  • Resources
  • YouTube
SIGN UP FOR UPDATES

We wouldn't dream of spamming you or selling your info.

© 2025 ChartExpo, all rights reserved.