• Home
  • Tools dropdown img
    • Spreadsheet Charts

      • ChartExpo for Google Sheets
      • ChartExpo for Microsoft Excel
    • Power BI Charts

      • Power BI Custom Visuals by ChartExpo
    • Word Cloud

  • Charts dropdown img
    • Chart Category

      • Bar Charts
      • Circle Graphs
      • Column Charts
      • Combo Charts
      • Comparison Charts
      • Line Graphs
      • PPC Charts
      • Sentiment Analysis Charts
      • Survey Charts
    • Chart Type

      • Box and Whisker Plot
      • Clustered Bar Chart
      • Clustered Column Chart
      • Comparison Bar Chart
      • Control Chart
      • CSAT Survey Bar Chart
      • CSAT Survey Chart
      • Dot Plot Chart
      • Double Bar Graph
      • Funnel Chart
      • Gauge Chart
      • Likert Scale Chart
      • Matrix Chart
      • Multi Axis Line Chart
      • Overlapping Bar Chart
      • Pareto Chart
      • Radar Chart
      • Radial Bar Chart
      • Sankey Diagram
      • Scatter Plot Chart
      • Slope Chart
      • Sunburst Chart
      • Tornado Chart
      • Waterfall Chart
      • Word Cloud
    • Google Sheets
      Microsoft Excel
  • Services
  • Pricing
  • Contact us
  • Blog
  • Support dropdown img
      • Gallery
      • Videos
      • Contact us
      • FAQs
      • Resources
    • Please feel free to contact us

      atsupport@chartexpo.com

Categories
All Data Visualizations Data Analytics Surveys
Add-ons/
  • Google Sheets
  • Microsoft Excel
  • Power BI
All Data Visualizations Data Analytics Surveys
Add-ons
  • Google Sheets
  • Microsoft Excel
  • Power BI

We use cookies

This website uses cookies to provide better user experience and user's session management.
By continuing visiting this website you consent the use of these cookies.

Ok

ChartExpo Survey


Home > Blog > Surveys

Top Market Analysis Templates: Unlocking Potential

Data is power. But raw data alone is not enough to help you conquer the market.

A market analysis template organizes data into a cohesive story. It helps you answer critical questions like: What are the market opportunities? What do customers want? Who are the competitors, and what are their strengths and weaknesses?

market analysis template

From data collection to market strategy, this template streamlines the entire journey. It provides a structured framework to assess, plan, and execute. Consequently, it ensures you make informed decisions and stay ahead of the curve.

In this guide, we will delve into the significance of a market assessment template. We’ll explore how it simplifies complex data, empowers strategic decision-making, and ultimately leads to business success.

Table of Content:

  1. What is a Market Analysis Template?
  2. Video Tutorial: Visualize Market Analysis Template
  3. Why is the Template for Market Analysis so Important?
  4. Top 5 Industry Analysis Template Examples
  5. How to Create a Market Evaluation Template?
    • Step 1: Define the Purpose
    • Step 2: Outline Key Sections
    • Step 3: Collect Reliable Data
    • Step 4: Structure the Template
    • Step 5: Add Customization Options
    • Step 6: Review and Refine
  6. How to Use a Market Analysis Template?
  7. How to Analyze a Market Analysis Template Excel?
  8. How to Download and Use the Market Analysis Template for a Business Plan?
  9. Benefits of the Marketing Analysis Template
  10. Market Analysis Templates – FAQs
  11. Wrap Up

What is a Market Analysis Template?

Definition: A market analysis template is a ready-made framework that helps businesses organize and evaluate key market information. It typically includes sections for industry trends, customer demographics, market size, and competitor analysis. By using a structured template, companies can save time, ensure no critical factor is overlooked, and make more informed decisions.

These templates, often available in Excel, Word, or online tools, guide you through the process of identifying opportunities, assessing risks, and understanding customer needs. Whether for startups or established businesses, a market analysis template provides a clear structure for turning raw data into actionable insights.

Key Components of a Market Analysis Format:

  1. Executive Summary: A concise overview highlighting the most important findings, opportunities, and recommendations from the analysis.
  2. Industry Overview: Details about the industry’s size, growth rate, and influencing factors such as regulations, technology, or economic conditions.
  3. Target Market Analysis: Identify demand potential by defining your ideal customers by demographics, preferences, and buying behaviors.
  4. Competitive Analysis: Evaluates competitors’ strengths, weaknesses, and strategies to understand market positioning and gaps.
  5. Market Opportunities and Risks: Identifies growth opportunities and highlights potential challenges or barriers that may affect success.

Video Tutorial: Visualize Market Analysis Template

Why is the Template for Market Analysis so Important?

You might be thinking, “Why is the Template for Market Analysis so Important?” Let me tell you why:

  • Ensures a Structured Approach

A market assessment template provides a ready-made framework that ensures all critical aspects, such as industry trends, customer demographics, and competitor analysis, are covered systematically.

  • Saves Time and Reduces Errors

Instead of creating reports from scratch, templates streamline the process. This efficiency reduces mistakes and allows teams to focus on analyzing insights rather than formatting.

  • Supports Better Decision-Making

With organized data, businesses can make informed choices about product development, marketing strategies, and investment opportunities.

  • Transforms Data into Actionable Insights

By simplifying complex research, the template helps turn raw information into practical steps that directly support business growth.

Top 5 Industry Analysis Template Examples

  • SWOT Analysis Template

Helps identify strengths, weaknesses, opportunities, and threats. A great tool for understanding internal and external business factors at a glance.

  • Competitor Analysis Template

Tracks competitor strategies, pricing, product positioning, and market share to reveal gaps and opportunities for your business.

  • Customer Demographics Template

Organizes data about age, income, location, and buying behaviors, helping businesses define their target audience more effectively.

  • Industry Trends Template

Highlights current and emerging market trends, enabling better forecasting and strategic planning.

  • Market Opportunity Template

Evaluates potential growth areas, risks, and untapped segments to guide decision-making and business expansion.

How to Create a Market Evaluation Template?

  • Step 1: Define the Purpose

Decide why you need the template, whether for identifying opportunities, tracking competitors, or guiding strategy.

  • Step 2: Outline Key Sections

Include essential areas like industry overview, target market, customer insights, competitor analysis, and risks.

  • Step 3: Collect Reliable Data

Gather accurate information from market research reports, surveys, and industry publications.

  • Step 4: Structure the Template

Organize the data into a clear format using tables, charts, or bullet points for easy readability.

  • Step 5: Add Customization Options

Leave space for company-specific data, unique KPIs, or market-specific factors.

  • Step 6: Review and Refine

Check for completeness, accuracy, and clarity before finalizing the template for use.

How to Use a Market Analysis Template?

Let’s use a market analysis sample to learn how to use a marketing analytics template.

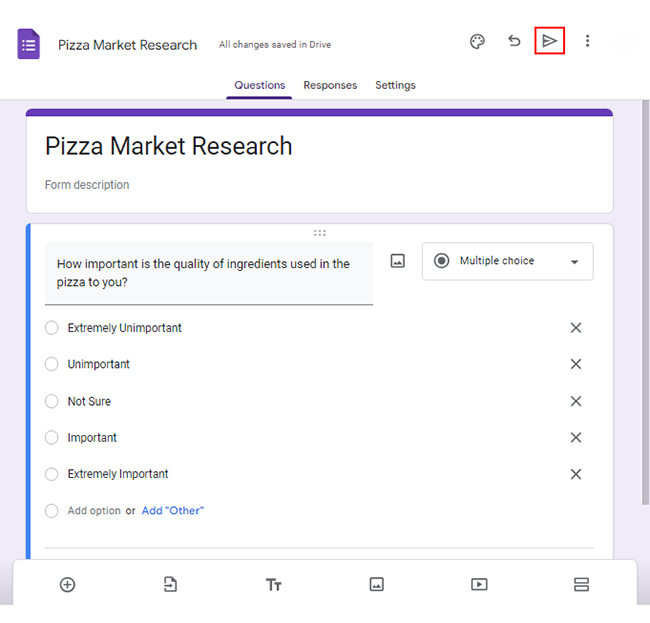
Assume you want to launch a restaurant in the market. This prompts you first to understand what customers want. Therefore, you want to conduct market research with the following questions.

  • How important is the quality of ingredients used in the pizza to you?
  • How important is the price of the pizza to its quality?
  • How important is the crust thickness of the pizza to you?
  • How important is the cleanliness of the pizza restaurant to you?

Below are the responses associated with each question:

  1. Extremely Unimportant
  2. Unimportant
  3. Not Sure
  4. Important
  5. Extremely Important

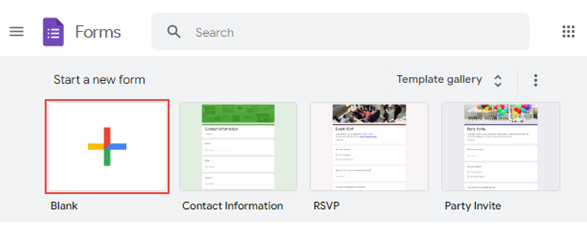
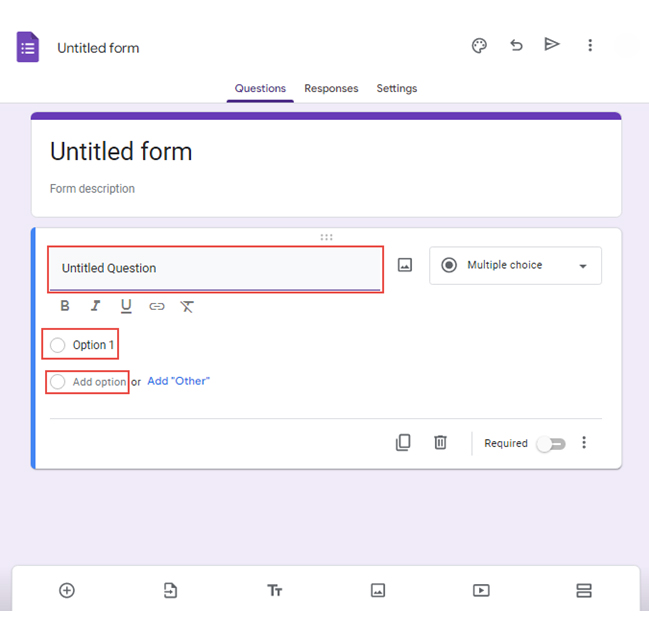
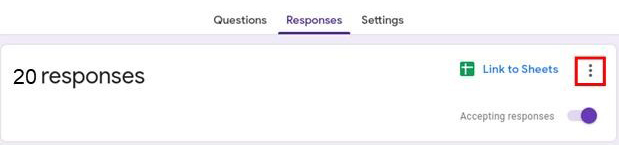
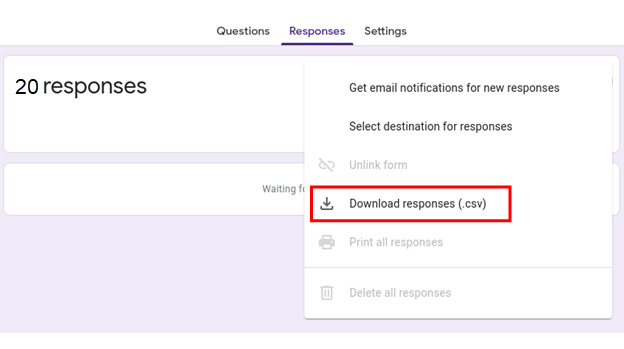
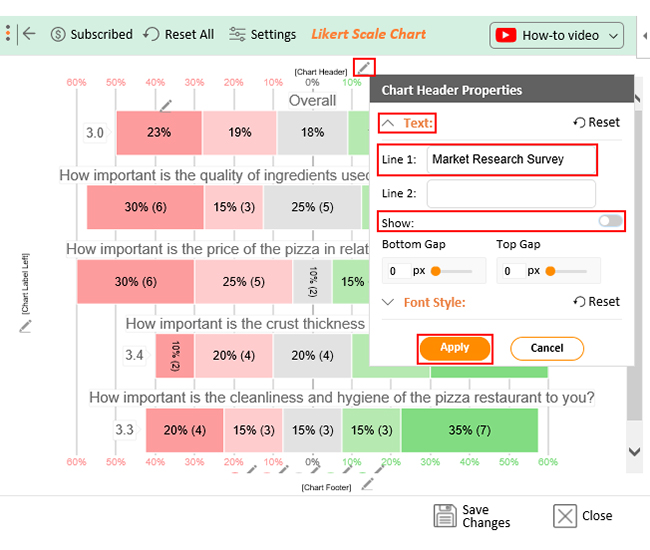
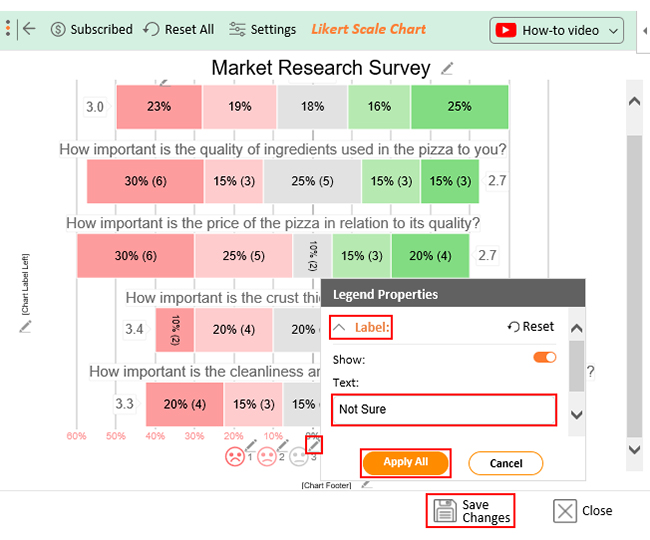
Follow the steps below to learn how to use a market analysis template with Google Forms.

  • Open Google Forms and sign in with your Google account.
  • Click the “Blank” button to create a new form.
survey in google forms 1 ce435
  • Give your form a title and description that reflects your brand or purpose.
  • Choose the type of question you want to use, such as multiple-choice, checkbox, or short answer.
  • Type your question in the “Untitled Question” section for multiple-choice questions. Then write “Option 1” and choose “Add option” for more options.
survey in google forms 2 ce435
  • You can customize the look and feel of your survey to match your brand or theme.
  • Preview the form before sharing it with your target audience.
  • Click the share button to distribute it to your target audience.
survey in google forms 3 ce435
  • Once you collect enough responses, click the “Link to Sheets” button.
survey in google forms 4 ce435
  • Download the responses as a .csv file from the drop-down menu.
survey in google forms 5 ce435

How to Analyze a Market Analysis Template Excel?

Data analysis is the super-sleuth of the business world. But here’s the kicker: data without the right visuals is like Batman without the Bat-Signal.

That’s where data visualization swoops in like a caped crusader, making complex numbers look cool and understandable. But alas, Excel, the trusty companion of many, falters in the face of visual prowess.

This is where ChartExpo’s prowess comes into play. With ChartExpo, you can effortlessly bring your data to life. It lets you create captivating, insightful visuals that convey insights with a single glance.

Say goodbye to dull spreadsheets and hello to a world where data speaks volumes.

Benefits of Using ChartExpo

  • Say goodbye to data analysis headaches and hello to streamlined insights and presentations. ChartExpo offers an array of visualizations to cater to your data needs.
  • ChartExpo’s user interface is so intuitive that it’s like creating visualizations on autopilot. No coding skills are required, just pure insightful Excel charts at your fingertips.
  • Unleash your creativity with ChartExpo’s customization options. Personalize your visuals and make them shine with the perfect colors, fonts, and styles that tickle your fancy.
  • Get the best bang for your buck with ChartExpo. Try it out for free for 7 days. Then, enjoy the value-packed $10 monthly plan. It’s like having a data analysis genie at your service without breaking the bank.

How to Install ChartExpo in Excel?

  1. Open your Excel application.
  2. Open the worksheet and click the “Insert” menu.
  3. You’ll see the “My Apps” option.
  4. In the office Add-ins window, click “Store” and search for ChartExpo on my Apps Store.
  5. Click the “Add” button to install ChartExpo in your Excel.

ChartExpo charts are available both in Google Sheets and Microsoft Excel. Please use the following CTA’s to install the tool of your choice and create beautiful visualizations in a few clicks in your favorite tool.

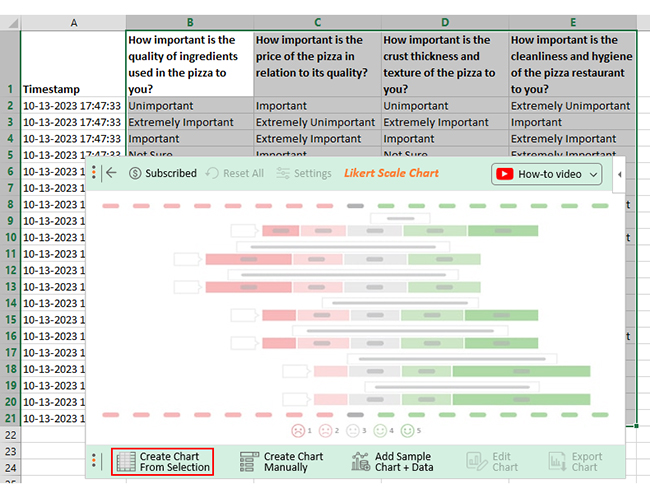
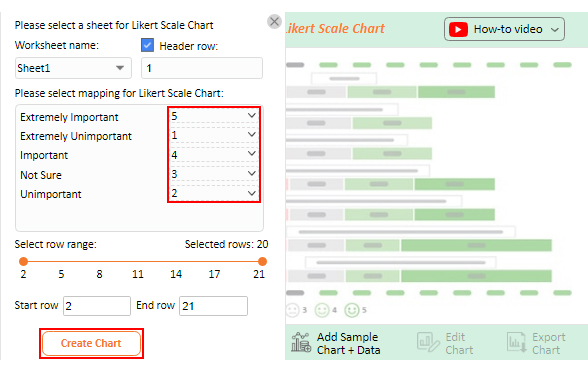
Let’s say your survey yields the data table below.

Timestamp How important is the quality of ingredients used in the pizza to you? How important is the price of the pizza in relation to its quality? How important is the crust thickness of the pizza to you? How important is the cleanliness of the pizza restaurant to you?
10-13-2023 17:47:33 Unimportant Important Unimportant Extremely Unimportant
10-13-2023 17:47:33 Extremely Important Extremely Unimportant Extremely Important Important
10-13-2023 17:47:33 Important Extremely Important Important Extremely Important
10-13-2023 17:47:33 Not Sure Important Not Sure Extremely Important
10-13-2023 17:47:33 Unimportant Extremely Unimportant Extremely Important Not Sure
10-13-2023 17:47:33 Not Sure Unimportant Unimportant Not Sure
10-13-2023 17:47:33 Extremely Important Extremely Important Extremely Important Extremely Unimportant
10-13-2023 17:47:33 Not Sure Important Not Sure Unimportant
10-13-2023 17:47:33 Not Sure Unimportant Unimportant Extremely Unimportant
10-13-2023 17:47:33 Extremely Unimportant Unimportant Important Unimportant
10-13-2023 17:47:33 Important Unimportant Unimportant Important
10-13-2023 17:47:34 Extremely Unimportant Extremely Important Not Sure Not Sure
10-13-2023 17:47:35 Extremely Unimportant Extremely Unimportant Not Sure Unimportant
10-13-2023 17:47:36 Extremely Unimportant Not Sure Extremely Important Important
10-13-2023 17:47:37 Extremely Unimportant Unimportant Important Extremely Unimportant
10-13-2023 17:47:38 Important Extremely Important Extremely Important Extremely Important
10-13-2023 17:47:39 Extremely Important Extremely Unimportant Extremely Important Extremely Important
10-13-2023 17:47:40 Extremely Unimportant Not Sure Extremely Unimportant Extremely Important
10-13-2023 17:47:41 Unimportant Extremely Unimportant Extremely Unimportant Extremely Important
10-13-2023 17:47:42 Not Sure Extremely Unimportant Important Extremely Important

This table contains example data. Expect many responses and questions in real life.

  • To get started with ChartExpo, install ChartExpo in Excel.
  • Now Click on My Apps from the INSERT menu.
insert chartexpo in excel
  • Choose ChartExpo from My Apps, then click Insert.
open chartexpo in excel
  • Once it loads, choose the “Likert Scale Chart” from the charts list.
search likert scale chart in excel
  • Click the “Create Chart From Selection” button after selecting the data from the sheet, as shown.
Create Chart From Selection ce435
  • When you click the “Create Chart From Selection” button, you have to map responses with numbers manually. The Likert scale has this arrangement:
    • Extremely Unimportant = 1
    • Unimportant = 2
    • Not Sure = 3
    • Important = 4
    • Extremely Important = 5
  • Once all is set, click the “Create Chart” button.
Map Likert Responses to Numbers ce435
  • ChartExpo will generate the visualization below for you.
Market Analysis Template Design
  • If you want to have the chart’s title, click Edit Chart, as shown in the above image.
  • Click the pencil icon next to the Chart Header to change the title.
  • It will open the properties dialog. Under the Text section, you can add a heading in Line 1 and enable Show.
  • Give the appropriate title of your chart and click the Apply button.
apply title on chart ce435
  • Let’s say you want to add text responses instead of numbers against every emoji.
  • Click the pencil icon next to the respective emoji. Expand the “Label” properties and write the required text. Then click the “Apply All” button.
  • Click the “Save Changes” button to persist the changes.
apply label on chart ce435
  • Your final chart will appear below.
Final Market Analysis Template

Insights

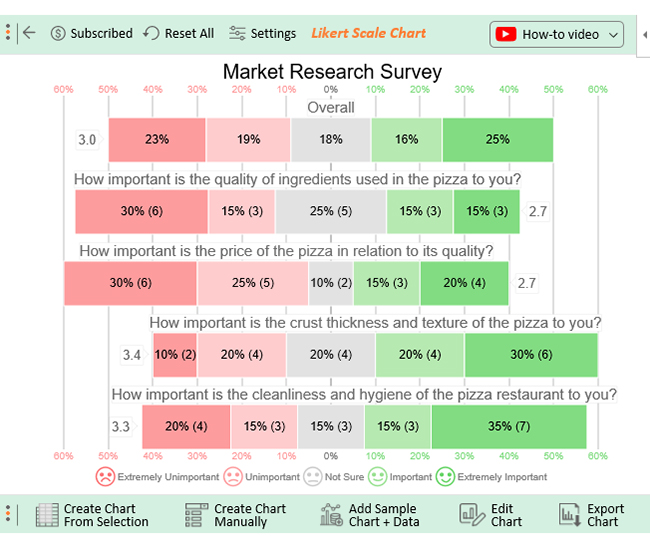
From the market analysis example above:

  • The quality of ingredients used in the pizza is important to 30% of respondents, while 45% consider it unimportant. 25% are uncertain about the importance of ingredient quality.
  • Regarding price to quality, 35% find it important, whereas 55% find it unimportant.
  • 50% emphasize the significance of crust thickness, while 30% consider it unimportant.
  • 50% find cleanliness at pizza restaurants important, while 35% consider it unimportant.
  • Overall, 41% of respondents deem the aforementioned factors important in their decision-making, whereas 42% find them unimportant.

How to Download and Use the Market Analysis Template for a Business Plan?

  1. Download a ready-made Market Analysis Template (Excel/Word).
  2. Customize with your business details.
  3. Fill in data on industry, customers, and competitors.
  4. Analyze trends, risks, and opportunities.
  5. Add to your business plan for clear insights.

Benefits of the Marketing Analysis Template

  • Saves Time and Effort

A marketing analysis template provides a pre-structured framework, so you don’t have to build reports from scratch. This speeds up the process of collecting and presenting data.

  • Ensures Comprehensive Coverage

The template makes sure you include all the critical elements of analysis, such as industry trends, customer demographics, and competitor insights, reducing the risk of overlooking important factors.

  • Improves Decision-Making

By presenting data in an organized format, the template for marketing analysis helps business leaders make smarter, evidence-based decisions about products, pricing, and market positioning.

  • Enhances Strategic Planning

It highlights opportunities, threats, and market gaps, supporting better strategies for growth and competitive advantage. Businesses can easily identify where to invest resources for maximum results.

  • Easy to Customize and Share

The marketing analysis template is flexible enough to adapt to different industries and business goals. You can personalize it for specific projects and share it with teams or stakeholders for alignment.

Market Analysis Templates – FAQs

What is a market analysis for beginners?

A market analysis is a process of studying your industry, customers, and competitors to understand how your business can succeed. For beginners, it involves looking at the size of the market, customer needs, current trends, and what other businesses are offering. This helps identify opportunities and reduce risks before making business decisions.

What is a good sample size for market analysis?

The right sample size depends on your target audience and research goals. For small businesses, surveying at least 100–200 respondents can give useful insights, while larger studies may need 500+ responses for more accuracy. The key is ensuring the sample is diverse enough to represent your target market.

What are the 5 steps of marketing analysis?

  1. Define objectives: Clearly outline the goals of your analysis.
  2. Gather data: Collect relevant market data.
  3. Analyze Data: Examine the data to identify insights and trends.
  4. Conclude: Formulate conclusions based on your analysis.
  5. Make recommendations: Offer actionable recommendations for business strategies.

Wrap Up

The market analysis template helps navigate the intricate data web and turn it into a strategy. It offers a structured approach, ensuring no stone is left unturned in pursuing market insights. This organization saves precious time and resources, streamlining the entire process.

With this template, decisions are not just guesswork; they are data-driven and grounded in reality. The comprehensive insights gleaned are the building blocks of informed decision-making.

Consistency is key in business, and the template ensures your approach remains uniform across various projects. The ability to compare data and track changes over time is a powerful advantage. Moreover, it helps your business stay adaptable and responsive to evolving market conditions.

From startups aiming to conquer their niche to corporations looking to expand, this template levels the playing field. It’s not just a tool; it’s a compass guiding businesses toward success in a competitive marketplace.

Do not hesitate.

Embrace the marketing analytics template with ChartExpo and turn data into your most potent strategic weapon.

How much did you enjoy this article?

PBIAd1
Start Free Trial!
129494

Related articles

next previous
Surveys12 min read

Candidate Experience Survey Template: Insights Made Easy

A candidate experience survey template collects hiring feedback. Click here to learn when to send it, what to ask, and how to analyze the results.

Surveys12 min read

Voice of Customer Examples for Business Insights

Discover real-world Voice of Customer examples that show how businesses collect feedback, improve experiences, and build stronger customer relationships.

Surveys14 min read

Google Forms Survey Template Exploration: Key Features

Google Forms survey templates make it easy to design surveys fast. Discover their benefits, examples, and how to personalize them for your needs.

Surveys12 min read

360 Degree Review Template with Charts and Visual Reports

A 360 Degree Review Template makes performance reviews easy by combining peer, manager, and team feedback into one comprehensive tool.

Surveys13 min read

How to Analyze Google Forms Responses in Excel?

Learn how Google Forms responses work, where to find them, and how to organize results in spreadsheets for easier analysis.

ChartExpo logo

Turn Data into Visual
Stories

CHARTEXPO

  • Home
  • Gallery
  • Videos
  • Services
  • Pricing
  • Contact us
  • FAQs
  • Privacy policy
  • Terms of Service
  • Sitemap

TOOLS

  • ChartExpo for Google Sheets
  • ChartExpo for Microsoft Excel
  • Power BI Custom Visuals by ChartExpo
  • Word Cloud

CATEGORIES

  • Bar Charts
  • Circle Graphs
  • Column Charts
  • Combo Charts
  • Comparison Charts
  • Line Graphs
  • PPC Charts
  • Sentiment Analysis Charts
  • Survey Charts

TOP CHARTS

  • Sankey Diagram
  • Likert Scale Chart
  • Comparison Bar Chart
  • Pareto Chart
  • Funnel Chart
  • Gauge Chart
  • Radar Chart
  • Radial Bar Chart
  • Sunburst Chart
  • see more
  • Scatter Plot Chart
  • CSAT Survey Bar Chart
  • CSAT Survey Chart
  • Dot Plot Chart
  • Double Bar Graph
  • Matrix Chart
  • Multi Axis Line Chart
  • Overlapping Bar Chart
  • Control Chart
  • Slope Chart
  • Clustered Bar Chart
  • Clustered Column Chart
  • Box and Whisker Plot
  • Tornado Chart
  • Waterfall Chart
  • Word Cloud
  • see less

RESOURCES

  • Blog
  • Resources
  • YouTube
SIGN UP FOR UPDATES

We wouldn't dream of spamming you or selling your info.

© 2025 ChartExpo, all rights reserved.