• Home
  • Tools dropdown img
    • Spreadsheet Charts

      • ChartExpo for Google Sheets
      • ChartExpo for Microsoft Excel
    • Power BI Charts

      • Power BI Custom Visuals by ChartExpo
    • Word Cloud

  • Charts dropdown img
    • Chart Category

      • Bar Charts
      • Circle Graphs
      • Column Charts
      • Combo Charts
      • Comparison Charts
      • Line Graphs
      • PPC Charts
      • Sentiment Analysis Charts
      • Survey Charts
    • Chart Type

      • Box and Whisker Plot
      • Clustered Bar Chart
      • Clustered Column Chart
      • Comparison Bar Chart
      • Control Chart
      • CSAT Survey Bar Chart
      • CSAT Survey Chart
      • Dot Plot Chart
      • Double Bar Graph
      • Funnel Chart
      • Gauge Chart
      • Likert Scale Chart
      • Matrix Chart
      • Multi Axis Line Chart
      • Overlapping Bar Chart
      • Pareto Chart
      • Radar Chart
      • Radial Bar Chart
      • Sankey Diagram
      • Scatter Plot Chart
      • Slope Chart
      • Sunburst Chart
      • Tornado Chart
      • Waterfall Chart
      • Word Cloud
    • Google Sheets
      Microsoft Excel
  • Services
  • Pricing
  • Contact us
  • Blog
  • Support dropdown img
      • Gallery
      • Videos
      • Contact us
      • FAQs
      • Resources
    • Please feel free to contact us

      atsupport@chartexpo.com

Categories
All Data Visualizations Data Analytics Surveys
Add-ons/
  • Google Sheets
  • Microsoft Excel
  • Power BI
All Data Visualizations Data Analytics Surveys
Add-ons
  • Google Sheets
  • Microsoft Excel
  • Power BI

We use cookies

This website uses cookies to provide better user experience and user's session management.
By continuing visiting this website you consent the use of these cookies.

Ok

ChartExpo Survey


Home > Blog > Surveys

How to Analyze Matrix Survey Questions in Excel?

Asking the right survey questions is crucial to gathering relevant data. One type of question that has become increasingly popular is the matrix survey question.

Matrix Survey Questions

Yes, you heard that right.

Matrix survey questions allow you to ask a series of related questions in a condensed format. This makes it easier for your respondents to answer questions.

However, crafting effective matrix survey questions is easier said than done.

This is because it requires careful planning and consideration of your research objectives and target audience. Without proper attention to detail, your survey may not provide actionable insights.

Table of Content:

  1. What are Matrix Survey Questions?
  2. Why are Matrix Survey Questions useful?
  3. When to Use Matrix Questions in Surveys?
  4. Types of Matrix Questions
  5.  Matrix Survey Questions Example
  6. How to create a Perfect Matrix Question Survey?
  7. How to Visualize Matrix Survey Questions?
  8. Advantages and Disadvantages of Matrix Questions
  9. Advantages of Matrix Questions
  10. Disadvantages of Matrix Questions
  11. Mistakes to Avoid When Using Matrix Questions
  12. Best Practices for Writing Good Matrix Survey Questions
  13. Wrap Up

What are Matrix Survey Questions?

Definition: Matrix surveys are a type of survey you can use to gather information during a survey.

They consist of a table or grid format with rows representing the topics or attributes and columns representing responses.

Matrix survey questions are useful for gathering data on multiple related themes in a condensed format. They allow your respondents to answer a series of questions about a particular subject matter quickly and efficiently.

In other words, your respondents don’t have to answer each question individually. This can save a lot of time.

Use matrix survey questions in market research, customer satisfaction surveys, and employee feedback surveys. Besides, use the survey to gather data on various topics, including product features, customer service quality, etc.

One of the main benefits of using matrix survey questions is that they allow for easy analysis. Organizing responses into a table format makes it easy for you to see patterns and trends in the survey data.

This can help you identify areas for improvement and data-driven decision-making.

Why are Matrix Survey Questions useful?

Matrix survey questions are important because they provide a way to ask multiple questions in a condensed format. This makes it easier for respondents to answer questions.

Visualizing these questions and responses can help you identify patterns and make informed decisions.

When to Use Matrix Questions in Surveys?

Matrix questions are recommended for gathering data on multiple aspects of a particular topic. Use them to ask several questions in a scaled format about a similar idea.

A matrix question format allows you to condense multiple questions into one table. This makes it easier for respondents to answer survey questions faster and conveniently.

There are several ways to use matrix questions in your research.

Check them out.

You can use matrix questions as a short survey by asking multiple questions in a single matrix format. Alternatively, use a matrix question as a single-question type within a larger questionnaire.

This will help you to gather data on a specific subtopic within a broader survey.

One of the primary benefits of using matrix questions is the closed-ended, predefined answers. This format is recommended for gathering data on customer satisfaction and experience.

For example, you can use a matrix question to probe respondents about their satisfaction with your product or service.

Another benefit of using matrix questions is their ability to combine many rating-scale questions into a single, digestible format.

Types of Matrix Questions

Likert Scale Matrix

  • Description: Respondents rate multiple statements on the same scale (e.g., Strongly Agree to Strongly Disagree).
  • Use Case: Measuring attitudes, opinions, or agreement levels on various aspects.

Satisfaction Matrix

  • Description: Evaluate satisfaction levels across different services or products using a consistent scale.
  • Use Case: Assessing customer satisfaction with multiple aspects of a service or product.

Importance-Performance Matrix

  • Description: Rates the importance of various factors and their performance on the same scale.
  • Use Case: Identifying which factors are most crucial and how well they are being addressed.

Frequency Matrix

  • Description: Measures how often different activities or behaviors occur.
  • Use Case: Understanding the frequency of actions or events over a specified period.

Agreement-Disagreement Matrix

  • Description: Rates the extent to which respondents agree or disagree with multiple statements.
  • Use Case: Gauging opinions or sentiments about various statements or issues.

 Matrix Survey Questions Example

Check out an example of Matrix Survey questions below.

Let’s dive in.

Matrix Questions Example

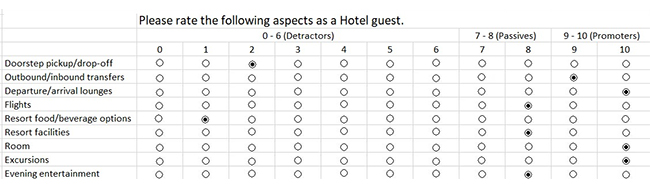
This matrix questionnaire example uses a scale ranging from 0 to 10. 0 to 6 are considered “Detractors”. Conversely, 7 to 8 are “Passives”, and 9 to 10 are “Promoters”.

Respondents with a score of 0 to 6 are classified as Detractors unsatisfied with the product or service and may even spread negative feedback.

Passives have a score of 7 or 8 somewhat satisfied with the product or service but not likely to recommend it to others.

Lastly, those with 9 or 10 scores are Promoters highly satisfied customers likely to recommend the product or service to others. This classification system can help you identify areas for improvement.

How to create a Perfect Matrix Question Survey?

  1. Define Objectives: Identify what you want to measure and ensure the matrix aligns with these goals.
  2. Design Questions: Group related questions with a consistent, simple scale and avoid using jargon.
  3. Keep Matrix Compact: Ensure the matrix is concise to prevent overwhelming respondents and utilize distinct headings to enhance clarity and organization.
  4. Provide Instructions: Include brief, straightforward instructions on how to answer the matrix.
  5. Test and Refine: Pilot-test the survey to ensure clarity and adjust based on feedback.

How to Visualize Matrix Survey Questions?

Excel is a great tool for displaying survey data in an organized table format.

However, it may not always be the best option for visualizing matrix survey questions and responses. This is because it lacks survey-based charts and graphs.

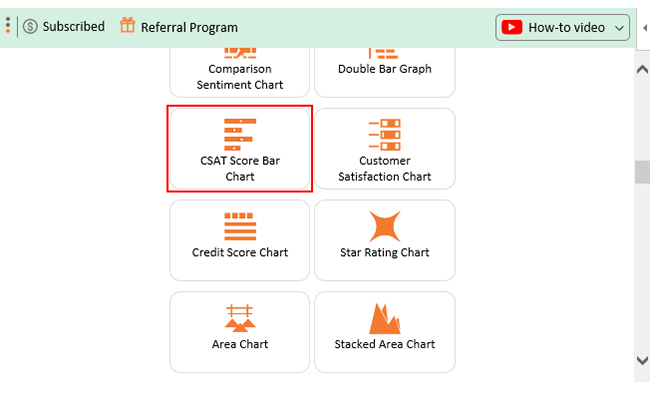
To address this issue, use a third-party add-in called ChartExpo to display insights into your matrix survey questions.

With ChartExpo, you can quickly and easily create visually appealing charts that provide meaningful and actionable insights. This add-in provides the best charts for survey analysis.

The best Excel add-in can help you find insight into hidden patterns and trends in your survey data.

ChartExpo offers a free trial, giving you access to various charts and sample data to test out. Once you’re satisfied with the results, upgrade to the paid version”” $10 monthly after a 7-day free trial.

How to Install ChartExpo in Excel?

  1. Open your Excel application.
  2. Open the worksheet and click the “Insert” menu.
  3. You’ll see “My Apps”.
  4. In the office Add-ins window, click “Store” and search for ChartExpo on my Apps Store.
  5. Click the “Add” button to install ChartExpo in your Excel.

ChartExpo charts are available both in Google Sheets and Microsoft Excel. Please use the following CTA’s to install the tool of your choice and create interactive visualizations in a few clicks in your favorite tool.

Example

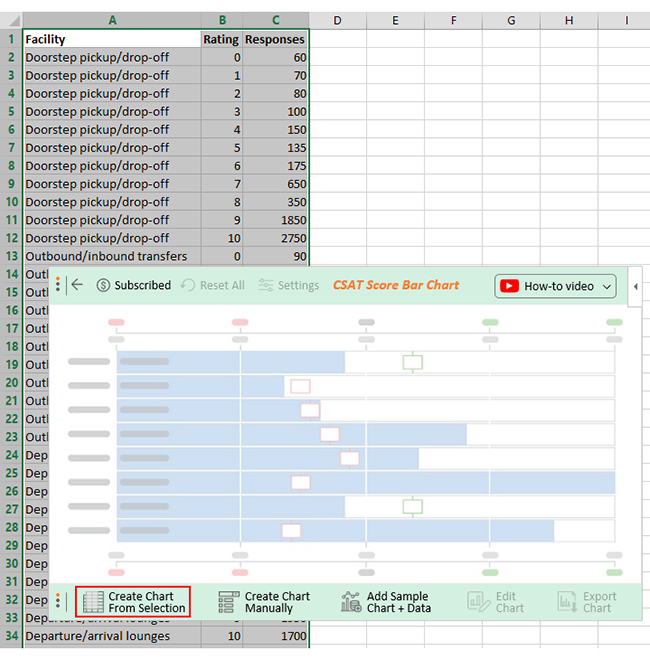
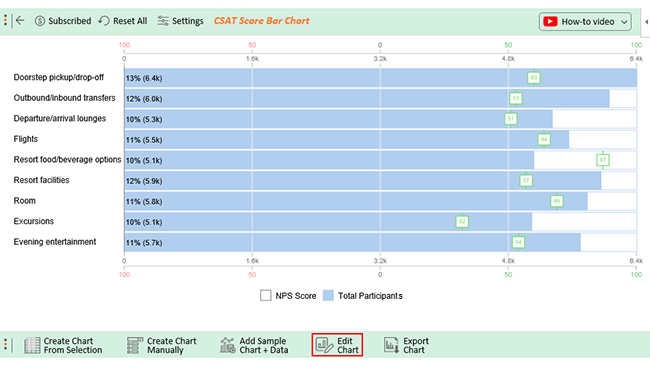
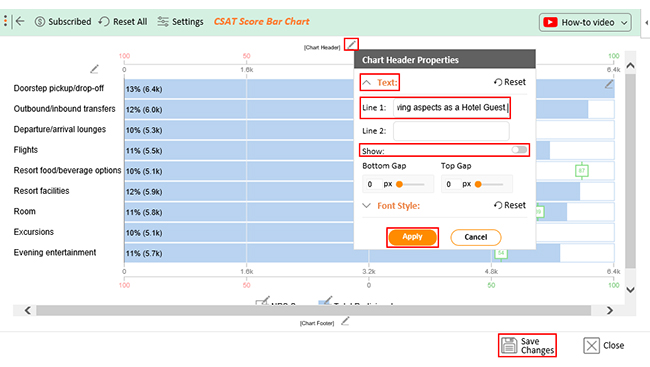
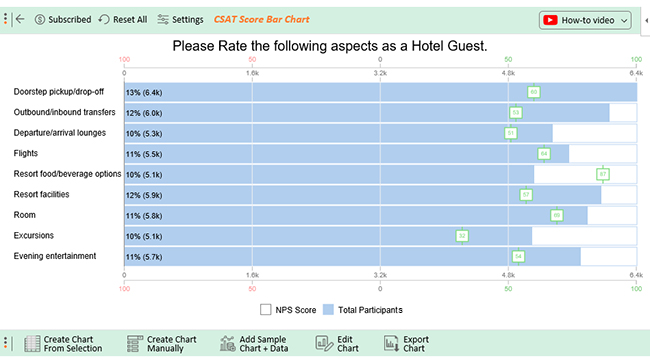
This section will use the ChartExpo add-in to visualize the survey data below.

Facility Rating Responses
Doorstep pickup/drop-off 0 60
Doorstep pickup/drop-off 1 70
Doorstep pickup/drop-off 2 80
Doorstep pickup/drop-off 3 100
Doorstep pickup/drop-off 4 150
Doorstep pickup/drop-off 5 135
Doorstep pickup/drop-off 6 175
Doorstep pickup/drop-off 7 650
Doorstep pickup/drop-off 8 350
Doorstep pickup/drop-off 9 1850
Doorstep pickup/drop-off 10 2750
Outbound/inbound transfers 0 90
Outbound/inbound transfers 1 80
Outbound/inbound transfers 2 100
Outbound/inbound transfers 3 120
Outbound/inbound transfers 4 150
Outbound/inbound transfers 5 145
Outbound/inbound transfers 6 200
Outbound/inbound transfers 7 650
Outbound/inbound transfers 8 350
Outbound/inbound transfers 9 1650
Outbound/inbound transfers 10 2500
Departure/arrival lounges 0 100
Departure/arrival lounges 1 110
Departure/arrival lounges 2 130
Departure/arrival lounges 3 150
Departure/arrival lounges 4 125
Departure/arrival lounges 5 260
Departure/arrival lounges 6 100
Departure/arrival lounges 7 450
Departure/arrival lounges 8 250
Departure/arrival lounges 9 1950
Departure/arrival lounges 10 1700
Flights 0 90
Flights 1 80
Flights 2 60
Flights 3 50
Flights 4 120
Flights 5 100
Flights 6 130
Flights 7 450
Flights 8 350
Flights 9 1850
Flights 10 2250
Resort food/beverage options 0 10
Resort food/beverage options 1 30
Resort food/beverage options 2 20
Resort food/beverage options 3 40
Resort food/beverage options 4 30
Resort food/beverage options 5 20
Resort food/beverage options 6 40
Resort food/beverage options 7 150
Resort food/beverage options 8 100
Resort food/beverage options 9 2400
Resort food/beverage options 10 2250
Resort facilities 0 60
Resort facilities 1 70
Resort facilities 2 80
Resort facilities 3 100
Resort facilities 4 120
Resort facilities 5 150
Resort facilities 6 200
Resort facilities 7 650
Resort facilities 8 350
Resort facilities 9 1650
Resort facilities 10 2500
Room 0 50
Room 1 50
Room 2 30
Room 3 90
Room 4 30
Room 5 20
Room 6 40
Room 7 700
Room 8 500
Room 9 2400
Room 10 1850
Excursions 0 100
Excursions 1 110
Excursions 2 130
Excursions 3 150
Excursions 4 325
Excursions 5 200
Excursions 6 100
Excursions 7 650
Excursions 8 550
Excursions 9 1350
Excursions 10 1400
Evening entertainment 0 60
Evening entertainment 1 70
Evening entertainment 2 80
Evening entertainment 3 100
Evening entertainment 4 150
Evening entertainment 5 135
Evening entertainment 6 175
Evening entertainment 7 650
Evening entertainment 8 350
Evening entertainment 9 1650
Evening entertainment 10 2250
  • To get started with ChartExpo, install ChartExpo in Excel.
  • Now Click on My Apps from the INSERT menu.
insert chartexpo in excel
  • Choose ChartExpo from My Apps, then click Insert.
open chartexpo in excel
  • Once ChartExpo is loaded. Click on “CSAT Score Bar Chart” from the list of charts.
search csat score bar chart in excel
  • Click the “Create Chart From Selection” button after selecting the data from the sheet, as shown.
create csat score bar chart in excel
  • The CSAT Score Bar Chart will look like as below.
edit csat score bar chart in excel
  • If you want to have the title of the chart, click on Edit Chart, as shown in the above image.
  • To change the title of the chart, click on the pencil icon that is available very next to Chart Header.
  • It will open the properties dialog. Under the Text section, you can add a heading in Line 1 enable the Show Give the appropriate title of your chart, and click on the Apply button.
  • To save the changes made to the chart, click the “Save Changes” button.
save csat score bar chart in excel
  • The final chart will look as below.
final csat score bar chart in excel

Insights

  • The NPS score of 87 for the food and beverage options at the resort is quite impressive. This indicates the guests are highly satisfied with these offerings.
  • However, the NPS score of 32 for the excursions is concerning. It suggests that guests are not satisfied with this aspect of the business.
  • This is a clear signal that immediate action is needed to improve the Excursion services.

Advantages and Disadvantages of Matrix Questions

Advantages of Matrix Questions

  1. Efficient Data Collection: Matrix questions allow multiple items to be rated or evaluated in a single, compact format, saving space and time for both respondents and researchers.
  2. Consistency: The standardized format ensures that respondents answer questions using the same scale, promoting consistency in responses.
  3. Easy to Compare: Having multiple related questions in one matrix makes it easier to compare responses across different items, facilitating analysis and pattern recognition.
  4. Improved Response Rate: The organized layout can make the survey appear shorter and less intimidating, potentially leading to higher response rates.
  5. Simplifies Complex Surveys: Matrix questions can simplify the presentation of complex surveys, making it easier for respondents to understand and complete them.

Disadvantages of Matrix Questions

  1. Respondent Fatigue: If the matrix has too many items, respondents may experience fatigue or boredom, leading to lower-quality responses or abandonment of the survey.
  2. Potential for Misinterpretation: Respondents might misinterpret the scale or items if they are not clearly defined, leading to inaccurate or inconsistent responses.
  3. Risk of Straight-Lining: Some respondents may provide the same answer for all items in the matrix (straight-lining) without carefully considering each one, reducing data quality.
  4. Complexity in Design: Creating effective matrix questions requires careful design to ensure clarity and avoid confusion, which can be more complex than other question types.
  5. Limited Detail: Matrix questions often use closed-ended response options, which may limit the depth of information gathered compared to open-ended questions.

Mistakes to Avoid When Using Matrix Questions

Overloading the Matrix

  • Mistake: Including too many items or scales in a single matrix.
  • Avoidance: Limit the number of items to keep the survey manageable and prevent respondent fatigue.

Using Ambiguous Language

  • Mistake: Vague or unclear question wording.
  • Avoidance: Use precise and straightforward language to ensure respondents understand each item clearly.

Neglecting Scale Consistency

  • Mistake: Mixing different scales or response options.
  • Avoidance: Maintain a consistent scale throughout the matrix to avoid confusion and ensure reliable data.

Ignoring Data Quality Issues

  • Mistake: Overlooking potential for straight-lining or biased responses.
  • Avoidance: Monitor for response patterns that indicate careless answering, and design the matrix to minimize bias.

Best Practices for Writing Good Matrix Survey Questions

  • Keep it simple

Avoid complex sentence structures. Use simple and easy words for respondents to understand.

  • Be clear and concise

Ensure your matrix survey questions are clear and easy to understand. Avoid vague wording.

  • Group related items

Segment-related items together to make your matrix survey questions more organized.

  • Use consistent formatting

Use standardized formats, such as font size and spacing throughout the matrix question.

FAQs

What is a Matrix Table in a Survey?

A matrix table in a survey is a type of question format where respondents rate multiple items using the same scale, typically presented in a grid layout. This format helps to efficiently collect responses to related questions.

Why use matrix surveys?

Matrix surveys are used to efficiently collect responses on multiple related items with the same scale, saving space and making it easier for respondents to provide feedback on similar questions.

Wrap Up

In conclusion, matrix survey questions are a powerful tool for gathering detailed feedback from your customers.

By using these questions, you can gain valuable insights into how your customers feel about your product or service.

The benefits of using matrix survey questions are many.

These questions allow you to gather more nuanced data than traditional survey questions. You can easily identify areas where your customers are particularly satisfied or dissatisfied.

To get the most out of your matrix survey questions, follow best practices, such as using clear and concise language, avoiding biased wording, etc.

With these guidelines in mind, ensure your survey is effective and provides actionable insights.

Incorporating matrix survey questions into your feedback strategy can help you better understand your market.

With ChartExpo, analyzing matrix survey questions for actionable insights has never been easier.

The Excel add-in can help you to create beautiful and informative survey charts and graphs easy to interpret.

Why wait?

Try ChartExpo today to extract powerful and actionable insights into your matrix survey questions.

Net Promoter, NPS, NPS Prism and many other terms related to NPS are registered trademarks of Bain & Company Inc., Satmetrix Systems Inc., and Fred Reichheld.

How much did you enjoy this article?

PBIAd1
Start Free Trial!
125885

Related articles

next previous
Surveys7 min read

Workplace Culture Surveys: Visual Perception, Not Guesswork

This guide dives deep into what the workplace culture survey is. You'll also discover what an employee culture survey is, and top 10 culture survey questions.

Surveys11 min read

How to Interpret 4-Point Likert Scale Results?

Click to learn How to Create, Gather and Analyze Data Using the 4-Point Likert Scale? A complete guide with definition, examples, uses, and applications.

Surveys7 min read

Benchmark for Surveying: Visual Insights

This guide dives deep into benchmarks for surveying. It shows you what it is, and the types of benchmarks in the survey. You'll also discover how to analyze it.

Surveys13 min read

5 Point Likert Scale Analysis, Interpretation & Examples

Dive deep into the realm of 5-point Likert Scale Analysis and Interpretation to unravel the sentiments behind your responses. Gain actionable insights today.

Surveys11 min read

3-Point Likert Scale: Range Interpretation & Analysis

Learn the basics of the 3-point Likert scale, including examples, benefits, and when it's best applied in research and feedback forms.

ChartExpo logo

Turn Data into Visual
Stories

CHARTEXPO

  • Home
  • Gallery
  • Videos
  • Services
  • Pricing
  • Contact us
  • FAQs
  • Privacy policy
  • Terms of Service
  • Sitemap

TOOLS

  • ChartExpo for Google Sheets
  • ChartExpo for Microsoft Excel
  • Power BI Custom Visuals by ChartExpo
  • Word Cloud

CATEGORIES

  • Bar Charts
  • Circle Graphs
  • Column Charts
  • Combo Charts
  • Comparison Charts
  • Line Graphs
  • PPC Charts
  • Sentiment Analysis Charts
  • Survey Charts

TOP CHARTS

  • Sankey Diagram
  • Likert Scale Chart
  • Comparison Bar Chart
  • Pareto Chart
  • Funnel Chart
  • Gauge Chart
  • Radar Chart
  • Radial Bar Chart
  • Sunburst Chart
  • see more
  • Scatter Plot Chart
  • CSAT Survey Bar Chart
  • CSAT Survey Chart
  • Dot Plot Chart
  • Double Bar Graph
  • Matrix Chart
  • Multi Axis Line Chart
  • Overlapping Bar Chart
  • Control Chart
  • Slope Chart
  • Clustered Bar Chart
  • Clustered Column Chart
  • Box and Whisker Plot
  • Tornado Chart
  • Waterfall Chart
  • Word Cloud
  • see less

RESOURCES

  • Blog
  • Resources
  • YouTube
SIGN UP FOR UPDATES

We wouldn't dream of spamming you or selling your info.

© 2025 ChartExpo, all rights reserved.