• Home
  • Tools dropdown img
    • Spreadsheet Charts

      • ChartExpo for Google Sheets
      • ChartExpo for Microsoft Excel
    • Power BI Charts

      • Power BI Custom Visuals by ChartExpo
    • Word Cloud

  • Charts dropdown img
    • Chart Category

      • Bar Charts
      • Circle Graphs
      • Column Charts
      • Combo Charts
      • Comparison Charts
      • Line Graphs
      • PPC Charts
      • Sentiment Analysis Charts
      • Survey Charts
    • Chart Type

      • Box and Whisker Plot
      • Clustered Bar Chart
      • Clustered Column Chart
      • Comparison Bar Chart
      • Control Chart
      • CSAT Survey Bar Chart
      • CSAT Survey Chart
      • Dot Plot Chart
      • Double Bar Graph
      • Funnel Chart
      • Gauge Chart
      • Likert Scale Chart
      • Matrix Chart
      • Multi Axis Line Chart
      • Overlapping Bar Chart
      • Pareto Chart
      • Radar Chart
      • Radial Bar Chart
      • Sankey Diagram
      • Scatter Plot Chart
      • Slope Chart
      • Sunburst Chart
      • Tornado Chart
      • Waterfall Chart
      • Word Cloud
    • Google Sheets
      Microsoft Excel
  • Services
  • Pricing
  • Contact us
  • Blog
  • Support dropdown img
      • Gallery
      • Videos
      • Contact us
      • FAQs
      • Resources
    • Please feel free to contact us

      atsupport@chartexpo.com

Categories
All Data Visualizations Data Analytics Surveys
Add-ons/
  • Google Sheets
  • Microsoft Excel
  • Power BI
All Data Visualizations Data Analytics Surveys
Add-ons
  • Google Sheets
  • Microsoft Excel
  • Power BI

We use cookies

This website uses cookies to provide better user experience and user's session management.
By continuing visiting this website you consent the use of these cookies.

Ok

ChartExpo Survey


Home > Blog > Microsoft Excel

360 Feedback Examples: A Comprehensive Guide

360 Feedback Examples offer a comprehensive approach to evaluating an individual’s performance from multiple perspectives within an organization.

360 Feedback Examples

360 feedback is a process in which employees receive feedback from their manager, peers, and direct reports. The feedback is usually anonymous, encouraging honest and constructive criticism.

What kind of feedback can you expect to receive?

Your colleagues may praise your exceptional communication skills or ability to stay organized under pressure. Or perhaps suggest that you cut back on the puns during team meetings.

Either way, the feedback you receive will help you identify improvement areas and enhance your overall performance.

To help you better understand how 360 feedback works in practice, we’ve gathered some examples to inspire you.

So buckle up, as we explore the diverse landscape of 360 Feedback Examples that showcase the transformative power of constructive input from all angles.

Table of Content:

  1. What is 360 Feedback?
  2. Why is 360 Feedback Important?
  3. Common 360 Feedback Examples
  4. Create a 360-degree Feedback Survey
  5. How to Examning 360 Feedback Survey?
  6. Wrap Up

What is 360 Feedback?

Definition: 360 feedback is like a performance mirror, reflecting feedback from all directions. It’s a dynamic evaluation process where you receive input from your supervisors, peers, and subordinates. This holistic view offers a 360-degree perspective on strengths, weaknesses, and growth opportunities.

Examining real-life 360 Feedback Examples further illuminates the transformative nature of this feedback approach, providing concrete instances of how individuals have utilized comprehensive input to enhance their performance and contribute positively to their professional environments.

Why is 360 Feedback Important?

Life isn’t a one-man show, and neither is your career. Let’s dive into reasons why using 360 feedback is essential.

  • Comprehensive assessment: Imagine judging a talent show with just one judge. Boring, right? 360 feedback spices things up by bringing in the whole panel of peers, subordinates, supervisors, and yourself. It’s like getting reviews from the entire theater, not just the front row. To make the most of this feedback, using skills matrix templates can help visualize and analyze the strengths and weaknesses identified by different reviewers, ensuring a comprehensive assessment of performance.
  • Self-awareness: Ever wondered how you come across to others? 360 feedback is your backstage pass to self-discovery. You gain insights into your strengths and areas for improvement from multiple perspectives. Thus, you can understand how your actions and behaviors impact others.
  • Development and growth:360 feedback is a catalyst for personal and professional development. It pinpoints where you can fine-tune your skills and unleash your potential. You can think of it as a roadmap to becoming the best version of yourself.
  • Team and organizational improvement: Teams that groove together improve together. 360 feedback doesn’t just elevate individuals; it jazzes up the whole team dynamic. When everyone knows their strengths and areas to work on, teamwork reaches a symphonic level.
  • Leadership development: Leaders, listen up! 360 feedback is your superhero cape. It shows you how your leadership style impacts the troops. Thus, you can fine-tune your leadership skills and become the director everyone wants to follow.

Common 360 Feedback Examples

Here are some 360 feedback examples with common questions for various competency areas:

Communication Skills:

  1. Does the individual effectively communicate their ideas and thoughts?
  2. Are they able to actively listen and understand others?
  3. Do they provide clear and concise instructions?
  4. How well do they handle conflicts and difficult conversations?

Leadership and Management:

  1. Does the individual inspire and motivate their team members?
  2. How well do they delegate tasks and responsibilities?
  3. Can they provide constructive feedback and guidance?
  4. Do they encourage growth and development within their team?

Teamwork and Collaboration:

  1. How well does the individual work with others?
  2. Are they cooperative and supportive of their teammates?
  3. Do they actively contribute to team goals and objectives?
  4. Can they effectively resolve conflicts within the team?

Problem-Solving and Decision-Making:

  1. Does the individual demonstrate strong problem-solving skills?
  2. How well do they analyze situations and make informed decisions?
  3. Are they open to new ideas and alternative solutions?
  4. Do they involve others in the decision-making process?

Adaptability and Change Management:

  1. How well does the individual handle and adapt to change?
  2. Are they flexible in their approach to new situations?
  3. Do they proactively seek opportunities for improvement?
  4. Can they effectively lead others through periods of change?

How to Create a 360-Degree Feedback Survey?

Let’s say you want to conduct a 360 survey with the following statements.

  • The individual effectively communicates with colleagues and team members.
  • The individual demonstrates strong leadership skills.
  • The individual consistently collaborates and works effectively with others.

Below are the responses associated with each statement:

  1. Strongly Disagree
  2. Disagree
  3. Neutral
  4. Agree
  5. Strongly Agree

Why use Google Forms?

  1. Accessibility: Google Forms is a web-based tool accessible from anywhere with an internet connection. Participants can respond at their convenience, whether in the office, at home, or on the go.
  2. Collaboration: Google Forms allows multiple people to collaborate on the survey creation process. You can invite colleagues to help design the survey, review questions, and make improvements collaboratively.
  3. Integration: Google Forms seamlessly integrates with other Google Workspace apps, making data analysis and reporting more efficient.
  4. Data security: Google Forms offers robust security measures to protect sensitive data. You can restrict responses to authorized individuals, ensuring confidentiality.
  5. Cost-effective: Google Forms is free to use – a cost-effective solution compared to purchasing specialized survey software.

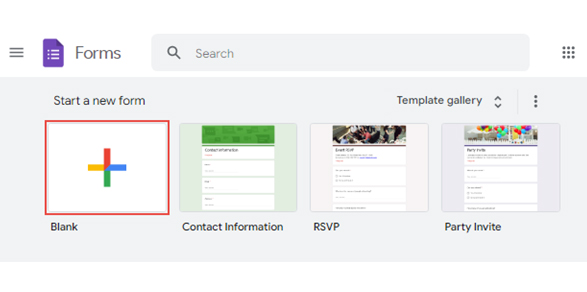
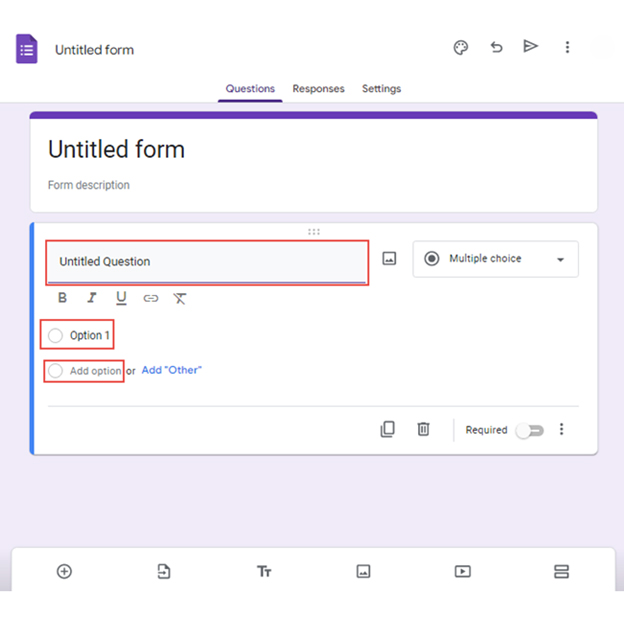
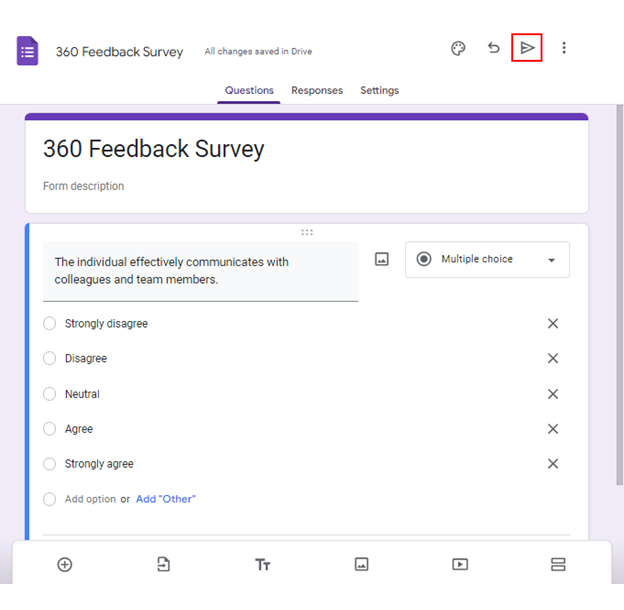
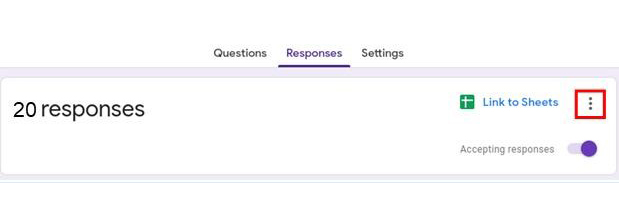
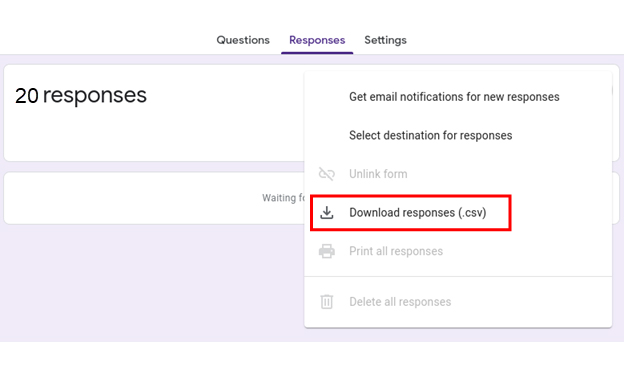
Follow the steps below to create your 360-degree feedback survey using Google Forms.

  • Open Google Forms and sign in with your Google account.
  • Click the “Blank” button to create a new form.
Google Form Survey Template ce471 1
  • Give your form a title and description that reflects your brand or purpose.
  • Choose the type of question you want to use, such as multiple-choice, checkbox, or short answer.
  • Type your question in the “Untitled Question” section for multiple-choice questions. Then write “Option 1” and choose “Add option” for more options.
Google Form Survey Template ce471 2
  • You can customize the look and feel of your survey to match your brand or theme.
  • Preview the form before sharing it with your target audience.
  • Click the share button to distribute it to your target audience.
Google Form Survey Template ce471 3
  • Once you collect enough responses, click the “Link to Sheets” button.
Google Form Survey Template ce471 4
  • Download the responses as a .csv file from the drop-down menu.
Google Form Survey Template ce471 5

How to Examine 360 Feedback Survey?

Data analysis without visualization is like a movie without special effects functional but lacking that ‘wow’ factor. Excel tends to stumble when it comes to creating jaw-dropping data visualizations.

This is where ChartExpo, your data superhero, comes to rescue your 360 feedback survey analysis.

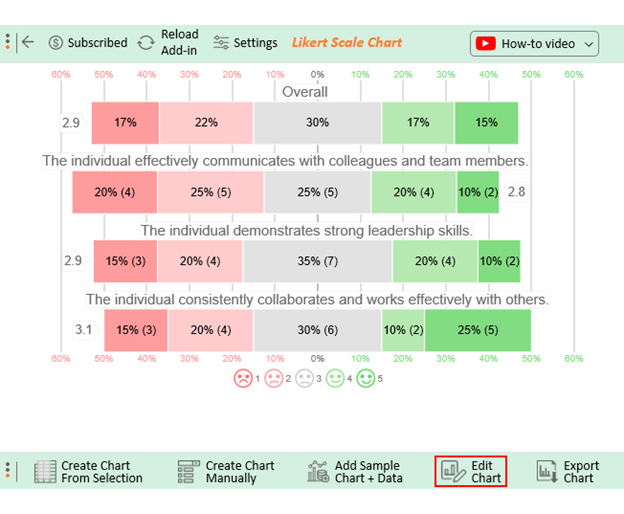
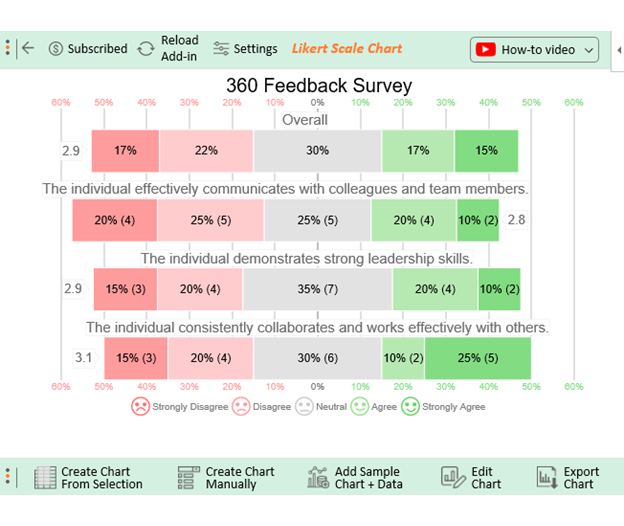
ChartExpo turns mundane Excel data into captivating visuals, offering self-service analytics that let audiences say, ‘Now that’s what I call insight!’ Strap in; it’s time to transform your data game with this robust 360 evaluation tool.

Benefits of Using ChartExpo

  • ChartExpo boasts an expansive collection of visualizations. You can handpick the perfect one for your data, making data analysis a cakewalk.
  • ChartExpo flaunts an interface so intuitive even a technophobe can whip up eye-catching visuals without breaking a sweat. You don’t need coding superpowers.
  • Want to give your charts a personal touch? ChartExpo’s customization features let you add personality to your visuals. You can dress them in your favorite colors, fonts, and styles.
  • When it comes to bang for your buck, ChartExpo is your frugal friend. It has a generous 7-day free trial and a wallet-friendly $10 monthly plan. It’s like getting a data visualization extravaganza on a budget.

How to Install ChartExpo in Excel?

  1. Open your Excel application.
  2. Open the worksheet and click the “Insert” menu.
  3. You’ll see the “My Apps” option.
  4. In the office Add-ins window, click “Store” and search for ChartExpo on my Apps Store.
  5. Click the “Add” button to install ChartExpo in your Excel.

ChartExpo charts are available both in Google Sheets and Microsoft Excel. Please use the following CTA’s to install the tool of your choice and create beautiful visualizations in a few clicks in your favorite tool.

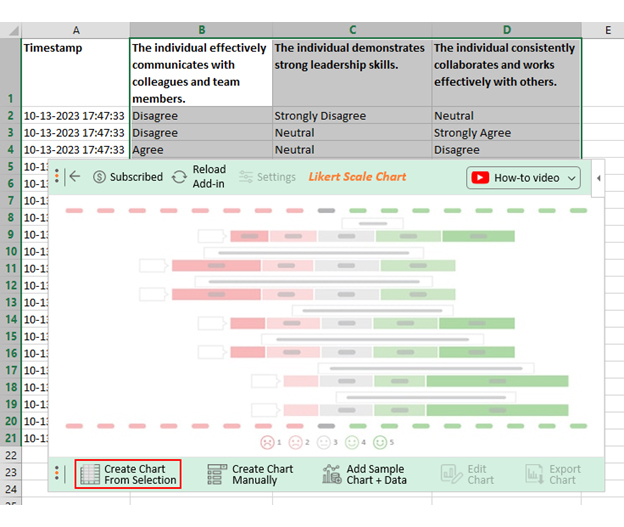
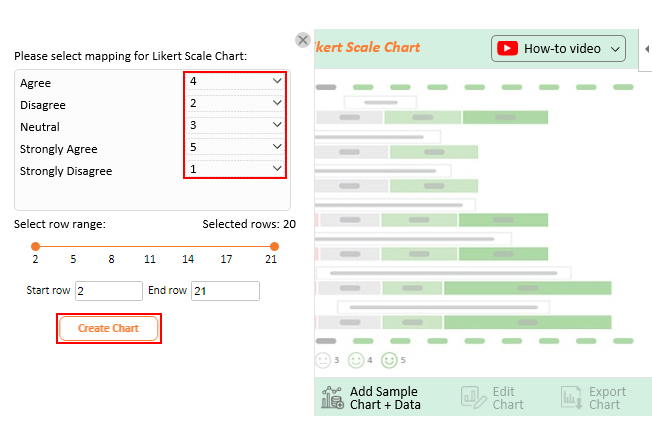
Let’s say your survey yields the data table below.

Timestamp The individual effectively communicates with colleagues and team

members.

The individual demonstrates strong leadership skills. The individual consistently collaborates and works effectively with others.
10-13-2023 17:47:33 Disagree Strongly Disagree Neutral
10-13-2023 17:47:33 Disagree Neutral Strongly Agree
10-13-2023 17:47:33 Agree Neutral Disagree
10-13-2023 17:47:33 Strongly Agree Neutral Disagree
10-13-2023 17:47:33 Disagree Agree Neutral
10-13-2023 17:47:33 Strongly Disagree Disagree Strongly Agree
10-13-2023 17:47:33 Agree Disagree Strongly Agree
10-13-2023 17:47:33 Neutral Neutral Neutral
10-13-2023 17:47:33 Strongly Agree Neutral Strongly Agree
10-13-2023 17:47:33 Neutral Strongly Agree Disagree
10-13-2023 17:47:33 Strongly Disagree Disagree Disagree
10-13-2023 17:47:34 Neutral Agree Strongly Agree
10-13-2023 17:47:35 Disagree Neutral Strongly Disagree
10-13-2023 17:47:36 Strongly Disagree Strongly Disagree Strongly Disagree
10-13-2023 17:47:37 Disagree Strongly Agree Neutral
10-13-2023 17:47:38 Neutral Agree Neutral
10-13-2023 17:47:39 Agree Strongly Disagree Strongly Disagree
10-13-2023 17:47:40 Neutral Agree Agree
10-13-2023 17:47:41 Strongly Disagree Neutral Neutral
10-13-2023 17:47:42 Agree Disagree Agree

This table contains example data. Expect many responses and questions in real life.

  • To get started with ChartExpo, install ChartExpo in Excel.
  • Now Click on My Apps from the INSERT menu.
insert chartexpo in excel
  • Choose ChartExpo from My Apps, then click Insert.
open chartexpo in excel
  • Once it loads, choose the “Likert Scale Chart” from the charts list.
search likert scale chart in excel
  • Click the “Create Chart From Selection” button after selecting the data from the sheet, as shown.
Create Chart From Selection ce471
  • When you click the “Create Chart From Selection” button, you have to map responses with numbers manually. The Likert scale has this arrangement:
    • Strongly Disagree=1
    • Disagree=2
    • Neither agree nor disagree=3
    • Agree=4
    • Strongly Agree=5
  • Once all is set, click the “Create Chart” button.
Map Likert Scale Chart ce471
  • ChartExpo will generate the visualization below for you.
360 Feedback Examples Design Template
  • If you want to have the chart’s title, click Edit Chart, as shown in the above image.
  • Click the pencil icon next to the Chart Header to change the title.
  • It will open the properties dialog. Under the Text section, you can add a heading in Line 1 and enable Show.
  • Give the appropriate title of your chart and click the Apply button.
Apply Tittle on Chart ce471
  • Let’s say you want to add text responses instead of numbers against every emoji.
  • Click the pencil icon next to the respective emoji. Expand the “Label” properties and write the required text. Then click the “Apply All” button.
  • Click the “Save Changes” button to persist the changes.
Apply Label on Chart ce471
  • Your final chart will appear below.
Final 360 Feedback Examples

Insights

  • A significant disparity exists in effective communication. 45% of respondents express dissatisfaction, 25% remain neutral, and 30% express satisfaction.
  • There is a varied perception of leadership skills, with 35% lacking a clear consensus. It would be advantageous to obtain more specific feedback on leadership behaviors.
  • Collaboration and teamwork generally receive positive views, but there are still respondents who harbor reservations or hold neutral opinions. This indicates the need for ongoing efforts to enhance collaboration.

FAQs

How do you write a good 360 feedback?

To write a good 360-degree feedback:

  1. Be specific about observed behaviors.
  2. Use examples to illustrate points.
  3. Focus on constructive criticism.
  4. Balance positive and negative feedback.
  5. Offer actionable suggestions for improvement.
  6. Maintain a professional and respectful tone.

How do you give 360 feedback examples?

Giving 360 feedback examples effectively involves:

  1. Choosing specific instances to reference.
  2. Describing the observed behavior or action.
  3. Explaining the impact on the situation or team.
  4. Offering suggestions for improvement.
  5. Ensuring the feedback is constructive and respectful.

What is a 360 review template?

A 360 review template is a structured form or questionnaire to gather feedback from various sources. These sources include peers, subordinates, and supervisors. It typically includes questions about an individual’s performance, skills, and behaviors, facilitating a comprehensive evaluation.

Wrap Up

360-degree feedback is a dynamic tool that transcends traditional evaluation methods. Through the real-life 360 feedback examples explored in this journey, we’ve witnessed its transformative potential. It’s about performance, personal growth, team synergy, and leadership evolution.

These anecdotes have showcased how individuals and organizations harness the power of 360 feedback to drive positive change. It’s a compass pointing toward improvement areas, a mirror reflecting strengths and weaknesses, and a roadmap to excellence.

Embracing the wisdom of feedback from all angles helps you embark on a continuous journey of self-improvement. Teams can harmonize their efforts, and organizations can thrive in a culture of growth and adaptability.

The blend of insightful 360 feedback examples and ChartExpo’s data wizardry makes feedback a catalyst for positive change. Together, they make for an unbeatable duo in the pursuit of excellence.

As we conclude this exploration, remember that 360 feedback is not just a tool; it’s a mindset. It’s about embracing feedback as a friend, not a foe. Then using it to sculpt a brighter, more prosperous future.

Go forth with confidence and enhance your performance.

How much did you enjoy this article?

ExcelAd2
Start Free Trial!
131198

Related articles

next previous
Microsoft Excel10 min read

Invoice Tracker Template in Excel for Better Insights

An invoice tracker Excel template helps track invoices, due dates, and payments. Learn how to use this template for better financial management.

Microsoft Excel12 min read

Key Performance Indicators in Healthcare for Better Insights

Key Performance Indicators in healthcare track patient care and efficiency. Learn about these KPIs, top examples, and how to use them to improve outcomes.

Microsoft Excel10 min read

BMI Calculation Formula in Excel for Better Fitness Insights

The BMI calculation formula in Excel helps track and analyze body mass index. Explore step-by-step instructions and tips to simplify BMI tracking in Excel.

Microsoft Excel29 min read

How to Create a Tornado Chart in Excel? A Complete Guide

Click to learn how to plot a Tornado Chart in Excel using easy-to-follow steps. Also, we’ll address the following question: what is a Tornado Diagram?

Microsoft Excel14 min read

How to Create a Scatter Plot in Excel with 3 Variables?

Click to discover how to create a Scatter Plot in Excel with 3 variables. We’ll also address the following question: why do we use Scatter Plot Graph?

ChartExpo logo

Turn Data into Visual
Stories

CHARTEXPO

  • Home
  • Gallery
  • Videos
  • Services
  • Pricing
  • Contact us
  • FAQs
  • Privacy policy
  • Terms of Service
  • Sitemap

TOOLS

  • ChartExpo for Google Sheets
  • ChartExpo for Microsoft Excel
  • Power BI Custom Visuals by ChartExpo
  • Word Cloud

CATEGORIES

  • Bar Charts
  • Circle Graphs
  • Column Charts
  • Combo Charts
  • Comparison Charts
  • Line Graphs
  • PPC Charts
  • Sentiment Analysis Charts
  • Survey Charts

TOP CHARTS

  • Sankey Diagram
  • Likert Scale Chart
  • Comparison Bar Chart
  • Pareto Chart
  • Funnel Chart
  • Gauge Chart
  • Radar Chart
  • Radial Bar Chart
  • Sunburst Chart
  • see more
  • Scatter Plot Chart
  • CSAT Survey Bar Chart
  • CSAT Survey Chart
  • Dot Plot Chart
  • Double Bar Graph
  • Matrix Chart
  • Multi Axis Line Chart
  • Overlapping Bar Chart
  • Control Chart
  • Slope Chart
  • Clustered Bar Chart
  • Clustered Column Chart
  • Box and Whisker Plot
  • Tornado Chart
  • Waterfall Chart
  • Word Cloud
  • see less

RESOURCES

  • Blog
  • Resources
  • YouTube
SIGN UP FOR UPDATES

We wouldn't dream of spamming you or selling your info.

© 2025 ChartExpo, all rights reserved.