• Home
  • Tools dropdown img
    • Spreadsheet Charts

      • ChartExpo for Google Sheets
      • ChartExpo for Microsoft Excel
    • Power BI Charts

      • Power BI Custom Visuals by ChartExpo
    • Word Cloud

  • Charts dropdown img
    • Chart Category

      • Bar Charts
      • Circle Graphs
      • Column Charts
      • Combo Charts
      • Comparison Charts
      • Line Graphs
      • PPC Charts
      • Sentiment Analysis Charts
      • Survey Charts
    • Chart Type

      • Box and Whisker Plot
      • Clustered Bar Chart
      • Clustered Column Chart
      • Comparison Bar Chart
      • Control Chart
      • CSAT Survey Bar Chart
      • CSAT Survey Chart
      • Dot Plot Chart
      • Double Bar Graph
      • Funnel Chart
      • Gauge Chart
      • Likert Scale Chart
      • Matrix Chart
      • Multi Axis Line Chart
      • Overlapping Bar Chart
      • Pareto Chart
      • Radar Chart
      • Radial Bar Chart
      • Sankey Diagram
      • Scatter Plot Chart
      • Slope Chart
      • Sunburst Chart
      • Tornado Chart
      • Waterfall Chart
      • Word Cloud
    • Google Sheets
      Microsoft Excel
  • Services
  • Pricing
  • Contact us
  • Blog
  • Support dropdown img
      • Gallery
      • Videos
      • Contact us
      • FAQs
      • Resources
    • Please feel free to contact us

      atsupport@chartexpo.com

Categories
All Data Visualizations Data Analytics Surveys
Add-ons/
  • Google Sheets
  • Microsoft Excel
  • Power BI
All Data Visualizations Data Analytics Surveys
Add-ons
  • Google Sheets
  • Microsoft Excel
  • Power BI

We use cookies

This website uses cookies to provide better user experience and user's session management.
By continuing visiting this website you consent the use of these cookies.

Ok

ChartExpo Survey


Home > Blog > Data Analytics

Debt Service Coverage Ratio Explained: Example & Analysis

What is the debt service coverage ratio (DSCR)?

Picture this: You’re a small business owner aiming to expand. There are endless possibilities ahead, but your bank balance has its limits! You’re considering taking out a loan, but the decision is not solely yours. Before granting access to their funds, lenders must ensure you can keep your commitment.

What is Debt Service Coverage Ratio

DSCR is like a suitability test for your financial situation that lenders use to determine if they can trust you.

DSCR tells the world how easily you can repay a loan with your current earnings. A DSCR ratio of 1 means you’re running neck and neck with your debts. Above 1, even by a hair, and you’re making a little extra cash to set aside. Under 1, and you’re struggling to keep up with your loans.

A low ratio spells danger to a lender in any economic climate. In today’s unpredictable times, that’s a red flag.

DSCR is not just a signal of trustworthiness for lenders. It also serves as a financial health assessment for your company. A high DSCR can differentiate between getting the necessary funding and losing out on potential opportunities.

This article will explore what the debt service coverage ratio is and its calculation. Furthermore, we’ll explore how DSCR influences your business’s success or failure in today’s economic conditions.

Ready?

Let’s get started.

Table of Content:

  1. What is the Debt Service Coverage Ratio?
  2. What Does DSCR Mean?
  3. Why Does DSCR Matter?
  4. How To Calculate Debt Service Coverage Ratio?
  5. Debt Service Coverage Ratio Formula
  6. Debt Service Coverage Ratio Example
  7. Debt Service Coverage Ratio Example Calculation
  8. What is the Interest Coverage Ratio vs. DSCR?
  9. How to Analyze Debt Service Coverage Ratio (DSCR)?
  10. What is a Good Debt Service Coverage Ratio?
  11. What is a Minimum Debt Service Coverage Ratio?
  12. Application of DSCR in Real Estate
  13. Global Debt Service Coverage Ratio
  14. Advantages of Debt Service Coverage Ratio (DSCR)
  15. Disadvantages of Debt Service Coverage Ratio (DSCR)
  16. How to Improve Your DSCR?
  17. FAQs About DSCR
  18. Wrap Up

First…

What is the Debt Service Coverage Ratio?

Definition: A Debt Service Coverage Ratio (DSCR) is a financial metric lenders use. It measures a borrower’s ability to cover their debt management costs using the revenue generated from their operating income. DSCR is obtained by dividing a business or individual’s net operating income by the total debt service payments.

If the ratio is greater than 1, then the entity generates adequate money to cover its costs. If it is 1 or less, the entity does not generate enough money for its expenses.

Lenders use DSCR to evaluate the creditworthiness of borrowers and determine the terms of loans, such as interest rates. Typically, they prefer higher DSCR values, as they suggest a lower risk of default.

What Does DSCR Mean?

DSCR stands for Debt Service Coverage Ratio. It’s a financial metric lenders use to evaluate borrowers’ ability to meet their debt obligations. Essentially, DSCR indicates the extent to which an entity’s operating income can cover its debt payments.

A DSCR above 1 signifies that the entity generates sufficient income to cover its debt obligations comfortably. This indicates a lower risk of default, which is favorable for lenders.

Conversely, a DSCR below 1 suggests the entity may struggle to meet debt obligations with its current income. It raises concerns about its financial stability and ability to repay loans.

Why Does DSCR Matter?

Debt Service Coverage Ratio (DSCR) provides crucial insights into an entity’s financial health and stability. It influences various aspects of lending, investment, and decision-making processes.

Here’s why DSCR matters:

  • Assessment of debt repayment ability: The debt service coverage ratio (DSCR) measures borrowers’ ability to meet their financial obligations. A high DSCR indicates adequate income to repay loans easily, reducing the likelihood of default. Lenders use the DSCR to guarantee the safety of their investments by ensuring borrowers’ ability to meet their commitments.
  • Risk evaluation: Lenders and investors use DSCR to gauge the level of risk associated with extending credit. Or investing in a particular venture. It helps identify potential red flags and make informed decisions to mitigate risks.
  • Lending and investment decisions: DSCR helps lenders determine the loan conditions they should place, such as interest rates and amounts. Similarly, investors use the DSCR to determine if projects or businesses are ideal for investing their capital. A strong DSCR creates confidence in stakeholders; hence, it is easier for a firm to acquire capital.
  • Project feasibility: DSCR plays a key role in evaluating the feasibility of projects and initiatives. It assists in assessing whether a project can produce sufficient income to meet debt responsibilities and operational costs. Projects that have a high Debt Service Coverage Ratio (DSCR) are seen as more feasible. Thus, they are more inclined to receive financial backing and assistance.
  • Monitoring financial condition: DSCR helps to monitor an entity’s financial stability over time. Such regular monitoring enables foreseeing financial risks and ensuring projects and businesses have a long-term perspective.

How To Calculate Debt Service Coverage Ratio?

Calculating DSCR involves the following steps:

  • Find the Net Operating Income (NOI): Start by calculating the net operating income. This is the income generated from core business operations minus operating expenses.

The formula for NOI is:

NOI=Total Revenue – Total Operating Expenses

  • Find the Total Debt Service: Determine the total debt service, including all payments made during a specific period. This typically includes interest payments and principal repayments on loans.

Total debt service = Principal loan payments + Interest on loan

  • Evaluate the meaning: After calculating the DSCR, interpret the result. A DSCR greater than 1 indicates that the entity generates enough income to cover its debt obligations comfortably. This suggests lower risk and higher financial stability, which is favorable for lenders and investors. A DSCR of less than 1 implies that the entity may struggle to meet its debt obligations. It indicates higher risk and potential financial difficulties.

Debt Service Coverage Ratio Formula

  • Calculate the formula: Once you have the NOI and total debt service, you can calculate the DSCR:
    • The Debt Service Coverage Ratio (DSCR) formula is as below:
What is Debt Service Coverage Ratio Formula

Debt Service Coverage Ratio Example Calculation

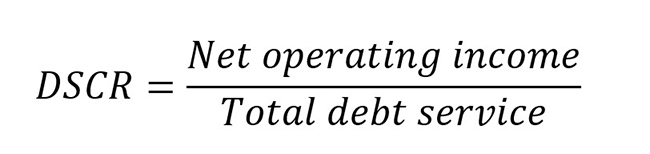
The Debt Service Coverage Ratio (DSCR) measures a company’s ability to cover its debt obligations with its operating income. It is calculated as:

DSCR = Net Operating Income / Total Debt Service

Example:
A company has a net operating income of $500,000 and total debt payments (including principal and interest) of $400,000.

DSCR = 500,000 / 400,000 = 1.25

A DSCR of 1.25 means the company generates 25% more income than needed to cover its debt, indicating good financial health. A DSCR below 1 suggests the company may struggle to meet debt obligations.

What is the Interest Coverage Ratio vs. DSCR?

Interest Coverage Ratio (ICR) and Debt Service Coverage Ratio (DSCR) are essential financial metrics lenders and investors use. Why? To evaluate the financial health and risk associated with a borrower or investment.

Here’s a comparison between Interest Coverage Ratio and Debt Service Coverage Ratio:

Metric Interest Coverage Ratio (ICR) Debt Service Coverage Ratio (DSCR)
Definition Measures the ability of an entity to cover its interest payments with its operating income. Measures the ability of an entity to cover its debt payments with its operating income.
Calculation
Components Operating income (or EBIT) and interest expense. Operating income (or NOI) and total debt service (interest + principal).
Focus Focuses solely on the coverage of interest payments. Considers interest and principal payments, providing a broader view of debt coverage.
Interpretation A higher ICR indicates a stronger ability to cover interest payments, signaling lower risk. A DSCR above 1 indicates sufficient income to cover debt payments comfortably, suggesting lower risk.
Limitations Does not account for principal payments or the overall debt burden. Does not differentiate between different types of debt or the proportion of principal and interest.

How to Analyze Debt Service Coverage Ratio (DSCR)?

Data analysis can feel like trying to untangle a ball of yarn. The more you pull, the messier it gets, especially when analyzing the Debt Service Coverage Ratio (DSCR).

In this arena, data visualization is not just important, it’s indispensable. It turns abstract figures into clear, actionable insights, making sense of the financial health puzzle.

Yet, here’s the kicker: Excel, the old faithful in data analysis, often stumbles when it’s showtime for visualization. Its graphs and charts can feel like reading a map without the legend, leaving you more lost.

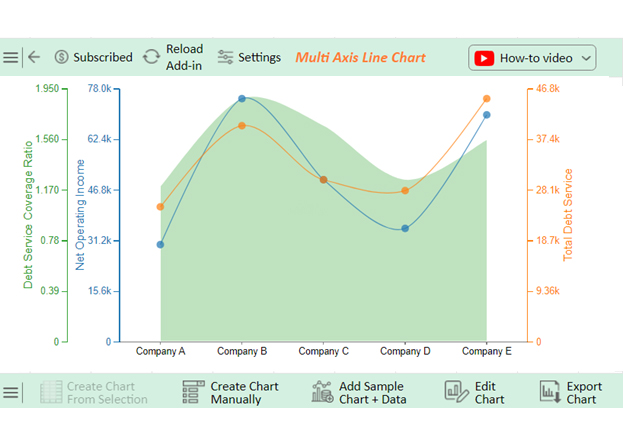
That’s where ChartExpo leaps into the fray. ChartExpo transforms complex DSCR data into visual masterpieces, ensuring that insights don’t just whisper to you; they sing.

Let’s learn how to install ChartExpo in Excel.

  1. Open your Excel application.
  2. Open the worksheet and click the “Insert” menu.
  3. You’ll see the “My Apps” option.
  4. In the Office Add-ins window, click “Store” and search for ChartExpo on the Microsoft Apps Store.
  5. Click the “Add” button to install ChartExpo in Excel.

ChartExpo charts are available both in Google Sheets and Microsoft Excel. Please use the following CTAs to install the tool of your choice and create beautiful visualizations with a few clicks in your favorite tool.

Example

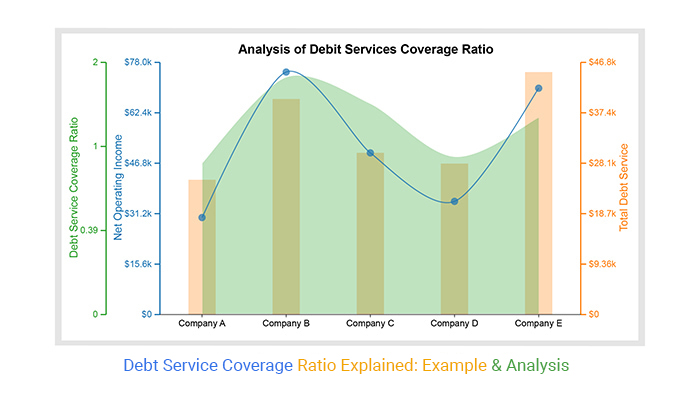
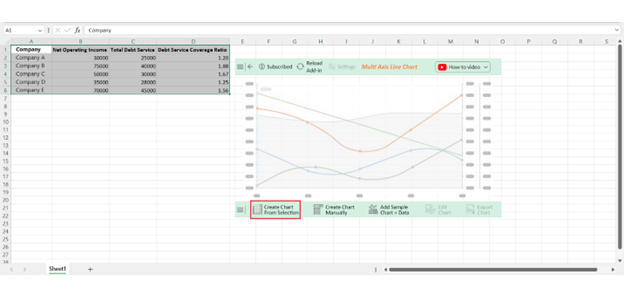
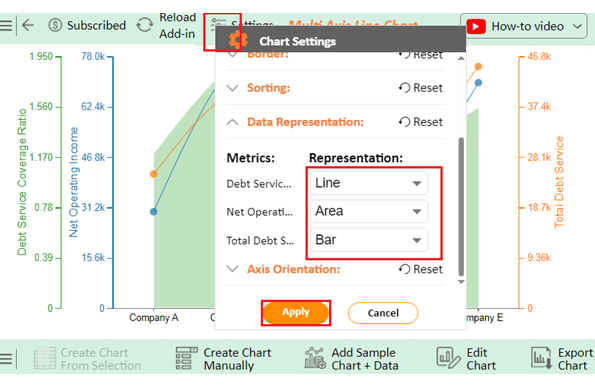
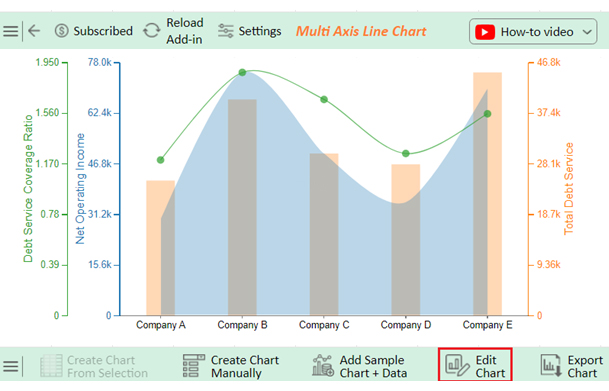
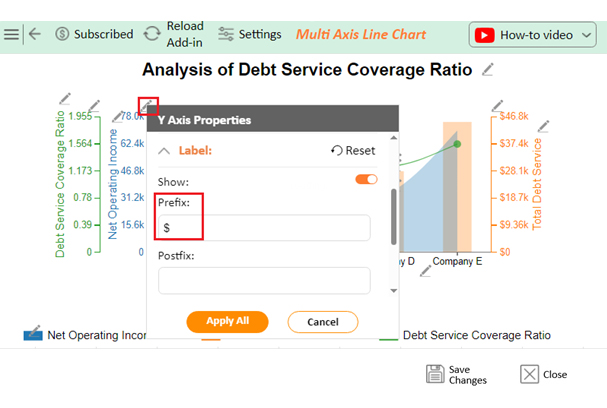
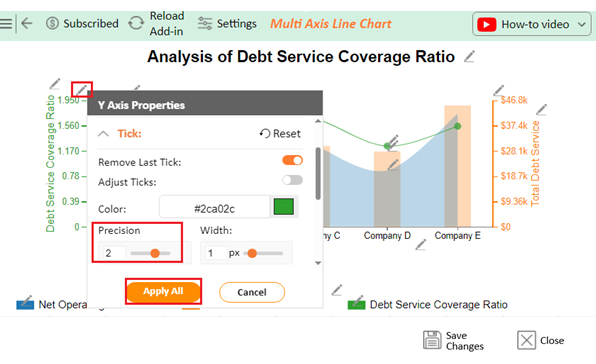
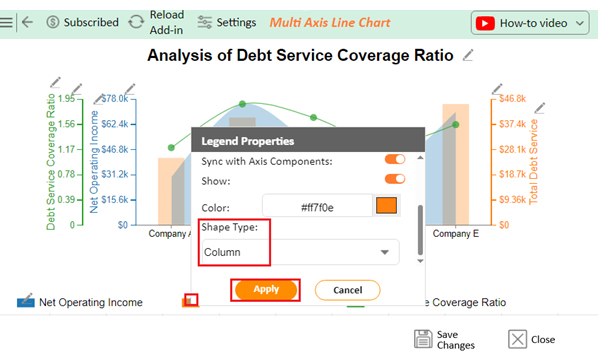
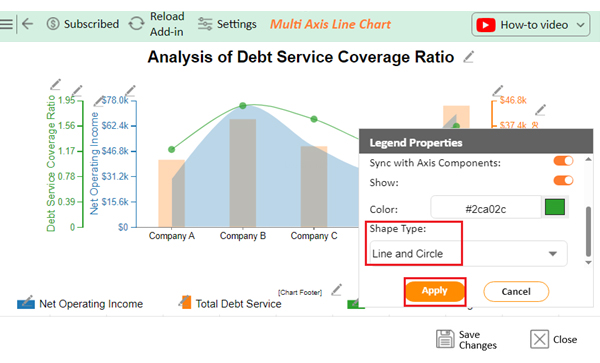
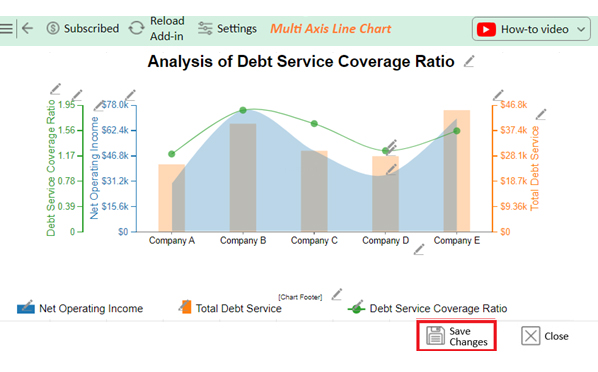
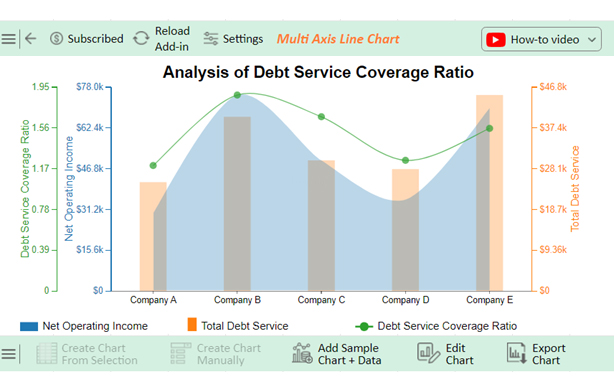
Let’s analyze the debt service coverage example data below using ChartExpo.

Company Net Operating Income Total Debt Service Debt Service Coverage Ratio
Company A 30000 25000 1.20
Company B 75000 40000 1.88
Company C 50000 30000 1.67
Company D 35000 28000 1.25
Company E 70000 45000 1.56
  • To get started with ChartExpo, install ChartExpo in Excel.
  • Now Click on My Apps from the INSERT menu.
insert chartexpo in excel
  • Choose ChartExpo from My Apps, then click Insert.
open chartexpo in excel
  • Once it loads, scroll through the charts list to locate and choose the “Multi Axis Line Chart”.
search multi axis line chart in excel
  • Click the “Create Chart From Selection” button after selecting the data from the sheet, as shown.
Click Create Chart From Selection After Learn What is Debt Service Coverage Ratio
  • ChartExpo will generate the visualization below for you.
Initial Visual After Learn What is Debt Service Coverage Ratio
  • Click on Settings and change the “Data Representation” as follows.
Change Data Represenation After Learn What is Debt Service Coverage Ratio
  • If you want to add anything to the chart, click the Edit Chart button:
Click Edit Chart After Learn What is Debt Service Coverage Ratio
  • Click the pencil icon next to the Chart Header to change the title.
  • It will open the properties dialog. Under the Text section, you can add a heading in Line 1 and enable Show.
  • Give the appropriate title of your chart and click the Apply button.
Add Chart Header After Learn What is Debt Service Coverage Ratio
  • Add dollar sign with Total Debt Services:
Add Prefix Total Debt After Learn What is Debt Service Coverage Ratio
  • Add dollar sign with Net Operating Income:
Add Prefix Net Operating Income After Learn What is Debt Service Coverage Ratio
  • Change the precision value of DSCR into “two” as follows:
Change Precision Value of DSCR After Learn What is Debt Service Coverage Ratio
  • Change the Legend shape of Total Debt Services to Column and click the Apply button.
Change Legend Total Debt Services After Learn What is Debt Service Coverage Ratio
  • Change the Legend shape of the Debt Service Coverage Ratio into a Line and Circle and click the Apply button.
Change Legend Debt Service After Learn What is Debt Service Coverage Ratio
  • Click the Save Changes button to persist the changes made to the chart.
Click Save Changes After Learn What is Debt Service Coverage Ratio
  • Your final Multi Axis Line Chart will look like the one below.
Final What is Debt Service Coverage Ratio

Insights

  • Company B boasts the highest Net Operating Income, $75,000, and the highest Debt Service Coverage Ratio, 1.88.
  • Company E is also demonstrating strong performance, with a notable Net Operating Income of $70,000. It also has a reasonable Debt Service Coverage Ratio of 1.56.
  • Despite having a moderate Net Operating Income of $35,000, Company D has the lowest Debt Service Coverage Ratio at 1.25.

What is a Good Debt Service Coverage Ratio?

A good Debt Service Coverage Ratio (DSCR) typically falls in the range of 1.25 or higher. This indicates that a company or individual has sufficient income to cover debt obligations with a comfortable buffer.

General DSCR Guidelines:

  • Below 1.0 – Insufficient income to cover debt (high risk).
  • 1.0 – 1.2 – Barely covering debt payments (moderate risk).
  • 1.25 – 1.5 – Strong financial health (low risk).
  • Above 2.0 – Excellent financial position (very low risk).

Lenders and investors prefer a DSCR of at least 1.25, ensuring there is enough cash flow to cover debts and maintain financial stability. However, ideal ratios can vary by industry and lender requirements.

What is a Minimum Debt Service Coverage Ratio?

The Minimum Debt Service Coverage Ratio (DSCR) refers to the lowest acceptable ratio of a borrower’s net operating income (NOI) to its total debt service obligations (principal and interest payments). Lenders use this metric to assess a borrower’s ability to generate enough income to cover debt payments.

A DSCR of 1.0 means the borrower has just enough income to meet debt obligations, while a minimum DSCR requirement (e.g., 1.2 or 1.5) ensures a financial cushion. A higher ratio reduces the lender’s risk.

It is commonly used in real estate, corporate finance, and commercial lending.

Application of DSCR in Real Estate

  • Loan Approval: Lenders require a DSCR of 1.25+ to ensure sufficient rental income.
  • Investment Analysis: Higher DSCR means lower risk and better profitability.
  • Refinancing: A strong DSCR improves the chances of better loan terms.
  • Risk Assessment: Helps evaluate the financial stability of properties and portfolios.
  • Formula: DSCR = Net Operating Income (NOI) / Total Debt Service.

Global Debt Service Coverage Ratio

The Global Debt Service Coverage Ratio (GDSCR) measures a company’s or individual’s ability to cover total debt obligations, including both business and personal debt.

  • Purpose: Assesses financial health and repayment capacity.
  • Ideal Ratio: Above 1.25 is considered safe; below 1.0 indicates risk.
  • Used By: Lenders, investors, and financial analysts.
  • Higher Ratio: Indicates better ability to meet debt obligations.

Advantages of Debt Service Coverage Ratio (DSCR)

  • Simple and clear measure: DSCR provides a simple and clear measure that is easily understandable to lenders, investors, and stakeholders.
  • Comprehensive assessment: It thoroughly assesses an entity’s capacity to meet its financial obligations. It takes into account both earnings before interest and taxes and payments for borrowed money.
  • Standardized measurement: The DSCR enables standardized comparisons between various entities and industries, aiding in benchmarking and risk evaluation.
  • Risk indicator: A high Debt Service Coverage Ratio (DSCR) suggests decreased default risk. It gives lenders and investors important information about borrowers’ financial stability and creditworthiness.
  • Strategic planning: DSCR directs financial decisions regarding debt management, investments, and business growth.

Disadvantages of Debt Service Coverage Ratio (DSCR)

  • Limited focus: DSCR concentrates on the capability to settle obligations. This approach may not mirror the entity’s actual financial situation or functional independence.
  • Dependent on EBITDA: DSCR depends on EBITDA. Even though EBITDA considers profit, it may not reflect the company’s actual cash flow or financial performance.
  • Non-monetary impact: DSCR might be affected by non-monetary components like depreciation and amortization. These objects could skew the calculation and interpretation of the ratio.
  • Not suitable for every entity: DSCR may not be appropriate for entities with inconsistent income patterns, seasonal changes, or significant non-operating income or expenses.
  • Absence of future foreseeability: Although DSCR offers information on present debt coverage, it might not reliably predict future cash flows. This reduces its effectiveness for long-term financial planning and forecasting.

How to Improve Your DSCR?

Increase Income:

  • Boost business revenue through sales growth.
  • Diversify income streams to reduce reliance on a single source.
  • Optimize pricing strategies to improve profit margins.

Reduce Debt Obligations:

  • Refinance loans to secure lower interest rates.
  • Extend loan terms to reduce monthly payments.
  • Pay off high-interest debt to lower overall obligations.

Control Expenses:

  • Cut unnecessary operational costs.
  • Improve efficiency in resource management.
  • Renegotiate contracts with vendors to lower expenses.

Enhance Cash Flow Management:

  • Speed up accounts receivable collection.
  • Delay non-essential expenses.
  • Maintain a cash reserve to avoid short-term borrowing.

FAQs About DSCR

What does a 1.2 debt service coverage ratio mean?

A debt service coverage ratio of 1.2 means there is $1.20 of operating income for every dollar of debt payments. This means the company has a greater margin to cover all debts.

What happens if the Debt Service Coverage Ratio exceeds 2?

A Debt Service Coverage Ratio (DSCR) above 2 indicates that the company’s earnings exceed twice its debt obligations. This shows a robust financial standing with enough buffer to easily meet debt commitments.

What constitutes a good debt service coverage ratio?

A DSCR of 1.2 or higher is considered good, but most lenders prefer a DSCR of 1.5 or more. Higher Debt Service Coverage Ratio (DSCR) values demonstrate better financial stability and reduced chances of borrower default.

Wrap Up

DSCR is an essential financial instrument for evaluating borrowers’ capacity to fulfill their debt obligations. It evaluates how an entity’s operating income compares to debt service payments. An entity with a DSCR over 1 generates sufficient income to pay off its debts. A DSCR of less than 1 indicates possible financial struggle.

A high DSCR is good because it also shows a low chance of default. It assures the person lending or investing that the borrower is liquid. This means that the organization has enough money to offset its debts. Thus, there are meager chances of defaulting or being unable to pay on time.

Conversely, a low debt service coverage ratio would raise concerns about the organization’s ability to pay its debts. This might indicate poor cash balances, making it riskier for a lender to give a loan. Or for an investor to offer funds.

A DSCR lower than 1 signifies that the company’s earnings are insufficient to meet its debt obligations. This may result in a default.

There is no set standard for determining what qualifies as a satisfactory DSCR. Nevertheless, lenders generally favor ratios of 1.2 or 1.5 and above. A stronger financial position is indicated by higher DSCR values, allowing for a larger safety net for debt repayment. The ideal DSCR can differ based on factors such as:

  • Industry norms
  • The stability of cash flows
  • The specific terms of the loan

Conclusively, the Debt Service Coverage Ratio (DSCR) helps evaluate borrowers’ creditworthiness and financial health. It is a key factor in lending decisions, investment evaluations, and strategic planning. Maintaining a healthy DSCR is essential to ensuring financial stability and mitigating the risk of default.

How much did you enjoy this article?

PBIAd1
Start Free Trial!
135826

Related articles

next previous
Data Analytics31 min read

Data Analysis Without Nonsense: Fix the Right Problem, Fast

Data analysis can mislead when metrics look right but outcomes fail. Learn how to spot red flags, fix failures, and make better decisions. Read on!

Data Analytics29 min read

Variance Analysis Isn’t a Math Problem, It’s a Trust Problem

Variance analysis helps identify what went wrong, who owns it, and what to do next. Use it to drive decisions, not just reports. Learn more!

Data Analytics10 min read

Supplier Comparison Template: Download It Now

A supplier comparison template streamlines vendor evaluation by comparing cost and quality. Click here to learn its benefits and how to analyze them.

Data Analytics32 min read

Ecommerce Analytics: How to Fix What It Often Gets Wrong

Ecommerce analytics often lead to mixed signals and costly misreads. Fix attribution gaps, align teams, and act on the right data. Get started now!

Data Analytics30 min read

When Sales Funnel Breaks: Failures, Fixes, & Funnel Debt

Is your sales funnel hiding costly gaps? Learn how pipeline stalls, false metrics, and handoff chaos could be draining revenue. Get started now!

ChartExpo logo

Turn Data into Visual
Stories

CHARTEXPO

  • Home
  • Gallery
  • Videos
  • Services
  • Pricing
  • Contact us
  • FAQs
  • Privacy policy
  • Terms of Service
  • Sitemap

TOOLS

  • ChartExpo for Google Sheets
  • ChartExpo for Microsoft Excel
  • Power BI Custom Visuals by ChartExpo
  • Word Cloud

CATEGORIES

  • Bar Charts
  • Circle Graphs
  • Column Charts
  • Combo Charts
  • Comparison Charts
  • Line Graphs
  • PPC Charts
  • Sentiment Analysis Charts
  • Survey Charts

TOP CHARTS

  • Sankey Diagram
  • Likert Scale Chart
  • Comparison Bar Chart
  • Pareto Chart
  • Funnel Chart
  • Gauge Chart
  • Radar Chart
  • Radial Bar Chart
  • Sunburst Chart
  • see more
  • Scatter Plot Chart
  • CSAT Survey Bar Chart
  • CSAT Survey Chart
  • Dot Plot Chart
  • Double Bar Graph
  • Matrix Chart
  • Multi Axis Line Chart
  • Overlapping Bar Chart
  • Control Chart
  • Slope Chart
  • Clustered Bar Chart
  • Clustered Column Chart
  • Box and Whisker Plot
  • Tornado Chart
  • Waterfall Chart
  • Word Cloud
  • see less

RESOURCES

  • Blog
  • Resources
  • YouTube
SIGN UP FOR UPDATES

We wouldn't dream of spamming you or selling your info.

© 2025 ChartExpo, all rights reserved.