• Home
  • Tools dropdown img
    • Spreadsheet Charts

      • ChartExpo for Google Sheets
      • ChartExpo for Microsoft Excel
    • Power BI Charts

      • Power BI Custom Visuals by ChartExpo
    • Word Cloud

  • Charts dropdown img
    • Chart Category

      • Bar Charts
      • Circle Graphs
      • Column Charts
      • Combo Charts
      • Comparison Charts
      • Line Graphs
      • PPC Charts
      • Sentiment Analysis Charts
      • Survey Charts
    • Chart Type

      • Box and Whisker Plot
      • Clustered Bar Chart
      • Clustered Column Chart
      • Comparison Bar Chart
      • Control Chart
      • CSAT Survey Bar Chart
      • CSAT Survey Chart
      • Dot Plot Chart
      • Double Bar Graph
      • Funnel Chart
      • Gauge Chart
      • Likert Scale Chart
      • Matrix Chart
      • Multi Axis Line Chart
      • Overlapping Bar Chart
      • Pareto Chart
      • Radar Chart
      • Radial Bar Chart
      • Sankey Diagram
      • Scatter Plot Chart
      • Slope Chart
      • Sunburst Chart
      • Tornado Chart
      • Waterfall Chart
      • Word Cloud
    • Google Sheets
      Microsoft Excel
  • Services
  • Pricing
  • Contact us
  • Blog
  • Support dropdown img
      • Gallery
      • Videos
      • Contact us
      • FAQs
      • Resources
    • Please feel free to contact us

      atsupport@chartexpo.com

Categories
All Data Visualizations Data Analytics Surveys
Add-ons/
  • Google Sheets
  • Microsoft Excel
  • Power BI
All Data Visualizations Data Analytics Surveys
Add-ons
  • Google Sheets
  • Microsoft Excel
  • Power BI

We use cookies

This website uses cookies to provide better user experience and user's session management.
By continuing visiting this website you consent the use of these cookies.

Ok

ChartExpo Survey


Home > Blog > Data Analytics

What is a White Paper Report & How to Use It Effectively?

What is a white paper report? This question is frequently asked in business and technology alike.

A white paper report is an informative document that promises to provide valuable details about a problem. Firms use it to convey intricate details in a simple and engaging way. As of 2022, more than 70% of B2B buyers used white papers in their buying decisions. This underscores their place in marketing strategies.

White papers are not just informational; they are strategic. They are used to establish credibility in a particular area. Businesses use them to demonstrate the talent they can offer and show their power to help influence decisions.

What is a White Paper Report

Whitepapers are a staple of the tech industry. Why? They explain new ideas and applications for technology products. This helps clients understand and feel comfortable using the innovations.

A white paper report is structured and detailed. It includes an introduction, problem statement, solution, and conclusion. This format allows the content to be deployed in a way that is logical and, therefore, convincing. 76% of business executives consider white papers the most informative influence for in-depth decision-making.

This knowledge could provide a great competitive edge for your business. It is a powerful way to involve an audience and develop credibility. A white paper lends itself well as a statement piece for announcements, new product introductions or trends in your industry.

So, keep reading to learn how this tool could improve your communication strategy and inspire results.

Table of Contents:

  1. What is a White Paper Report?
  2. Top 5 Charts of White Paper Report
  3. Why is a White Paper Report Important?
  4. What is the Purpose of a White Paper?
  5. How Many Types of White Papers Report?
  6. What is the Structure of a White Paper Report?
  7. Who Uses White Paper Report?
  8. What Type of Mistakes a White Paper Report Should Avoid?
  9. How to Write a White Paper Report?
  10. How to Analyze White Paper Report in Excel?
  11. Wrap Up

First…

What is a White Paper Report?

Definition: A white paper report is a detailed document that presents information on a specific topic. It provides data, analysis, and insights to educate or persuade readers.

White papers are often used in business, government, or academic contexts to:

  • Propose solutions to problems
  • Explain complex issues
  • Guide decision-making

They typically include background information, research findings, and recommended actions.

White papers are authoritative and well-researched, making them valuable tools for influencing decisions or informing policy. They are commonly used in marketing to showcase expertise and build credibility with potential clients or stakeholders.

Top 5 Charts of White Paper Report

Mosaic Plot (aka Mekko)

Mosaic Plot (aka Mekko) for Showing What is a White Paper Report

Circular Org Chart

Circular Org Chart for Showing What is a White Paper Report

Sankey Chart

Sankey Chart for Showing What is a White Paper Report

Likert Scale Chart

Likert Scale Chart for Showing What is a White Paper Report

Horizontal Waterfall Chart

Horizontal Waterfall Chart for Showing What is a White Paper Report

Why is a White Paper Report Important?

White paper reports are powerful tools that can make a real impact. Here’s why they’re so important:

  • Builds authority and trust: A well-crafted white paper establishes your expertise and credibility. It makes your audience see you as a trusted authority in your field.
  • Informs and educates: White papers provide in-depth information, helping your audience understand complex issues and make informed decisions.
  • Boosts marketing and leadership: They support your marketing efforts by driving thought leadership, positioning your brand as a leader, and ultimately aiding sales.

What is the Purpose of a White Paper?

Have you ever wondered why white papers are so widely used? Here’s what they’re all about:

  • Educate the audience: White papers break down complex topics, helping readers understand important issues in depth.
  • Persuade and influence: They present well-researched arguments to convince the audience of a particular viewpoint or solution.
  • Guide decision-making: White papers help leaders and stakeholders make informed decisions by providing detailed analysis and insights.

How Many Types of White Papers Report?

White papers come in several distinct types, each designed to address different needs and audiences. Here’s a deeper look:

  1. Backgrounder: This white paper comprehensively overviews a product, service, or technology. It explains its features, benefits, and how it fits into the broader market. Backgrounders are often used to support product launches or give potential customers a solid understanding of your offer.
  2. Problem/Solution: A problem/solution white paper tackles a specific challenge the target audience faces. It first defines the problem in detail and then offers a well-researched solution. This type is highly persuasive and aims to drive conversions.
  3. Technical: Technical white papers delve into the complex technical details of a product, process, or system. They target a highly knowledgeable audience, such as engineers, IT professionals, or industry specialists. This audience needs in-depth technical information to make decisions.
  4. Market Research: These white papers present data-driven insights, analyzing industry trends, market dynamics, or consumer behaviors. They provide valuable information that helps businesses and stakeholders make data-driven decisions based on current and projected market conditions.
  5. Policy: Policy white papers are often used by governments, NGOs, or think tanks to explore, recommend, or critique public policies. They present thorough research and analysis on policy issues, offering recommendations or advocating for specific changes to legislation.

What is the Structure of a White Paper Report?

A white paper is more than just a report, it’s a tool to inform, persuade, and guide decisions. Knowing its structure can help you create a compelling document.

  1. Title page: Start with a clear, concise title that captures the essence of the report. Include the author’s name and date for context.
  2. Executive summary: This section provides a brief overview of the entire report. It highlights the main points, allowing readers to understand the content quickly.
  3. Introduction: Set the stage by explaining the purpose of the white paper. Outline what the reader can expect and why the topic is important.
  4. Background/context: Provide the necessary background information or context that leads to the problem. This helps readers understand the issue in a broader sense.
  5. Problem description: Clearly define the problem the white paper addresses. Use data and facts to underline its significance.
  6. Solution/recommendations: Offer detailed solutions or recommendations to address the problem. This is the core of the white paper, where your insights and expertise shine.
  7. Conclusion: Summarize the key points and reinforce the importance of taking action based on the recommendations.
  8. References: List all the sources you used to support your arguments. This adds credibility and allows readers to explore further.
  9. Appendices (optional): Include any additional information supporting the report but not essential to the main text. This could be charts, graphs, or detailed data.

Who Uses White Paper Report?

White paper reports are versatile documents that serve various industries and purposes.

  • Businesses: Companies use white papers to present solutions, showcase expertise, and influence decision-making. They’re often used in marketing to educate potential clients.
  • Governments: Government agencies rely on white papers to inform policy decisions, propose new regulations, or provide insight into complex issues. They help communicate with stakeholders and the public.
  • Academics: Scholars and researchers use white papers to share findings and propose new theories. They also contribute to discussions within academic communities.
  • Nonprofits: Nonprofit organizations use white papers to advocate for causes, raise awareness, and influence public opinion. They help in fundraising efforts by demonstrating the need for action.
  • Consultants: Consultants create white papers to provide clients with in-depth analysis and recommendations. They use these reports to establish authority and build trust.

What Type of Mistakes a White Paper Report Should Avoid?

Crafting a white paper requires precision and clarity. Avoiding these common mistakes ensures your report is effective and professional.

  • Lack of clear focus: Stay on topic. A scattered report loses its impact and confuses the reader.
  • Insufficient research: Back your claims with solid evidence. Inadequate research undermines credibility.
  • Overly technical language: Simplify complex terms. Using too much jargon can alienate your audience.
  • Weak structure: Organize your content logically. A disorganized report is hard to follow and diminishes your argument.
  • Unsubstantiated claims: Provide proof for your statements. Unsupported assertions weaken the report’s authority.
  • Poor design and formatting: Ensure the report is visually appealing. Cluttered or unattractive design distracts from the content.
  • Ignoring the audience: Tailor the report to your readers. Failing to consider their needs makes the report less relevant.
  • Neglecting proofreading: Always check for errors. Typos and mistakes can damage your professionalism.

How to Write a White Paper Report?

To write an effective white paper, follow these steps:

  1. Define the purpose: Identify the problem your paper addresses and its goals. Make it clear why your audience should care.
  2. Conduct research: Gather credible data, expert opinions, and relevant case studies. Use reliable sources to build a solid foundation for your arguments.
  3. Create an outline: Organize your ideas into key sections, including an introduction, problem statement, analysis, solutions, and conclusion.
  4. Write and revise: Draft each section with clarity and purpose. Use simple language and keep your audience in mind. Revise to improve flow, remove jargon, and ensure each point is well-supported.
  5. Design and format: Make the document visually appealing with clear headings, bullet points, images, graphs, and charts. Use consistent fonts and colors to enhance readability.
  6. Proofread: Carefully check for grammar, spelling, and formatting errors. Ensure the document is polished and professional.

How to Analyze White Paper Report in Excel?

Data analysis is a maze. Numbers alone tell no tales.

White papers overflow with data. But insights? They’re hidden.

Don’t worry because we have data visualization – it turns chaos into clarity.

Excel tries, but it stumbles. Its charts are basic, and limitations abound.

Enter ChartExpo. It transforms data, making visuals vivid and insights leap off the page. ChartExpo conquers Excel’s shortcomings, making data analysis a breeze.

Let’s learn how to install ChartExpo in Excel.

  1. Open your Excel application.
  2. Open the worksheet and click the “Insert” menu.
  3. You’ll see the “My Apps” option.
  4. In the Office Add-ins window, click “Store” and search for ChartExpo on my Apps Store.
  5. Click the “Add” button to install ChartExpo in your Excel.

ChartExpo charts are available both in Google Sheets and Microsoft Excel. Please use the following CTAs to install the tool of your choice and create beautiful visualizations with a few clicks in your favorite tool.

White Paper Report Example

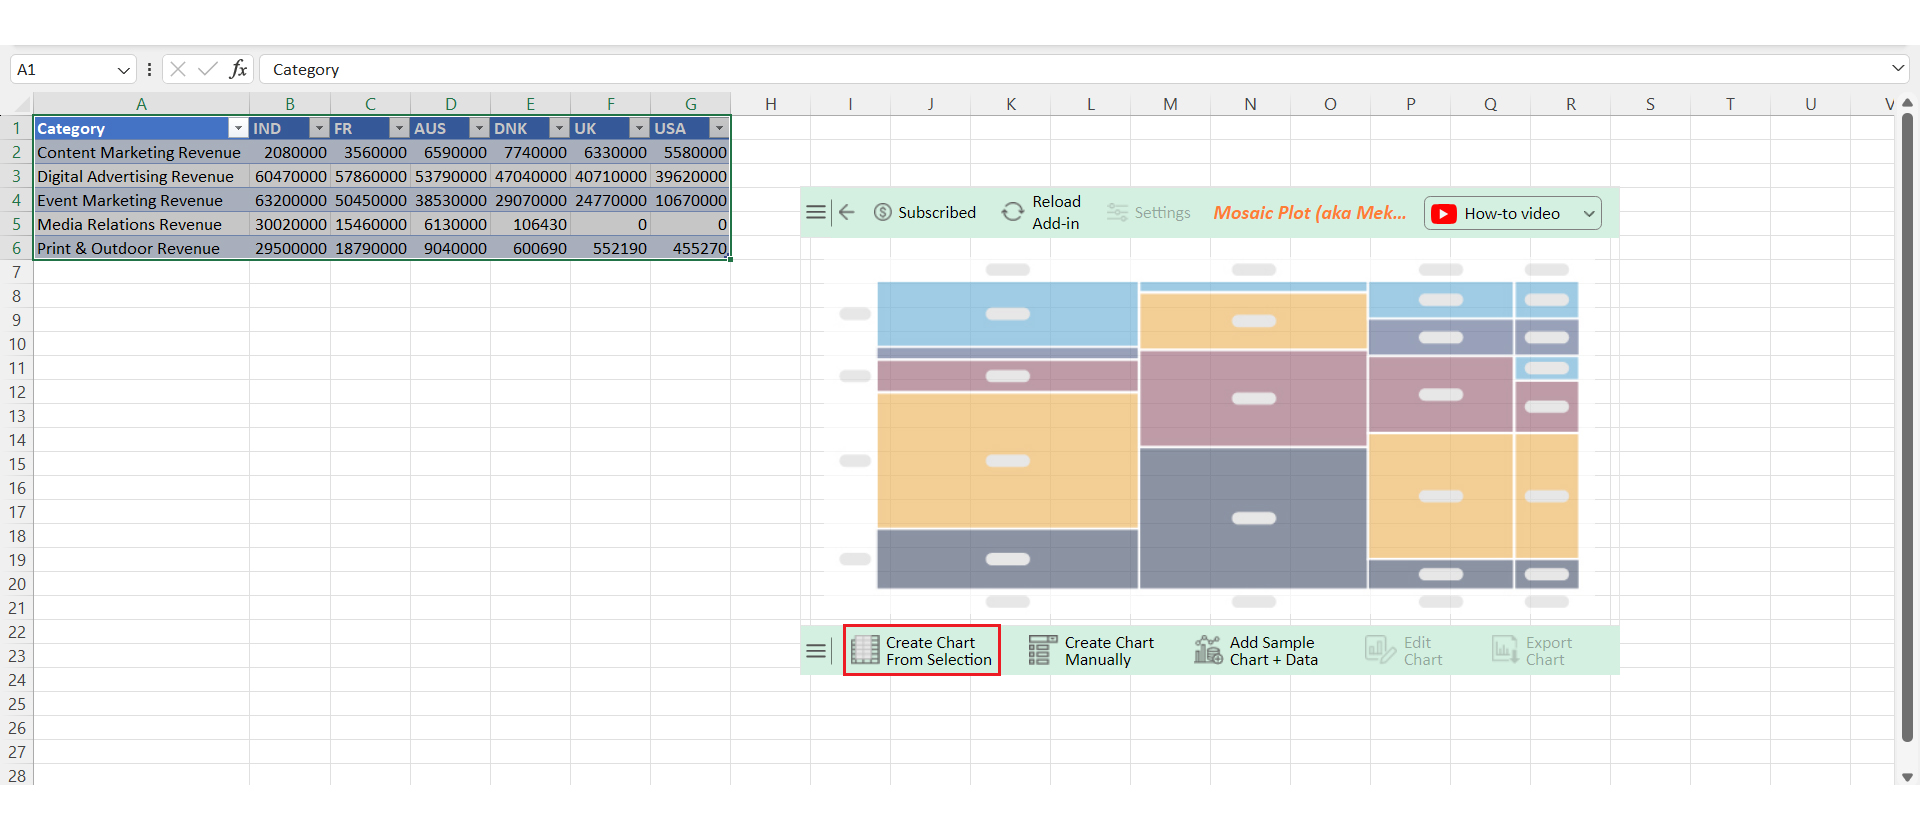
Let’s create a white paper report from the data below using ChartExpo and analyze it.
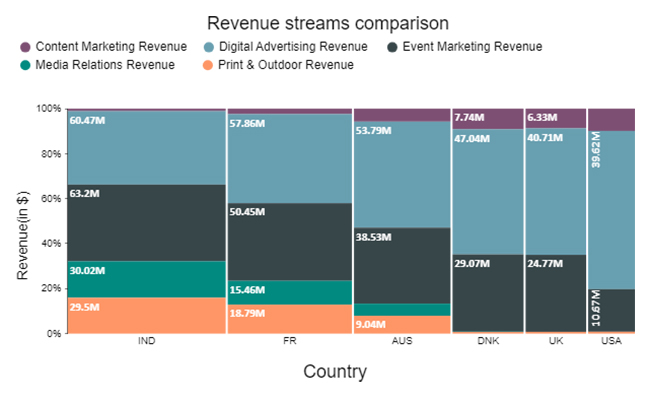
Category IND FR AUS DNK UK USA
Content Marketing Revenue 2080000 3560000 6590000 7740000 6330000 5580000
Digital Advertising Revenue 60470000 57860000 53790000 47040000 40710000 39620000
Event Marketing Revenue 63200000 50450000 38530000 29070000 24770000 10670000
Media Relations Revenue 30020000 15460000 6130000 106430 0 0
Print & Outdoor Revenue 29500000 18790000 9040000 600690 552190 455270
  • To get started with ChartExpo, install ChartExpo in Excel.
  • Now Click on My Apps from the INSERT menu.
insert chartexpo in excel
  • Choose ChartExpo from My Apps, then click Insert.
open chartexpo in excel
  • Once it loads, choose the “Mosaic Plot (aka Mekko)” from the charts list.
search mosaic plot (aka mekko)
  • Click the “Create Chart From Selection” button after selecting the data from the sheet, as shown.
Click Create Chart From Selection for Showing What is a White Paper Report
  • ChartExpo will generate the visualization below for you.
Initial Visual for Showing What is a White Paper Report
  • If you want to have the chart’s title, click Edit Chart, as shown in the above image.
  • Click the pencil icon next to the Chart Header to change the title.
  • It will open the properties dialog. Under the Text section, you can add a heading in Line 1 and enable Show.
  • Give the appropriate title of your chart and click the Apply button.
Add Chart Header for Showing What is a White Paper Report
  • You can add the label on the left side as follows:
Add Label on Left Side for Showing What is a White Paper Report
  • You can add the label of the Chart Footer as follows:
Add Label of Chart Footer for Showing What is a White Paper Report
  • Click the “Save Changes” button to persist the changes.
Click Save Changes for Showing What is a White Paper Report
  • Your Mosaic Plot (aka Mekko) will appear as below.
Final What is a White Paper Report

Insights

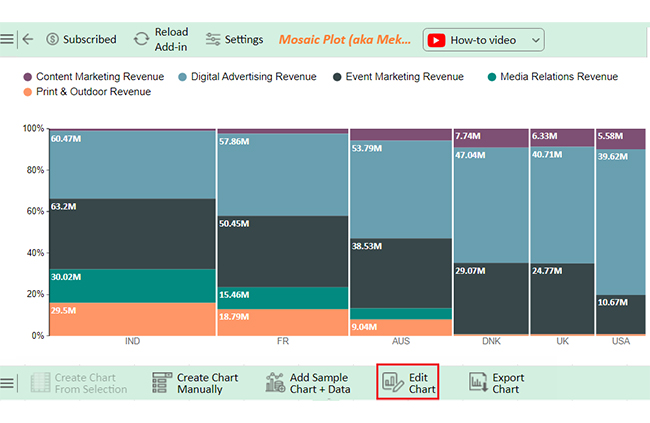
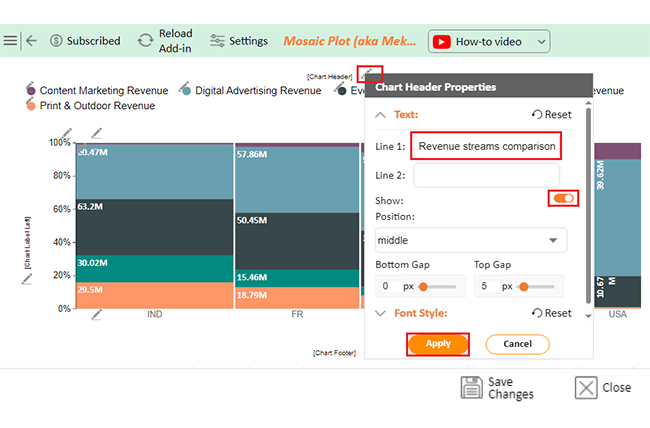
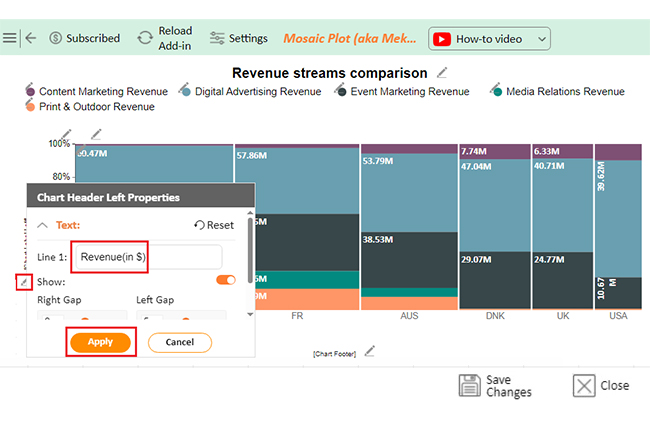
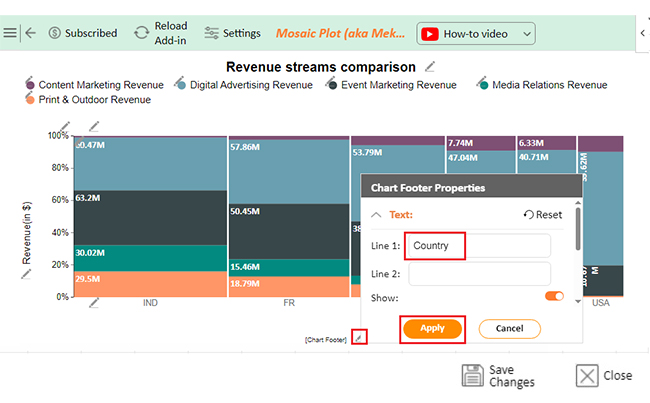
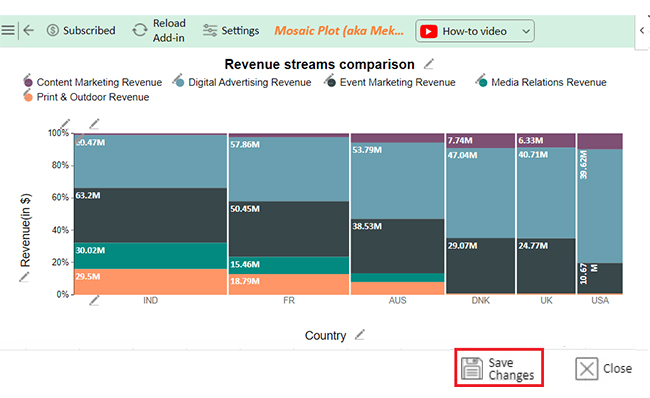
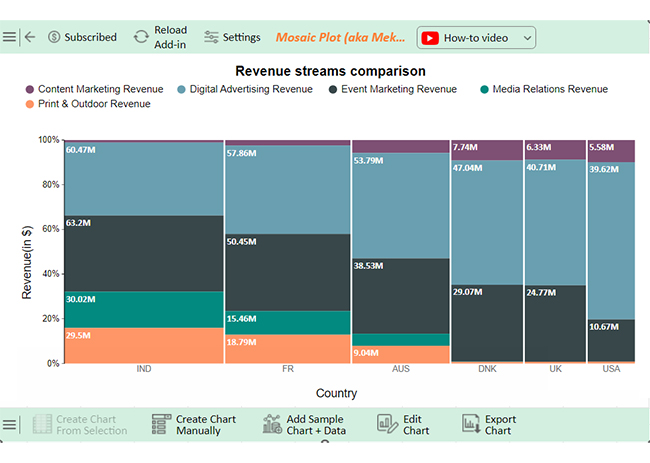
Revenue distribution across the six countries:

  • Digital advertising leads, mainly in the USA and India.
  • Event marketing plays a major role.
  • Media relations and print/outdoor revenues show significant variation.

Elevate White Paper Report Analysis Through Mosaic Plot Techniques in Microsoft Excel:

  1. Open your Excel Application.
  2. Install ChartExpo Add-in for Excel from Microsoft AppSource to create interactive visualizations.
  3. Select the Mosaic Plot from the list of charts.
  4. Select your data.
  5. Click on the “Create Chart from Selection” button.
  6. Customize your chart properties to add header, axis, legends, and other required information.
  7. Export your chart and share it with your audience.

The following video will help you to create a Mosaic Plot in Microsoft Excel.


FAQs

Can I use Power BI to generate visuals for my white paper report?

Yes, you can use Power BI to create visuals for your white paper report. It’s a powerful tool for generating detailed charts, graphs, and data visualizations. These visuals can enhance your report’s clarity and make complex data more understandable.

What are the best practices for presenting data in a white paper report?

  • Use clear, simple visuals.
  • Label charts and graphs accurately.
  • Ensure the data is relevant and directly supports your points.
  • Avoid clutter and focus on key insights.
  • Use consistent formatting for a professional and cohesive look.

What role do infographics play in a white paper report?

Infographics simplify complex information, making data more accessible and engaging. They can highlight key statistics and trends, break up text, and make the report visually appealing and easier to digest.

Wrap Up

A white paper report is a powerful communication tool. It serves multiple purposes in different fields. White papers are detailed documents that provide in-depth information. They aim to educate, persuade, and inform.

White papers establish authority, show expertise, and build trust. Businesses, governments, and organizations use them to share knowledge. They are well-researched and credible.

White papers also help guide decision-making. They present clear analyses and solutions, and decision-makers rely on them to make informed choices. They simplify complex topics and offer valuable insights.

White papers also benefit marketing and sales. They drive thought leadership and position brands as industry leaders. They support marketing strategies by influencing potential clients.

There are different types of white papers, each serving a unique purpose. From backgrounders to market research, they cater to specific needs. They can focus on technical details or policy recommendations.

In conclusion, a white paper report is essential. It educates, persuades, and guides. It establishes credibility and supports decision-making. They are a cornerstone of effective communication. Their impact is significant in shaping opinions and driving actions.

How much did you enjoy this article?

GSAd1
Start Free Trial!
141534

Related articles

next previous
Data Analytics31 min read

Data Analysis Without Nonsense: Fix the Right Problem, Fast

Data analysis can mislead when metrics look right but outcomes fail. Learn how to spot red flags, fix failures, and make better decisions. Read on!

Data Analytics29 min read

Variance Analysis Isn’t a Math Problem, It’s a Trust Problem

Variance analysis helps identify what went wrong, who owns it, and what to do next. Use it to drive decisions, not just reports. Learn more!

Data Analytics10 min read

Supplier Comparison Template: Download It Now

A supplier comparison template streamlines vendor evaluation by comparing cost and quality. Click here to learn its benefits and how to analyze them.

Data Analytics32 min read

Ecommerce Analytics: How to Fix What It Often Gets Wrong

Ecommerce analytics often lead to mixed signals and costly misreads. Fix attribution gaps, align teams, and act on the right data. Get started now!

Data Analytics30 min read

When Sales Funnel Breaks: Failures, Fixes, & Funnel Debt

Is your sales funnel hiding costly gaps? Learn how pipeline stalls, false metrics, and handoff chaos could be draining revenue. Get started now!

ChartExpo logo

Turn Data into Visual
Stories

CHARTEXPO

  • Home
  • Gallery
  • Videos
  • Services
  • Pricing
  • Contact us
  • FAQs
  • Privacy policy
  • Terms of Service
  • Sitemap

TOOLS

  • ChartExpo for Google Sheets
  • ChartExpo for Microsoft Excel
  • Power BI Custom Visuals by ChartExpo
  • Word Cloud

CATEGORIES

  • Bar Charts
  • Circle Graphs
  • Column Charts
  • Combo Charts
  • Comparison Charts
  • Line Graphs
  • PPC Charts
  • Sentiment Analysis Charts
  • Survey Charts

TOP CHARTS

  • Sankey Diagram
  • Likert Scale Chart
  • Comparison Bar Chart
  • Pareto Chart
  • Funnel Chart
  • Gauge Chart
  • Radar Chart
  • Radial Bar Chart
  • Sunburst Chart
  • see more
  • Scatter Plot Chart
  • CSAT Survey Bar Chart
  • CSAT Survey Chart
  • Dot Plot Chart
  • Double Bar Graph
  • Matrix Chart
  • Multi Axis Line Chart
  • Overlapping Bar Chart
  • Control Chart
  • Slope Chart
  • Clustered Bar Chart
  • Clustered Column Chart
  • Box and Whisker Plot
  • Tornado Chart
  • Waterfall Chart
  • Word Cloud
  • see less

RESOURCES

  • Blog
  • Resources
  • YouTube
SIGN UP FOR UPDATES

We wouldn't dream of spamming you or selling your info.

© 2025 ChartExpo, all rights reserved.