• Home
  • Tools dropdown img
    • Spreadsheet Charts

      • ChartExpo for Google Sheets
      • ChartExpo for Microsoft Excel
    • Power BI Charts

      • Power BI Custom Visuals by ChartExpo
    • Word Cloud

  • Charts dropdown img
    • Chart Category

      • Bar Charts
      • Circle Graphs
      • Column Charts
      • Combo Charts
      • Comparison Charts
      • Line Graphs
      • PPC Charts
      • Sentiment Analysis Charts
      • Survey Charts
    • Chart Type

      • Box and Whisker Plot
      • Clustered Bar Chart
      • Clustered Column Chart
      • Comparison Bar Chart
      • Control Chart
      • CSAT Survey Bar Chart
      • CSAT Survey Chart
      • Dot Plot Chart
      • Double Bar Graph
      • Funnel Chart
      • Gauge Chart
      • Likert Scale Chart
      • Matrix Chart
      • Multi Axis Line Chart
      • Overlapping Bar Chart
      • Pareto Chart
      • Radar Chart
      • Radial Bar Chart
      • Sankey Diagram
      • Scatter Plot Chart
      • Slope Chart
      • Sunburst Chart
      • Tornado Chart
      • Waterfall Chart
      • Word Cloud
    • Google Sheets
      Microsoft Excel
  • Services
  • Pricing
  • Contact us
  • Blog
  • Support dropdown img
      • Gallery
      • Videos
      • Contact us
      • FAQs
      • Resources
    • Please feel free to contact us

      atsupport@chartexpo.com

Categories
All Data Visualizations Data Analytics Surveys
Add-ons/
  • Google Sheets
  • Microsoft Excel
  • Power BI
All Data Visualizations Data Analytics Surveys
Add-ons
  • Google Sheets
  • Microsoft Excel
  • Power BI

We use cookies

This website uses cookies to provide better user experience and user's session management.
By continuing visiting this website you consent the use of these cookies.

Ok

ChartExpo Survey


Home > Blog > Data Analytics

What is a Medical Loss Ratio? A Five Minute Guide

What is a medical loss ratio?

Picture this situation: You visit a healthcare provider for care, and later on, your insurance company pays for the expenses. Have you ever considered the portion of your premium allocated toward medical costs?

What is a Medical Loss Ratio

This is where the medical loss ratio becomes relevant.

What is a medical loss ratio (MLR)? MLR is the portion of premium revenue insurance companies must allocate to healthcare and quality improvement activities. It guarantees that your insurance funds go towards your healthcare benefits rather than just covering administrative expenses and earnings.

Here’s an interesting fact: The ACA requires insurance companies to allocate 80% of premiums towards healthcare and quality enhancement for individual and small group markets. For large group markets, the mandate is 85%. This means that the MLR is a safeguard to prioritize delivering essential health services to policyholders.

So, why is understanding the medical loss ratio important? It explains the effectiveness of your insurance provider in handling premiums to offer optimal healthcare coverage. Awareness of this ratio allows you to make educated choices regarding your health insurance. It also guarantees that the money you have worked hard for is utilized effectively.

Let’s discuss the medical loss ratio further.

Table of Contents:

  1. What is a Medical Loss Ratio?
  2. Why is the Medical Loss Ratio Important?
  3. What are the Medical Loss Ratio Rules?
  4. How to Calculate the Medical Loss Ratio?
  5. What is a Good Medical Loss Ratio?
  6. How to Analyze the Medical Loss Ratio?
  7. Wrap Up

First…

What is a Medical Loss Ratio?

Definition: The Medical Loss Ratio (MLR) is a measure used in the health insurance industry. It represents the percentage of premium revenues spent on clinical services and quality improvement. For example, an MLR of 80% means that 80% of premiums are used for patient care. 20% covers administrative costs and profits.

MLR ensures that insurers put patient care ahead of profits. The Affordable Care Act (ACA) mandates that insurers meet minimum MLR standards of 80% for individual and small group markets, and 85% for large group markets. If insurers don’t meet these thresholds, they must issue rebates to policyholders. This approach is designed to deliver better value and manage healthcare costs. To truly grasp its impact, integrating consumer research and customer experience measures can reveal how these standards shape customer satisfaction and enhance the overall healthcare experience.

Why is the Medical Loss Ratio Important?

The medical loss ratio (MLR) is more than just a number. It’s a crucial part of how health insurance works to benefit you. Here’s why it is important:

  • Consumer protection: The MLR ensures that most of your premium dollars are spent on healthcare. Insurers must allocate a significant portion of premiums to medical care. This protects you from paying high premiums for minimal coverage.
  • Cost control: The MLR acts like a fiscal watchdog, ensuring that insurers allocate a significant portion of premiums directly to patient care. By doing so, it keeps overall healthcare costs in check and prevents insurers from funneling premiums into administrative bloat or profits, which can inflate costs across the board. For those diving into healthcare analytics, understanding the impact of MLR provides crucial insights into how funds are allocated and managed, driving more effective cost control and patient care strategies.
  • Quality improvement: The MLR incentivizes insurers to invest in quality improvement initiatives. These efforts lead to better patient outcomes and more efficient care, ultimately benefiting your health and well-being.
  • Transparency: MLR promotes transparency in the health insurance industry. Insurers must report how they use premium dollars. This makes it easier to understand where your money goes and choose plans that provide good value.
  • Regulatory compliance: MLR standards are mandatory under the Affordable Care Act. Insurers who fail to meet these standards must issue rebates to policyholders. This ensures they adhere to regulations designed to protect you.

What are the Medical Loss Ratio Rules?

Understanding the rules around the medical loss ratio (MLR) is vital. It can give you a clearer picture of how your health insurance premiums are used. Here’s a breakdown of these important rules:

  • MLR thresholds: Insurers are required to spend a minimum percentage of premium revenues on medical care and quality improvement. For individual and small group markets, this threshold is 80%. For large group markets, it’s 85%. This ensures that most of your premium dollars go directly towards your healthcare.
  • MLR Calculation: To calculate MLR, divide the total expenditure on clinical services and quality enhancement by the total premium revenue after deducting specific taxes and fees. This calculation needs to adhere to specific guidelines to guarantee precision and impartiality.
  • Reporting requirements: Insurers are obligated to annually submit their MLR data to the Centers for Medicare & Medicaid Services (CMS). This report provides in-depth details on the allocation of premium revenues, promoting transparency and accountability.
  • Rebates: Rebates must be provided to policyholders by insurers that do not meet the MLR thresholds. These discounts guarantee that customers receive good value for the money they spend on insurance. For example, let’s say an insurance company uses only 75% of the premiums towards healthcare in the individual market. The difference needs to be rebated to reach 80%.
  • Exemptions and adjustments: There are certain exemptions and adjustments to the MLR rules. For example, new health plans can be exempt from MLR requirements for a limited time. Additionally, states can request adjustments to the MLR thresholds. That is if they can demonstrate that meeting the standard would destabilize their insurance market.

How to Calculate the Medical Loss Ratio?

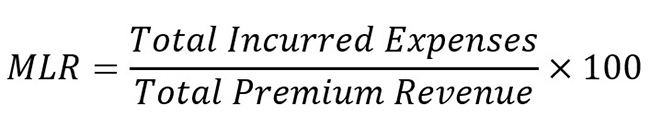
To calculate the Medical Loss Ratio (MLR), follow these steps:

  1. Collect financial data: Start by obtaining the insurance company’s financial records or MLR report. This treasure trove reveals detailed insights into premiums, medical claims, and expenses allocated for quality improvement over a specific period. For those diving into financial reports for companies, this information is gold, offering a clear picture of how resources are distributed and ensuring transparency and efficiency in managing healthcare costs.
  2. Identify relevant expenses:
    • Medical claims: Total sum of money paid by the insurance company for medical services and payments to healthcare providers.
    • Quality improvement expenses: Explore the costs tied to initiatives aimed at boosting healthcare quality, such as disease management programs, preventive care campaigns, and patient education efforts. These investments are crucial for improving patient outcomes and satisfaction. For a deeper understanding, integrate insights from a patient satisfaction survey in healthcare, which can highlight the effectiveness of these quality-enhancing strategies and reveal areas for further improvement.
  1. Determine total incurred expenses: Sum the period’s medical claims and quality improvement expenses.
  2. Calculate total premium revenue: Determine the total premium revenue received by the insurer for the same period.
  3. Calculate MLR: Use the medical loss ratio formula below:
What is a Medical Loss Ratio Formula
  1. Interpret the result: The calculated MLR signifies the proportion of premium income used for medical claims and activities to improve quality. Assess if the insurer meets compliance requirements by comparing the MLR to regulatory thresholds.

What is a Good Medical Loss Ratio?

A good medical loss ratio (MLR) is determined by regulations and norms within the industry. In the US, health insurance companies under ACA must maintain a minimum MLR of 80% for individual and small group markets. For large group markets, they must maintain a minimum of 85%. Achieving or surpassing these benchmarks is typically viewed positively. Why? It shows that much of the premium revenue goes toward medical care and quality improvement efforts.

Yet, what constitutes a “good” MLR can differ depending on variables like:

  • The insurer’s business model
  • Market conditions
  • Specific circumstances

Sometimes, an insurer’s MLR can exceed the regulatory threshold. This may signal that they are making a significant investment in healthcare services and quality enhancement. It could be seen as a positive by policyholders and regulators.

In the end, the effectiveness of an MLR relies on multiple factors. Therefore, it is crucial to consider the wider context when evaluating its importance.

How to Analyze the Medical Loss Ratio?

Are you struggling to make sense of heaps of medical loss ratio data? Join the club. Analyzing complex data with Pyramid charts can feel like decoding a cryptic message.

What about Excel? While great for numbers, it falls short in turning data into engaging visuals that tell a story.

But fear not. ChartExpo is your ally in transforming mundane data into captivating visual storytelling. With ChartExpo, you can bid farewell to dull Excel charts and embrace a new era of dynamic, insightful data visualizations.

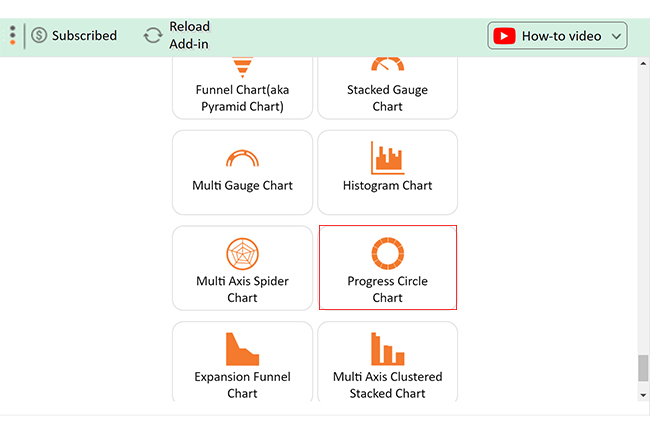
Let’s learn how to install ChartExpo in Excel.

  1. Open your Excel application.
  2. Open the worksheet and click the “Insert” menu.
  3. You’ll see the “My Apps” option.
  4. In the Office Add-ins window, click “Store” and search for ChartExpo on my Apps Store.
  5. Click the “Add” button to install ChartExpo in your Excel.

ChartExpo charts are available both in Google Sheets and Microsoft Excel. Please use the following CTAs to install the tool of your choice and create beautiful visualizations with a few clicks in your favorite tool.

Example

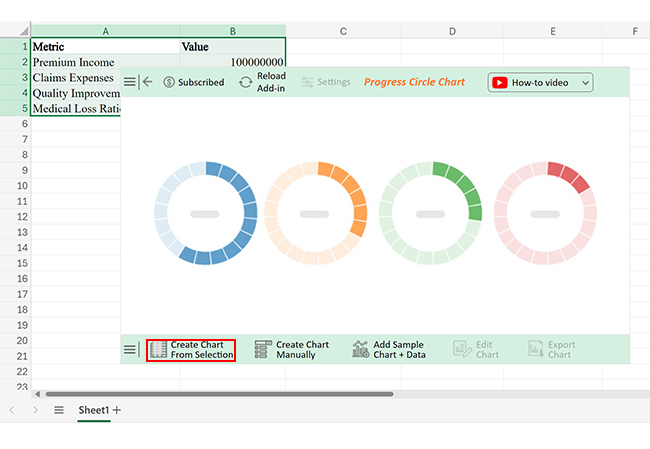
Let’s analyze the medical loss ratio data below using ChartExpo.
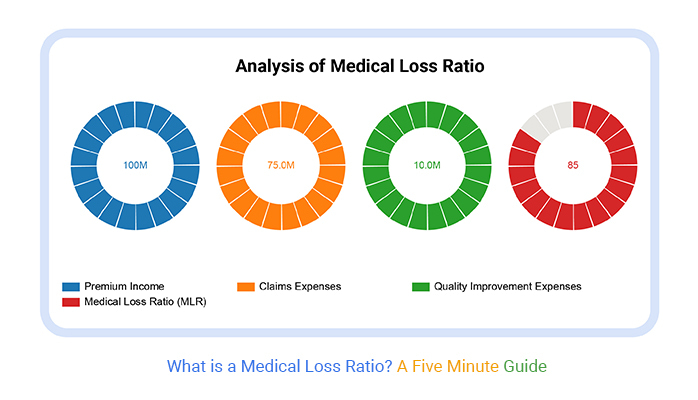
Metric Value
Premium Income 100000000
Claims Expenses 75000000
Quality Improvement Expenses 10000000
Medical Loss Ratio (MLR) 85
  • To get started with ChartExpo, install ChartExpo in Excel.
  • Now Click on My Apps from the INSERT menu.
insert chartexpo in excel
  • Choose ChartExpo from My Apps, then click Insert.
open chartexpo in excel
  • Once it loads, scroll through the charts list to locate and choose the “Progress Circle Chart”.
search Progress Circle Chart in Excel
  • Click the “Create Chart From Selection” button after selecting the data from the sheet, as shown.
Click Create Chart From Selection After Learning What is a Medical Loss Ratio
  • ChartExpo will generate the visualization below for you.
Click Edit Chart After Learning What is a Medical Loss Ratio
  • If you want to add anything to the chart, click the Edit Chart button:
  • You can add the dollar sign with (Premium Income, Claims Expenses, Quality Improvement Expenses) values:
Add Prefix in Chart After Learning What is a Medical Loss Ratio
  • You can add the percentage sign with the Medical Loss Ratio:
Add Postfix in Chart After Learning What is a Medical Loss Ratio
  • Click the pencil icon next to the Chart Header to change the title.
  • It will open the properties dialog. Under the Text section, you can add a heading in Line 1 and enable Show.
  • Give the appropriate title of your chart and click the Apply button.
Add Chart Header in Chart After Learning What is a Medical Loss Ratio
  • Click the “Save Changes” button to persist the changes made to the chart.
Click Save Changes of Chart After Learning What is a Medical Loss Ratio
  • Your final Progress Circle Chart will look like the one below.
Final What is a Medical Loss Ratio

Insights

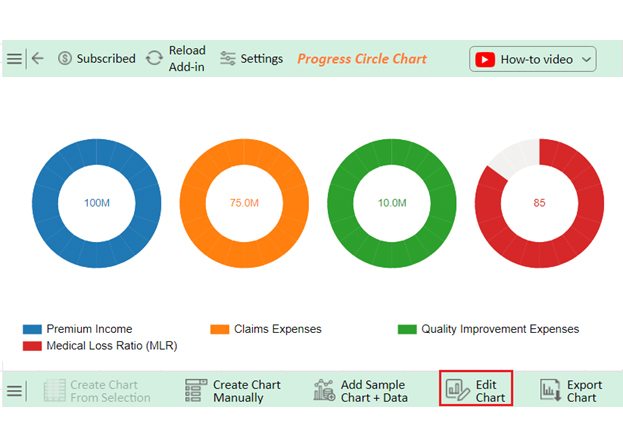
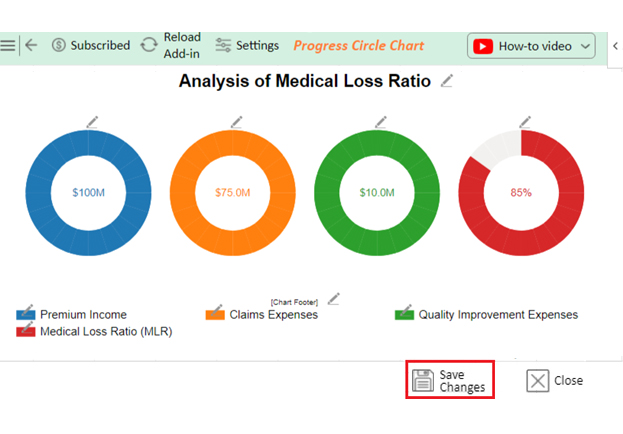
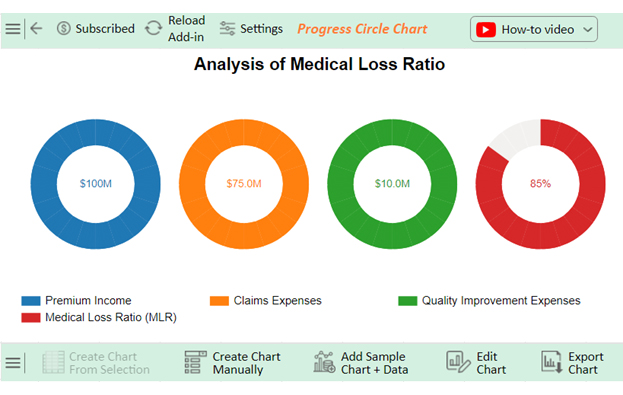
The MLR stands at 85%, showing that 85% of premium revenue goes towards claims and improving quality. This indicates effective utilization of funds while adhering to standard regulatory requirements for insurer performance.

FAQs

What is the medical loss ratio KPI?

The medical loss ratio (MLR) KPI measures the percentage of premium revenues spent on medical care and quality improvements. It ensures insurers allocate funds primarily for patient care, maintaining value for policyholders and compliance with regulatory standards.

What is the ideal medical loss ratio (MLR)?

The ideal MLR is 80% for individual and small group markets and 85% for large group markets. These benchmarks ensure insurers spend a significant portion of premiums on medical care and quality improvement.

Wrap Up

The medical loss ratio (MLR) is a key measure in the health insurance industry. It determines the percentage of premium revenue spent on patient care and quality improvement. This ratio is crucial for ensuring your premiums are used effectively.

MLR rules set specific thresholds. For individual and small group markets, insurers must spend at least 80% of premiums on healthcare. For large group markets, this threshold is 85%. These standards help prioritize patient care over administrative costs and profits.

To calculate MLR, you divide the funds spent on clinical services and quality improvement by the total premium revenue minus certain taxes and fees. This precise calculation ensures fairness and accuracy. Insurers must report this data annually, promoting transparency.

If insurers fail to meet these thresholds, they must provide rebates to policyholders. These rebates ensure consumers receive value for their premiums. For example, if an insurer’s MLR is 75% in the individual market, they must rebate the difference to reach 80%.

There are some exemptions and adjustments to MLR rules. New health plans may be exempt for a limited time. States can request adjustments to prevent market destabilization. These provisions offer flexibility while maintaining consumer protection.

In conclusion, the MLR is vital for safeguarding your healthcare dollars. It ensures a significant portion of premiums is spent on medical care and quality improvement. Understanding MLR rules, calculations, and thresholds helps you make informed choices and get the most from your health insurance.

How much did you enjoy this article?

PBIAd1
Start Free Trial!
136890

Related articles

next previous
Data Analytics29 min read

Variance Analysis Isn’t a Math Problem, It’s a Trust Problem

Variance analysis helps identify what went wrong, who owns it, and what to do next. Use it to drive decisions, not just reports. Learn more!

Data Analytics10 min read

Supplier Comparison Template: Download It Now

A supplier comparison template streamlines vendor evaluation by comparing cost and quality. Click here to learn its benefits and how to analyze them.

Data Analytics32 min read

Ecommerce Analytics: How to Fix What It Often Gets Wrong

Ecommerce analytics often lead to mixed signals and costly misreads. Fix attribution gaps, align teams, and act on the right data. Get started now!

Data Analytics30 min read

When Sales Funnel Breaks: Failures, Fixes, & Funnel Debt

Is your sales funnel hiding costly gaps? Learn how pipeline stalls, false metrics, and handoff chaos could be draining revenue. Get started now!

Data Analytics9 min read

Procurement Key Performance Indicators for Quick Insights

Procurement Key Performance Indicators track costs, efficiency, and supplier reliability. Learn to use these KPIs effectively, their importance, and examples.

ChartExpo logo

Turn Data into Visual
Stories

CHARTEXPO

  • Home
  • Gallery
  • Videos
  • Services
  • Pricing
  • Contact us
  • FAQs
  • Privacy policy
  • Terms of Service
  • Sitemap

TOOLS

  • ChartExpo for Google Sheets
  • ChartExpo for Microsoft Excel
  • Power BI Custom Visuals by ChartExpo
  • Word Cloud

CATEGORIES

  • Bar Charts
  • Circle Graphs
  • Column Charts
  • Combo Charts
  • Comparison Charts
  • Line Graphs
  • PPC Charts
  • Sentiment Analysis Charts
  • Survey Charts

TOP CHARTS

  • Sankey Diagram
  • Likert Scale Chart
  • Comparison Bar Chart
  • Pareto Chart
  • Funnel Chart
  • Gauge Chart
  • Radar Chart
  • Radial Bar Chart
  • Sunburst Chart
  • see more
  • Scatter Plot Chart
  • CSAT Survey Bar Chart
  • CSAT Survey Chart
  • Dot Plot Chart
  • Double Bar Graph
  • Matrix Chart
  • Multi Axis Line Chart
  • Overlapping Bar Chart
  • Control Chart
  • Slope Chart
  • Clustered Bar Chart
  • Clustered Column Chart
  • Box and Whisker Plot
  • Tornado Chart
  • Waterfall Chart
  • Word Cloud
  • see less

RESOURCES

  • Blog
  • Resources
  • YouTube
SIGN UP FOR UPDATES

We wouldn't dream of spamming you or selling your info.

© 2025 ChartExpo, all rights reserved.