Categories
Is your business ready to tune in to the symphony of customer opinions?
It’s time to tap into the power of Voice of Customer (VoC) examples for valuable business insights.
The Voice of the Customer (VoC) is more than just a whisper. It’s a roaring thunder of insights waiting to strike lightning on your decision-making process.


Imagine uncovering that one feature your customers have been longing for. Or identifying a pain point that has been plaguing them for ages. With VoC program, you can unlock a treasure trove of information to drive innovation, enhance the experience, and increase loyalty.
From glowing testimonials to constructive criticisms, the VoC program provides direct communication with your target audience. Moreover, it offers real-time feedback, allowing you to adapt and evolve your strategies to meet changing customer needs.
So, why rely on guesswork when you can have concrete insights directly from the source?
Embrace the power of the VoC program and watch your business thrive.
Let me show you how.
Definition: Voice of Customer (VoC) is the process of collecting, analyzing, and acting on customer feedback to understand their needs, expectations, and experiences. Businesses use VoC programs to capture insights from surveys, reviews, social media, interviews, and support interactions.
By turning this feedback into actionable insights, companies can improve products, services, and customer experience (CX). A well-structured VoC strategy helps organizations build stronger customer relationships, reduce churn, and make data-driven decisions tailored to specific markets and regions.
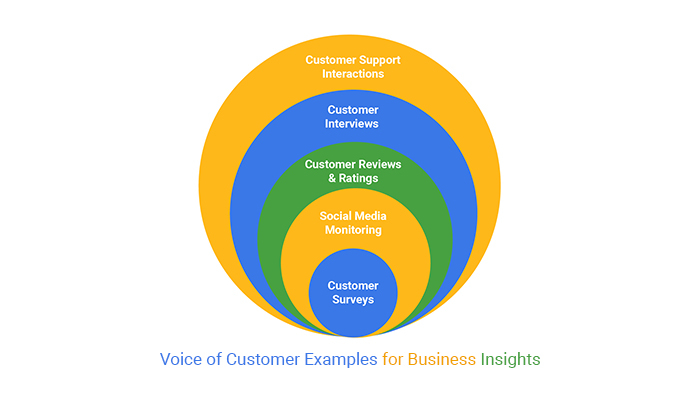
The Voice of the Customer (VoC) helps businesses understand what customers really think and feel. By capturing feedback and turning it into insights, brands can improve products, services, and customer experiences. Here are 7 of the best examples of how companies use VoC effectively:
Surveys are one of the most common VoC tools. Businesses use them to measure satisfaction, gather feedback on new features, or assess customer needs.
Monitoring platforms like Google, Yelp, or Trustpilot help companies understand public perception and identify improvement areas.
Tracking mentions, comments, and messages on social media provides real-time insights into customer sentiment and expectations.
One-on-one interviews give deeper, qualitative insights into customer motivations, challenges, and preferences.
Analyzing customer complaints, questions, and requests from service teams reveals recurring pain points and opportunities for improvement.
Tracking user journeys, click patterns, and bounce rates shows what customers find valuable or frustrating on digital platforms.
NPS surveys measure customer loyalty by asking how likely they are to recommend a brand. This highlights brand advocates and areas needing attention.
The Voice of Customer (VoC) process is a structured approach to gathering and acting on customer feedback. It typically follows these steps:
Use surveys, interviews, reviews, social media, and support calls to capture customer opinions and experiences.
Clean, categorize, and study the feedback to identify trends, recurring themes, and key issues.
Translate the analysis into clear findings about customer needs, pain points, and expectations.
Apply insights to improve products, services, and customer interactions across different touchpoints.
Continuously track feedback over time to measure impact, close gaps, and adjust strategies as customer needs evolve.
Voice of the Customer (VoC) is collected through multiple feedback channels:
Ready to unleash the magic hidden within the symphony of customer feedback?
Excel and ChartExpo are your ultimate duet partners.
Say goodbye to the cacophony of raw numbers and hello to the enchanting data visualizations that dazzle your stakeholders. This dynamic duo will transform your data into an awe-inspiring melody of customer insights.
Analyzing VoC survey data has never been this captivating.
Benefits of Using ChartExpo
How to Install ChartExpo in Excel?
ChartExpo charts are available both in Google Sheets and Microsoft Excel. Please use the following CTA’s to install the tool of your choice and create beautiful visualizations in a few clicks in your favorite tool.
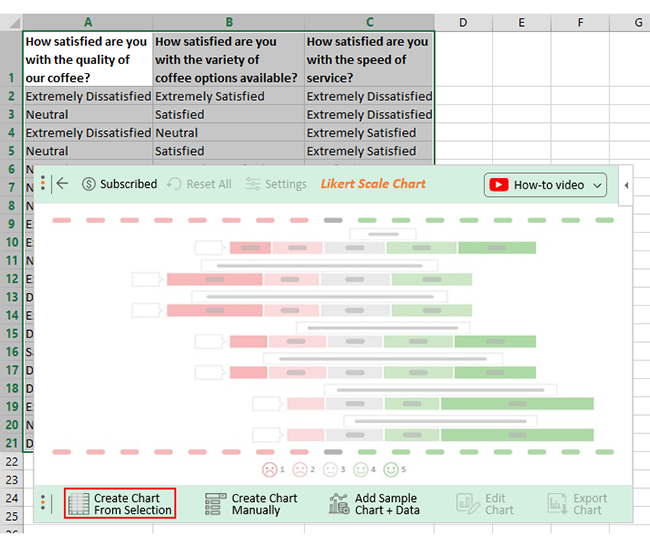
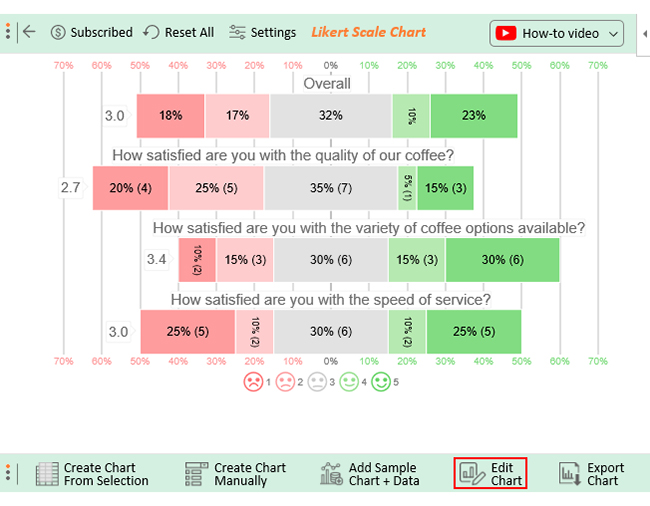
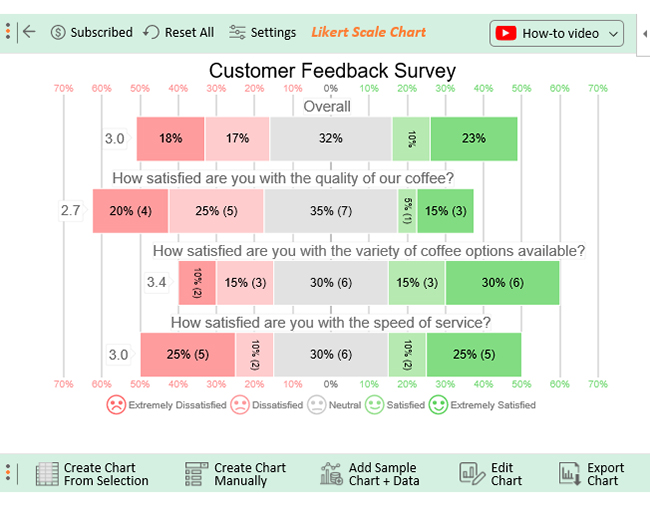
Let’s say you want to conduct a Voice of the Customer survey with the following questions.
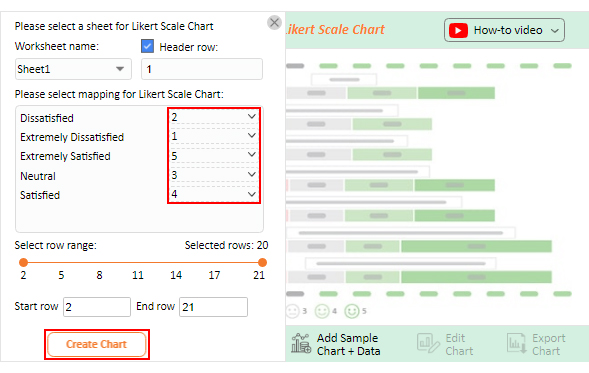
You have mapped the response scale below on each question:
Upon conducting the survey, assume you get the data table below.
| How satisfied are you with the quality of our coffee? | How satisfied are you with the variety of coffee options available? | How satisfied are you with the speed of service? |
| Extremely Dissatisfied | Extremely Satisfied | Extremely Dissatisfied |
| Neutral | Satisfied | Extremely Dissatisfied |
| Extremely Dissatisfied | Neutral | Extremely Satisfied |
| Neutral | Satisfied | Extremely Satisfied |
| Neutral | Extremely Satisfied | Satisfied |
| Neutral | Neutral | Dissatisfied |
| Neutral | Dissatisfied | Extremely Satisfied |
| Extremely Satisfied | Extremely Dissatisfied | Neutral |
| Extremely Dissatisfied | Dissatisfied | Neutral |
| Neutral | Satisfied | Neutral |
| Extremely Satisfied | Neutral | Extremely Satisfied |
| Dissatisfied | Extremely Satisfied | Dissatisfied |
| Extremely Satisfied | Extremely Satisfied | Neutral |
| Dissatisfied | Dissatisfied | Extremely Dissatisfied |
| Satisfied | Neutral | Satisfied |
| Dissatisfied | Extremely Dissatisfied | Neutral |
| Dissatisfied | Neutral | Neutral |
| Extremely Dissatisfied | Extremely Satisfied | Extremely Dissatisfied |
| Neutral | Neutral | Extremely Satisfied |
| Dissatisfied | Extremely Satisfied | Extremely Dissatisfied |
This table contains example data. Expect many responses and questions in real life.


VoC tools collect feedback from multiple channels—surveys, social media, reviews, and support tickets—giving businesses a single view of customer sentiment.
By analyzing real-time feedback, companies can quickly identify pain points and improve products, services, or processes to meet customer needs.
VoC tools provide actionable analytics that help teams make informed decisions about product development, marketing strategies, and customer support.
Responding to feedback makes customers feel heard and valued, strengthening relationships and encouraging repeat business.
Businesses that act on customer insights can stay ahead of competitors by delivering better experiences and anticipating market trends.
Relying on just one source limits insights. Use surveys, interviews, social media, and support interactions to capture a complete customer perspective.
VoC is only valuable when businesses act on it. Prioritize feedback, address recurring issues, and turn insights into measurable improvements.
Always let customers know their input was heard. Acknowledging feedback builds trust and strengthens relationships.
Incorporate customer feedback into product development, service design, and marketing strategies to align business goals with customer needs.
Customer expectations evolve. Keep measuring, analyzing, and updating VoC programs to stay aligned with changing preferences.
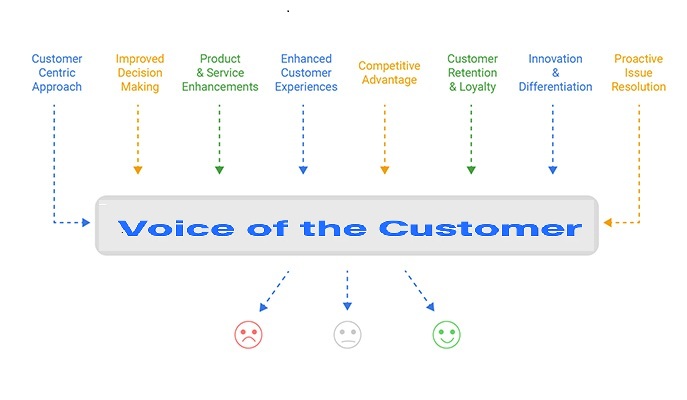
Increasing customer retention requires businesses to truly understand their customers, and Voice of Customer (VoC) techniques make that possible. By gathering and analyzing feedback, companies can identify pain points early and resolve issues before they cause customers to leave.
VoC insights also allow businesses to personalize experiences, whether through tailored communication, customized offers, or improved services, which makes customers feel valued and understood.
When customers see that their feedback leads to real changes, it builds trust and strengthens relationships. Additionally, VoC helps in enhancing product and service quality by ensuring updates align with customer expectations.
With proactive support and data-driven retention strategies powered by VoC, businesses can improve loyalty, reduce churn, and create long-term satisfied customers.
The Voice of the Customer (VoC) means collecting and understanding customer feedback, expectations, and preferences to improve products, services, and overall experiences. It helps businesses align decisions with what customers truly need.
Identifying the Voice of the Customer program involves actively listening to customer feedback. This is through surveys, reviews, social media, interviews, and support interactions. Analyzing and understanding their sentiments, preferences, and pain points provides valuable insights to improve products and services. Consequently, enhances customer experiences.
Quality Voice of the Customer is feedback that is accurate, unbiased, and representative of the customer’s true sentiments. It provides actionable insights for making informed decisions, driving improvements, and delivering exceptional customer experiences.
A Voice of Customer (VoC) report compiles and presents customer feedback, opinions, and preferences. It comprehensively analyzes customer sentiments, helping you understand and respond to customer needs effectively.
VoC is an invaluable resource for businesses seeking to navigate the ever-changing landscape of customer needs. The insights gained illuminate the path to enhanced products, services, and customer experiences.
Leveraging the VoC program examples above empowers you to make data-driven decisions and create exceptional customer experiences. Consequently, ensure a harmonious relationship between your brand and its customers.
Surveys reveal customer preferences and attitudes as social media monitoring captures real-time sentiments. In addition, customer reviews provide authentic feedback, with interviews and focus groups offering an in-depth understanding. And finally, customer support interactions reflect satisfaction levels.
Moreover, VoC can help you orchestrate strategies that resonate with your audience and strike a chord of loyalty. Then conduct symphonies of success that echo for years to come.
ChartExpo transforms the symphony of customer feedback into mesmerizing charts. As a result, it helps you effortlessly unravel patterns and trends once hidden in the data’s melody.
Do not hesitate.
Embrace VoC and ChartExpo and watch your customers take center stage in shaping your business triumphs.
Net Promoter, NPS, NPS Prism, and many other terms related to NPS are registered trademarks of Bain & Company Inc., Satmetrix Systems Inc., and Fred Reichheld.
How much did you enjoy this article?


Google Forms to Google Sheets keeps your data organized and current with every submission. Learn the steps, methods, and tips now!

Product survey questions reveal what customers truly think. Learn how to ask the right ones and act on the survey results. Read on!

Learn how the 5-Point Performance Rating Scale improves employee evaluations with clear, consistent, and fair performance reviews across teams.


