• Home
  • Tools dropdown img
    • Spreadsheet Charts

      • ChartExpo for Google Sheets
      • ChartExpo for Microsoft Excel
    • Power BI Charts

      • Power BI Custom Visuals by ChartExpo
    • Word Cloud

  • Charts dropdown img
    • Chart Category

      • Bar Charts
      • Circle Graphs
      • Column Charts
      • Combo Charts
      • Comparison Charts
      • Line Graphs
      • PPC Charts
      • Sentiment Analysis Charts
      • Survey Charts
    • Chart Type

      • Box and Whisker Plot
      • Clustered Bar Chart
      • Clustered Column Chart
      • Comparison Bar Chart
      • Control Chart
      • CSAT Survey Bar Chart
      • CSAT Survey Chart
      • Dot Plot Chart
      • Double Bar Graph
      • Funnel Chart
      • Gauge Chart
      • Likert Scale Chart
      • Matrix Chart
      • Multi Axis Line Chart
      • Overlapping Bar Chart
      • Pareto Chart
      • Radar Chart
      • Radial Bar Chart
      • Sankey Diagram
      • Scatter Plot Chart
      • Slope Chart
      • Sunburst Chart
      • Tornado Chart
      • Waterfall Chart
      • Word Cloud
    • Google Sheets
      Microsoft Excel
  • Services
  • Pricing
  • Contact us
  • Blog
  • Support dropdown img
      • Gallery
      • Videos
      • Contact us
      • FAQs
      • Resources
    • Please feel free to contact us

      atsupport@chartexpo.com

Categories
All Data Visualizations Data Analytics Surveys
Add-ons/
  • Google Sheets
  • Microsoft Excel
  • Power BI
All Data Visualizations Data Analytics Surveys
Add-ons
  • Google Sheets
  • Microsoft Excel
  • Power BI

We use cookies

This website uses cookies to provide better user experience and user's session management.
By continuing visiting this website you consent the use of these cookies.

Ok

ChartExpo Survey


Home > Blog > Data Visualization

Viz of the Day: Key Insights at a Glance for Faster Decisions

Viz of the Day: could a simple chart change how we understand the forces shaping our lives? Sure, it can. Imagine a single number deciding who gets a life-saving organ transplant first.

Viz of the Day

Now pause. What story does that number hold?

Numbers surround us. On average, people generate 1.7 megabytes of data every second. By 2026, experts estimate that global data creation will exceed 221 zettabytes. That is so vast, it is nearly impossible to picture. Yet buried inside are truths that affect health, money, climate, and opportunity.

But raw numbers alone rarely move people. A million data points can vanish into information overload. What cuts through the noise? A map showing air quality. A bar chart of school graduation rates. Or a timeline of rising costs. These visuals tell a story faster than paragraphs ever could. And that’s the magic of data storytelling. It turns statistics into narratives that the human brain is wired to remember.

Viz of the Day does more than display figures. It demonstrates how a single image can shift perspective. It also reminds us of the best tools for data visualization available to anyone curious enough to explore. Whether you’re a policymaker or a student, the right visual can change how you see the ordinary.

So the next time you scroll past a chart, pause. Ask what the picture is saying beyond the numbers. Because sometimes the smallest data point, shown the right way, holds extraordinary power.

This topic is vast. Continue reading to gain a better understanding.

First…

Table of Contents:

  1. What is Viz of the Day?
  2. Why is Viz of the Day Important?
  3. How is Viz of the Day Selected?
  4. Examples of Successful Viz of the Day Designs
  5. Tools Commonly Used for Viz of the Day Creations
  6. How to Create a Viz of the Day in Excel?
  7. Benefits of Visuals of the Day
  8. Best Practices for Designing Viz of the Day
  9. Limitations and Challenges for Viz of the Day
  10. FAQs
  11. Wrap Up

What is Viz of the Day?

Definition: Viz of the Day is a daily spotlight on how numbers transform into meaning. It highlights one visual that makes complex data easy to grasp. Each feature shows how information can be shaped into insight.

The aim is to inspire fresh ways of thinking. It proves that a single chart can tell a bigger story. Viz of the Day also encourages people to practice data visualization in their own work. From public health to sports, the themes are diverse. But the focus remains simple: Show the story, share the impact, and help people see more through the power of visuals.

Why is Viz of the Day Important?

Have you noticed how a simple chart can sometimes stop you mid-scroll? Numbers on a spreadsheet rarely do that. But when data is turned into a striking image, it can shift how we see issues around us. Viz of the Day matters because it proves that visuals are more than decoration. They are powerful tools for clarity, influence, and change.

How?

  • Cuts through information overload: Instead of drowning in endless spreadsheets, Viz of the Day highlights one clear message. This makes data approachable, giving you a focus on what really matters.
  • Shows impact on the information design: Strong visuals replace confusion with clarity. A chart can reveal in seconds what pages of text cannot.
  • Encourages visual analytics: Patterns and trends become visible faster through visuals. This helps leaders and learners make smarter decisions.
  • Inspires better communication: Each example shows how numbers can become stories. It motivates people to share insights in ways that truly connect.

How is Viz of the Day Selected?

Viz of the Day is not random. Each selection is made with care so the visual speaks louder than numbers alone. It is chosen to inspire, to teach, and to show how data can become a story worth remembering. Here is how the process works:

  • Clarity of message: The chart must explain an idea in seconds. If the audience pauses, the purpose is lost.
  • Design: A good viz uses space, color, and layout wisely. It ensures the eye knows where to look first.
  • Use of data storytelling: The best visuals connect with emotion as well as facts. They turn statistics into narratives that stay with people.
  • Application of visual analytics: Selections often reveal patterns or insights that raw numbers hide. They show the power of data explored visually.
  • Broad relevance: The chosen viz speaks to topics people care about. From health to culture, it highlights data with an impact that extends beyond the chart itself.

Examples of Successful Viz of the Day Designs

Every day, people face choices shaped by numbers. Yet rows of figures rarely move us to act. That is why Viz of the Day highlights visuals that transform raw data into meaning. With the help of a chart maker or a digital dashboard, these charts tell stories that connect instantly.

Here are ten chart types that often rise to the spotlight, each with a lesson in clarity and impact:

  • Example 1: Multi-axis Line Chart

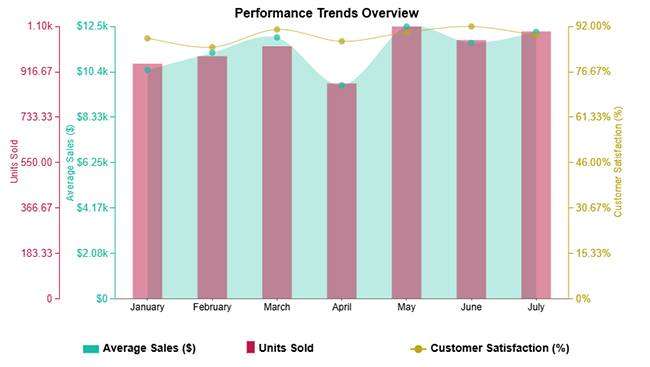
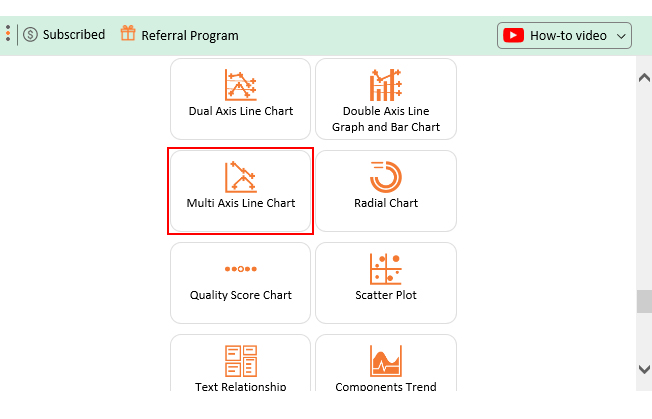
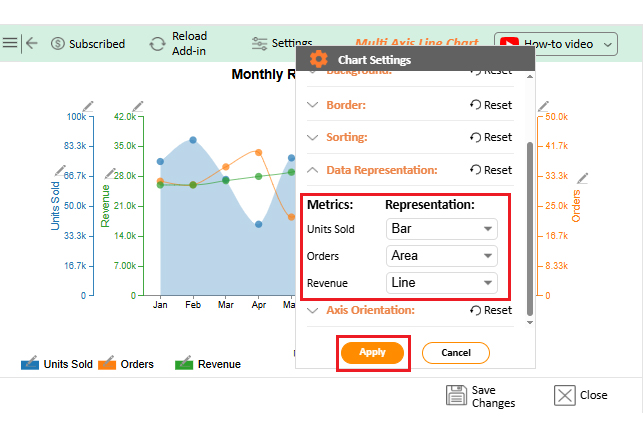
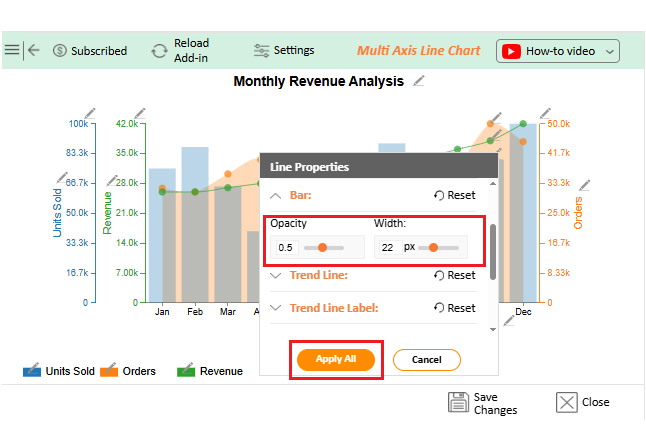
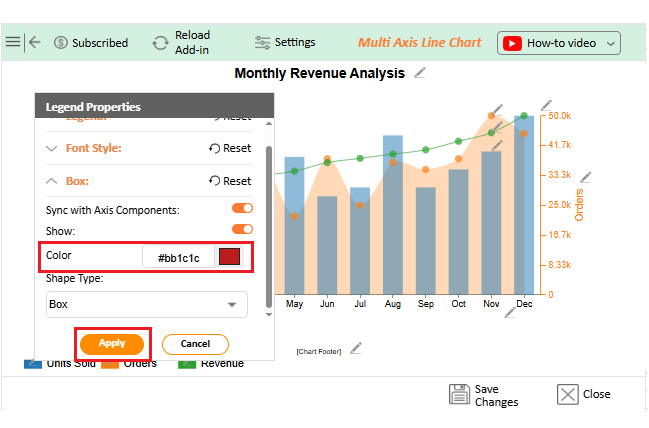
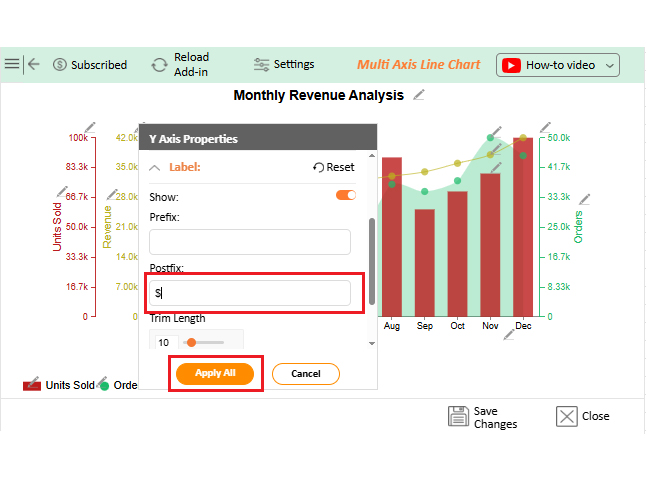
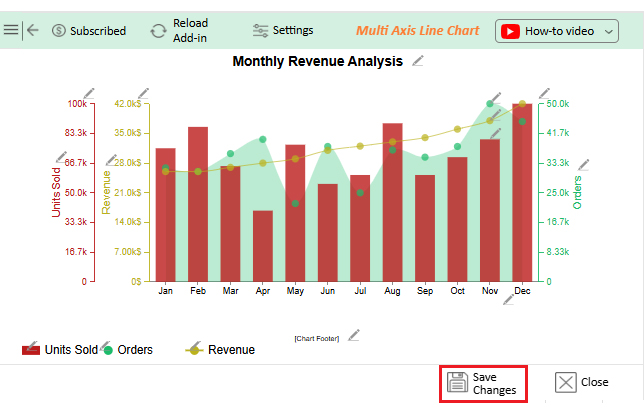
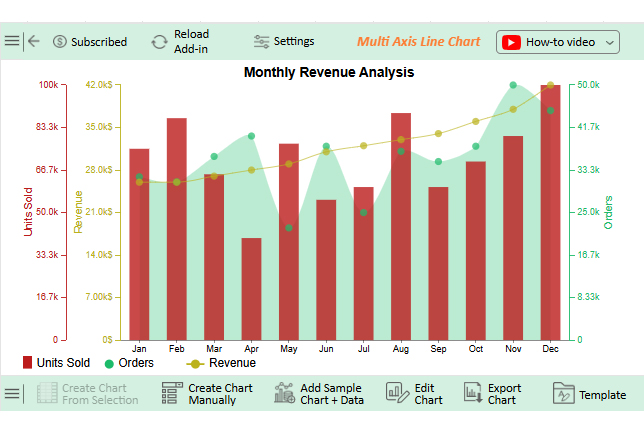
Hospitals often track multiple vitals at once, from heart rate to blood pressure to oxygen levels. A Multi Axis Line Chart lets doctors see these different measures on a single screen. This helps connections that save time and sometimes even lives. Trends that might hide in a table suddenly stand out with clarity.

Viz of the Day
  • Example 2: Comparison Bar Chart

Schools and universities rely heavily on survey results to understand student and parent satisfaction. A Comparison Bar Chart places feedback side by side so differences in opinions are clear at a glance. It helps educators act faster because they know exactly where improvements are needed.

Viz of the Day
  • Example 3: Horizontal Waterfall Chart

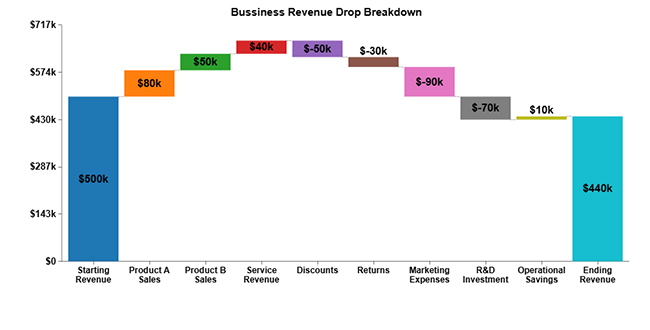
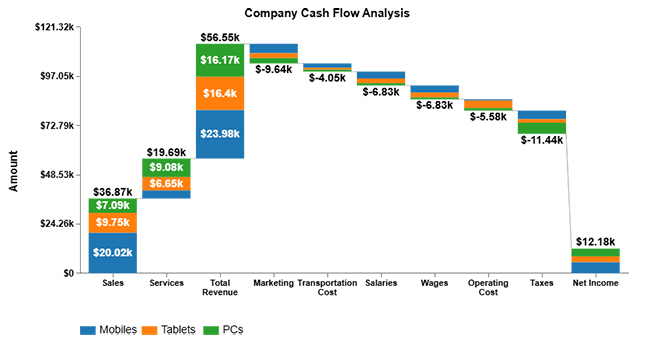
Businesses live and breathe performance numbers. A Horizontal Waterfall Chart is powerful for data analysis. It shows how each factor contributes to the final profit or loss. Marketing spend, staffing costs, or unexpected revenue streams all become visible parts of the story.

Viz of the Day
  • Example 4: Sankey Chart

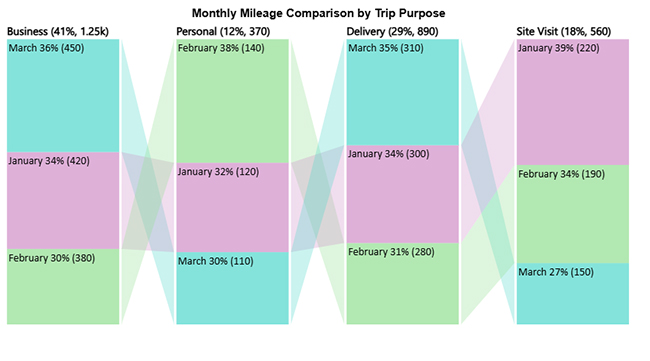
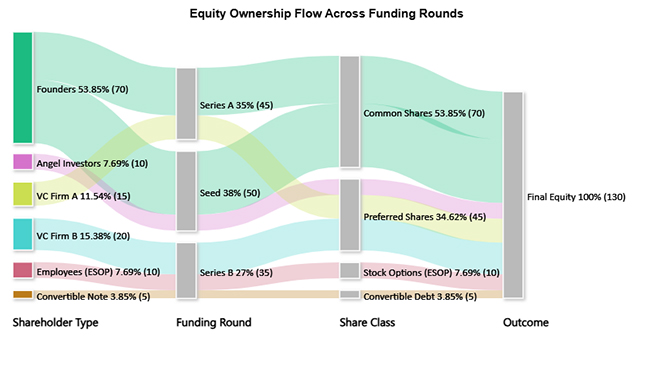
Resource allocation is often messy. A Sankey Chart clears the confusion by showing where resources come from and where they go. Governments use it to illustrate how budgets flow across departments. Nonprofits use it to demonstrate how donations reach specific projects.

Viz of the Day
  • Example 5: Pareto Bar Chart

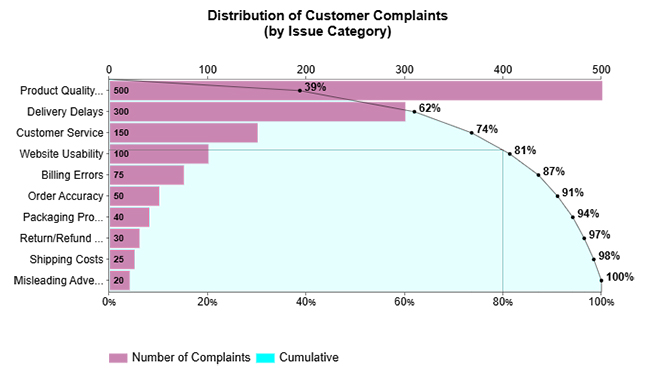
Every organization has a long list of problems, but not all problems matter equally. A Pareto Bar Chart applies the 80/20 principle, highlighting the few factors that drive most of the results. An airline might see that a handful of delays cause the majority of complaints. It points leaders to the issues that matter most.

Viz of the Day
  • Example 6: Waterfall Chart

For finance teams, the Waterfall Chart is a favorite in data analysis in Excel. It breaks down revenues, expenses, and adjustments in a step-by-step manner. Retailers use it to explain how sales promotions, returns, and seasonal peaks affect the final revenue. The path from start to finish becomes easy to follow.

Viz of the Day
  • Example 7: Progress Circle Chart

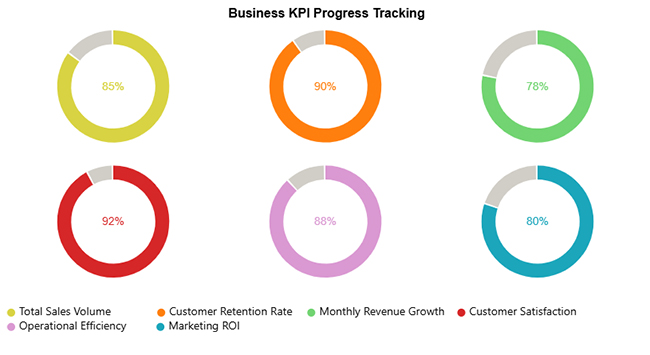
Motivation often comes from seeing progress. A nonprofit fundraising campaign can use a Progress Circle Chart to show how close they are to reaching a goal. Donors see a ring filling up in real time, creating urgency and excitement to give more.

Viz of the Day
  • Example 8: Stacked Waterfall Chart

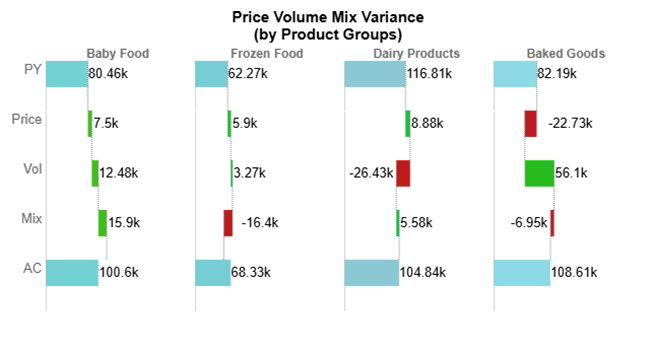
When issues are complex, a Stacked Waterfall Chart adds more detail. A government agency explaining how different programs affect a budget can use this type of chart. Citizens see both the overall outcome and the smaller contributions that make it up, building trust through transparency.

Viz of the Day
  • Example 9: Heatmap

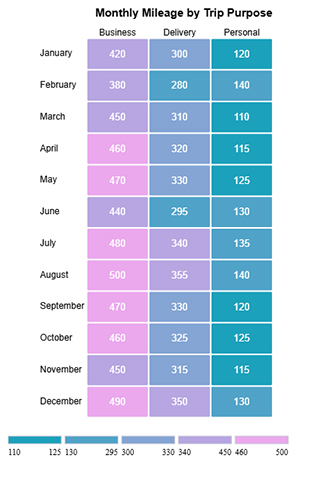
Sports analysts rely on Heatmaps to track player movements or scoring zones. A Heatmap makes strengths and weaknesses visible at a glance with color. Coaches and fans alike can spot patterns that would be buried in match statistics.

Viz of the Day
  • Example 10: Gauge Chart

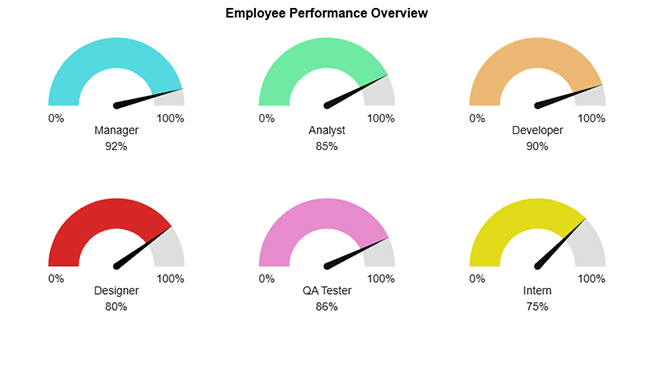
In any modern digital dashboard, the Gauge Chart is a favorite for quick checks. Managers use it to monitor sales goals or employee performance. One glance at the dial shows whether targets are being met or whether urgent action is needed.

Viz of the Day

Tools Commonly Used for Viz of the Day Creations

Creating a Viz of the Day goes beyond just dropping numbers into a chart. The right tool can turn raw data into visuals that tell a story instantly. A well-crafted visual grabs attention, guides the eye, and makes complex information understandable.

The most common tools for these creations include:

  1. Excel: Excel is the classic tool for visual analytics. It is versatile and accessible, making it perfect for creating quick charts, pivot tables, and simple dashboards.
  2. Power BI: Power BI excels in interactive dashboards. It lets users connect multiple data sources and create dynamic reports. This tool has strong information design that helps make insights clear and actionable.
  3. Tableau: Tableau is built for deep exploration and storytelling. It offers drag-and-drop chart building and advanced visualizations. Its focus on visual hierarchy ensures patterns and trends are easy to spot.
  4. ChartExpo: ChartExpo is designed for simplicity and power. It allows users to create complex charts quickly without coding. With AI for data analytics, even large or complicated datasets can be transformed into meaningful visuals in minutes.

How to Create a Viz of the Day in Excel?

A spreadsheet full of figures rarely sparks curiosity. Viz of the Day changes that. It transforms everyday data into visuals, making patterns and insights instantly obvious. Each chart tells a story, reveals a trend, or highlights a surprising fact you might have missed otherwise.

Follow these steps to create an impactful Viz of the Day

  1. Identify the core insight: Focus on one main takeaway so viewers can grasp it quickly.
  2. Select the right chart type: Choose a visual that communicates your message clearly.
  3. Design with simplicity: Keep clutter low, labels readable, and colors effective.
  4. Add context: Use short notes or comparisons to help viewers understand the data.

Why ChartExpo Works for Viz of the Day

ChartExpo allows you to create visuals quickly and beautifully. Unlike traditional tools, it offers ready-made advanced charts inside familiar platforms like Excel and Google Sheets. This enables data to work more smoothly and efficiently.

Here are some reasons why you should use ChartExpo:

  • Build advanced charts without complicated formatting.
  • Work directly in tools you already use.
  • Turn raw data into ready-to-share, engaging visuals.
  • Try it free for seven days or subscribe for just $10 a month.

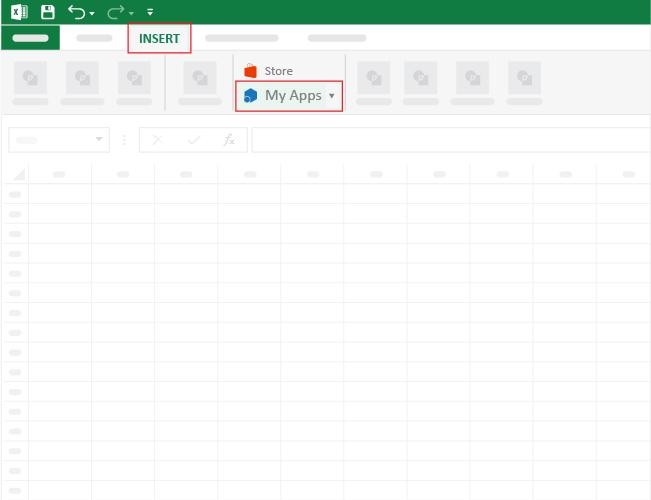
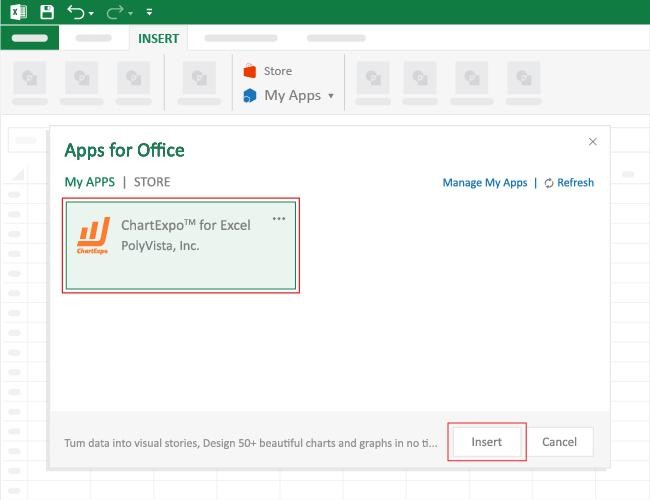
How to Install ChartExpo in Excel?

  1. Open your Excel application.
  2. Open the worksheet and click the “Insert” menu.
  3. You’ll see the “My Apps” option.
  4. In the Office Add-ins window, click “Store” and search for ChartExpo on my Apps Store.
  5. Click the “Add” button to install ChartExpo in your Excel.

ChartExpo charts are available both in Google Sheets and Microsoft Excel. Please use the following CTAs to install the tool of your choice and create beautiful visualizations with a few clicks in your favorite tool.

Example

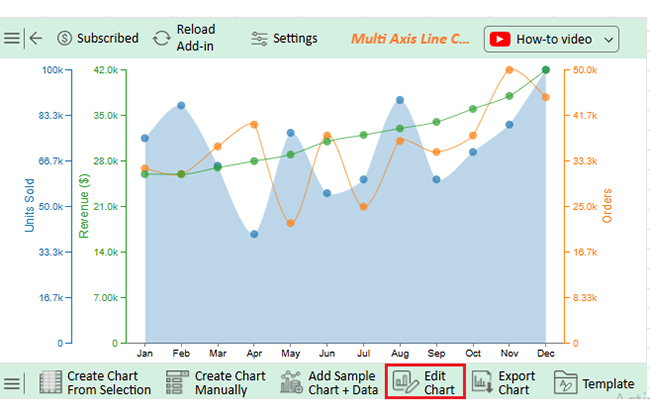
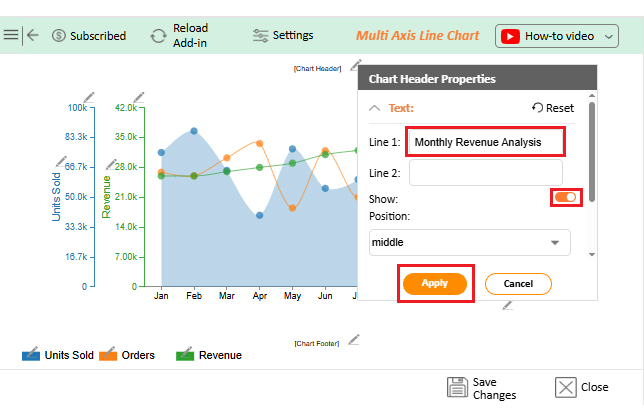
Let’s use the data below to create a Viz of the day in Excel using ChartExpo.

Month

Revenue Orders

Units Sold

Jan 26000 32000 75000
Feb 26000 31000 87000
Mar 27000 36000 65000
Apr 28000 40000 40000
May 29000 22000 77000
Jun 31000 38000 55000
Jul 32000 25000 60000
Aug 33000 37000 89000
Sep 34000 35000 60000
Oct 36000 38000 70000
Nov 38000 50000 80000
Dec 42000 45000 100000
  • To get started with ChartExpo, install ChartExpo in Excel.
  • Now, click on My Apps from the INSERT menu.
Viz of the Day
  • Choose ChartExpo from My Apps, then click Insert.
Viz of the Day
  • Once it loads, scroll through the charts list to locate and choose the “Multi Axis Line Chart”.
Viz of the Day
  • Click the “Create Chart From Selection” button after selecting the data from the sheet, as shown.
Viz of the Day
  • If you want to add anything to the chart, click the Edit Chart button:
Viz of the Day
  • Click the pencil icon next to Chart Header to change the title.
  • It will open the properties dialog. Under the Text section, you can add a heading in Line 1 and enable Show.
  • Give the appropriate title of your chart and click the Apply button.
Viz of the Day
  • Click on Settings and change the “Data Representation” as follows:
Viz of the Day
  • You can change the bars’ Opacity and width.
Viz of the Day
  • You can also change the box appearance by selecting the pencil icon from the chart footer menu. After the Legend Properties window appears, click in the “Box” and select “Circle” from the Shape type. You can add color as well:
Viz of the Day
  • You can add a prefix sign as follows:
Viz of the Day
  • Click the “Save Changes” button to persist the changes made to the chart.
Viz of the Day
  • Your final Multi Axis Line Chart will look like the one below.
Viz of the Day

Key Insights

  • Units sold remained mostly stable, dipping in April and July, then peaking in December.
  • Revenue grew steadily throughout the year, tracking closely with sales.
  • Orders varied mid-year but trended upward toward Q4.
  • Rising revenue and higher orders in Q4 indicate strong year-end performance.

Benefits of Visuals of the Day

Numbers are everywhere, but they often get ignored. Visuals of the Day turn raw data into snapshots that are easy to understand. They make insights clear, spark conversations, and help teams act faster.

How?

  • Daily engagement: Visuals encourage teams to check data regularly. This keeps everyone aware of trends and progress.
  • Knowledge sharing: Clear charts make insights easy to communicate. Teams can grasp key information without long reports.
  • Storytelling culture: Charts turn numbers into stories people remember. This helps employees explain their findings and make decisions with confidence.
  • Metric awareness: Key KPIs and metrics become apparent at a glance. Teams can track performance and address issues quickly.
  • Quick insights: Visuals highlight trends instantly. Decision-makers spend less time digging through raw data and more time acting on it.

Best Practices for Designing Viz of the Day

Creating a Viz of the Day goes beyond just making a chart. It’s about telling a story with data that anyone can understand at a glance. A well-designed visual captures attention, conveys insights quickly, and inspires action.

So, how do you achieve all this? Follow these best practices:

  • Focus on one insight: Highlight a single takeaway to avoid overwhelming viewers. A clear focus ensures the message is memorable.
  • Choose the right chart: Match your data to a chart type that communicates it best. The right visual makes patterns and trends obvious.
  • Keep it simple: Limit clutter, use readable labels, and apply effective colors. Simplicity improves understanding and retention.
  • Add context: Include short annotations or comparisons to clarify the meaning. Context helps viewers interpret the data accurately.
  • Consistency matters: Maintain uniform colors, fonts, and styles across visuals. This builds familiarity and strengthens the dashboard layout, making insights easier to follow and comprehend.

Limitations and Challenges for Viz of the Day

No doubt…Viz of the Day can transform data into insights. But it comes with trade-offs. Understanding some of these challenges will help you create more effective visuals and avoid misinterpretation:

  • Over-simplification: Focusing on one insight per day can hide important details. Some trends may require deeper analysis.
  • Viewer misinterpretation: Without proper context, viewers might draw the wrong conclusions. A single visual can be misleading if not explained.
  • Design challenges: Poor design can confuse rather than clarify. Colors, labels, and layout must be carefully chosen.

FAQs

What is viz in data?

Viz in data means turning numbers into visuals. Charts, graphs, and dashboards help show patterns and trends. They make complex data easier to understand. Insights become clear at a glance, and you can make decisions faster and smarter.

What is text to viz?

Text to Viz is the process of turning written data or descriptions into visuals. It converts text-based information into charts, graphs, or dashboards. This makes patterns and trends easier to see, where insights become clear and quick to understand.

Wrap Up

Numbers surround us every day. They appear in reports, spreadsheets, and dashboards. Most of them go unnoticed, but Viz of the Day changes that. It turns ordinary numbers into visuals that reveal patterns and insights instantly.

The real power lies in data storytelling. A well-designed visual can explain trends, highlight key metrics, and make complex information understandable. Readers can grasp ideas in seconds rather than hours. Each Viz of the Day is a story waiting to be explored.

Daily exposure to charts also combats information overload. Instead of drowning in rows of numbers, viewers focus on one clear insight at a time. This enables faster and more confident decision-making. It also helps teams stay aligned and informed.

Choosing the right tool is essential. The best tools for data visualization simplify chart creation and ensure visuals are accurate and engaging. They help anyone turn raw data into meaningful stories.

ChartExpo is an excellent choice. It works inside familiar platforms like Excel and Google Sheets, where users can create advanced visuals without complex formatting. Even beginners can make charts that communicate clearly.

So, do not hesitate. Start using ChartExpo today. Install it, explore your data, and create your first Viz of the Day. This will transform your everyday numbers into extraordinary insights. Then, you can share them, learn from them, and let your data tell the story it deserves.

How much did you enjoy this article?

PBIAd1
Start Free Trial!
158157

Related articles

next previous
Data Analytics13 min read

Cash Flow Forecasting Template: A Complete Guide

Cash flow forecasting template designed to help businesses monitor liquidity, plan expenses, and prepare for financial changes.

Data Analytics13 min read

Social Media Marketing Plan Template for SMM Success

A template for a social media marketing plan organizes goals and tracking. This blog shows you how to plan, analyze, and report smarter for better results.

Data Analytics12 min read

Cash Flow Analysis Template: A Complete Guide

A cash flow analysis template helps track inflows and outflows with clarity. Discover how Google Sheets and smart tools improve analysis and decision-making.

Data Analytics12 min read

Cap Table Template: Simplifying Equity Analysis

A cap table template tracks ownership and dilution. This blog shows how to create, analyze, and visualize cap tables in Google Sheets for better decisions.

Data Analytics14 min read

Visual Encoding: The Rules That Improve Insights

Visual encoding converts complex data into visuals that are simple to read. It uses color, size, shape, and position to reveal trends, comparisons, and insights.

ChartExpo logo

Turn Data into Visual
Stories

CHARTEXPO

  • Home
  • Gallery
  • Videos
  • Services
  • Pricing
  • Contact us
  • FAQs
  • Privacy policy
  • Terms of Service
  • Sitemap

TOOLS

  • ChartExpo for Google Sheets
  • ChartExpo for Microsoft Excel
  • Power BI Custom Visuals by ChartExpo
  • Word Cloud

CATEGORIES

  • Bar Charts
  • Circle Graphs
  • Column Charts
  • Combo Charts
  • Comparison Charts
  • Line Graphs
  • PPC Charts
  • Sentiment Analysis Charts
  • Survey Charts

TOP CHARTS

  • Sankey Diagram
  • Likert Scale Chart
  • Comparison Bar Chart
  • Pareto Chart
  • Funnel Chart
  • Gauge Chart
  • Radar Chart
  • Radial Bar Chart
  • Sunburst Chart
  • see more
  • Scatter Plot Chart
  • CSAT Survey Bar Chart
  • CSAT Survey Chart
  • Dot Plot Chart
  • Double Bar Graph
  • Matrix Chart
  • Multi Axis Line Chart
  • Overlapping Bar Chart
  • Control Chart
  • Slope Chart
  • Clustered Bar Chart
  • Clustered Column Chart
  • Box and Whisker Plot
  • Tornado Chart
  • Waterfall Chart
  • Word Cloud
  • see less

RESOURCES

  • Blog
  • Resources
  • YouTube
SIGN UP FOR UPDATES

We wouldn't dream of spamming you or selling your info.

© 2026 ChartExpo, all rights reserved.