

Spreadsheets are loyal, but they are not storytellers. Rows of numbers in Excel can bury meaning instead of revealing it. The real spark comes from Excel charts and data visualization, not endless scrolling.
Categories
Visual encoding is shaping the way we understand numbers and patterns more than we realize.


How?
Think about how much data is produced every single day. Colors, shapes, sizes, and positions all play a role in guiding attention. They help us see trends faster than we could ever read from rows of raw numbers.
Picture a hospital tracking patient outcomes with healthcare data visualization. Charts showing recovery rates across treatments can instantly highlight what works best. No long reports. No confusion. Just clarity.
Companies using visual analytics have seen measurable benefits. A Forbes report revealed that data-driven organizations are 23 times more likely to gain customers. And that is the power of presenting information in a form our brains are wired to process. Numbers alone struggle to tell stories, but pictures and structured visuals speak louder.
At its core, visual encoding is about trust. It gives meaning to raw data and facilitates faster data-driven decision-making. Whether you’re analyzing sales or studying travel trends through Airbnb data visualization, the goal is the same. Clear visuals lead to better choices.
So, before you scroll past another confusing table, pause and ask yourself: “Could this have been understood faster through a better visual?”
Let me take you through visual encoding.
Definition: Visual encoding is the method of turning data into shapes, colors, and sizes that people can quickly read. It is the reason a bar chart feels easier to understand than a spreadsheet full of numbers. Effective encoding establishes a clear visual hierarchy, directing the eye to what matters most first. Without it, patterns hide in plain sight.
Think of it as giving numbers a voice. It makes data speak clearly and directly. When paired with information design, visual encoding helps simplify complex findings. It ensures that decisions are based on understanding, not confusion. It is the bridge between numbers and meaning.
Have you ever wondered why a chart can tell a clearer story than a report filled with numbers? That is the magic of visual encoding. It turns raw information into visuals that guide the eye, spark understanding, and build trust.
Here is why it matters so much for data understanding:
Visual encoding transforms raw information into signals our eyes can quickly read, and our minds can interpret. In data visualization, these signals are the difference between confusion and clarity. Every design choice influences how fast someone grasps the story.
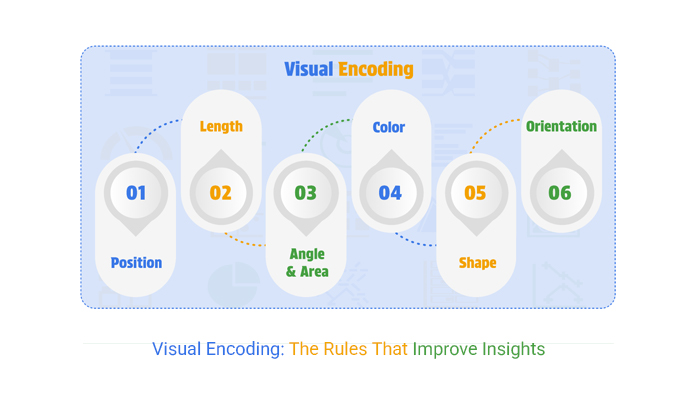
Here are the key types of visual encoding:
A chart can either clear the fog or create more confusion. The difference lies in how visual encoding is handled. Small choices, such as scale, color, or shape, can completely alter interpretation. In a Pareto chart, these decisions are especially critical, as they shape how priorities stand out and determine whether the story is accurate, precise, and meaningful.
Numbers on their own can feel flat. But turn them into visuals and the story starts to breathe. Visual encoding gives data form, texture, and meaning. The choice of chart affects how quickly people understand trends or outliers in data analytics.
Here are three common visuals and their reasons for effectiveness.
Some visuals do the heavy lifting for you. They make data feel simple, approachable, and straightforward. That is the strength of visual encoding. The right choice saves time and reduces errors. Here are examples that show how encoding brings numbers to life:
Think about the last time a chart made sense in seconds. That spark of clarity came from visual encoding. It transforms raw figures into signals that our brains naturally understand.
Here is how it actually works.
Excel handles numbers well, but numbers alone rarely tell a story. ChartExpo fills that gap with visuals that turn raw figures into insights. Through visual encoding, these charts help ensure a more precise analysis. Here are ten strong examples:


That is where visual encoding takes the stage, turning dull data into patterns you can see and act on. Excel alone falls short here. Its charts often lack depth and clarity.
Enter ChartExpo, a tool that fills this gap with more brilliant visuals and strategies. It helps transform raw numbers into insights, making data understanding faster, sharper, and far more engaging.
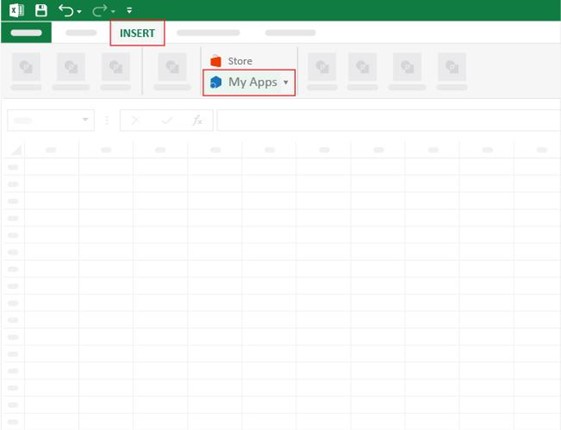
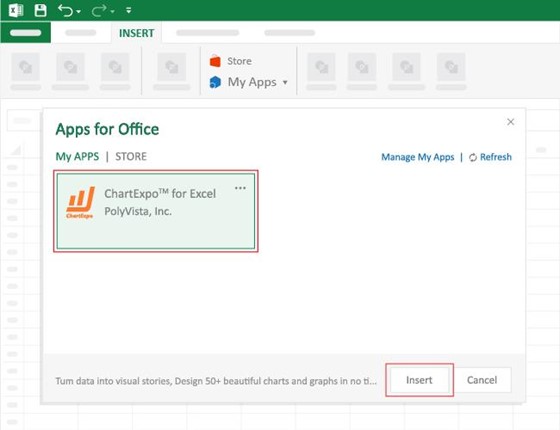
How to Install ChartExpo in Excel?
ChartExpo charts are available both in Google Sheets and Microsoft Excel. Please use the following CTAs to install the tool of your choice and create beautiful visualizations with a few clicks in your favorite tool.
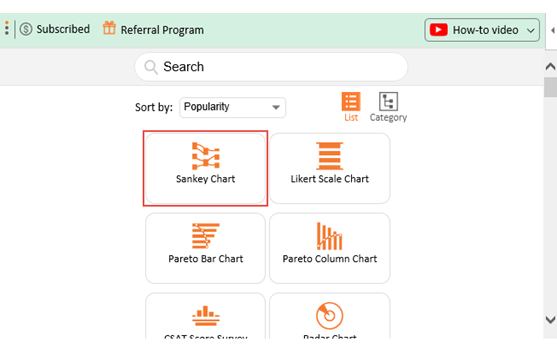
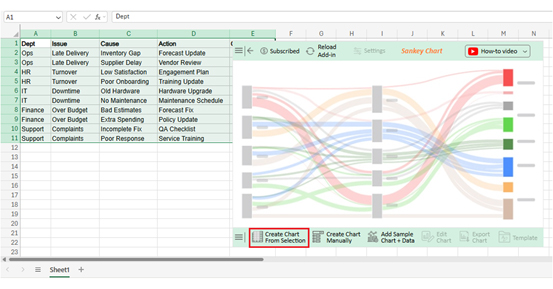
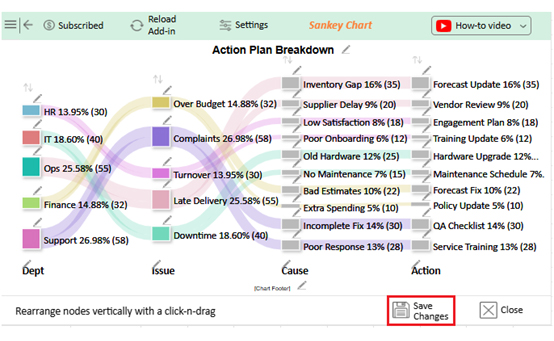
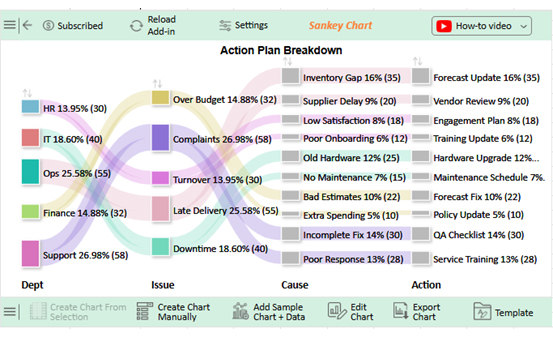
Let’s do visual encoding with the sample data in Excel using ChartExpo and analyze it.
| Dept | Issue | Cause | Action | Count |
| Ops | Late Delivery | Inventory Gap | Forecast Update | 35 |
| Ops | Late Delivery | Supplier Delay | Vendor Review | 20 |
| HR | Turnover | Low Satisfaction | Engagement Plan | 18 |
| HR | Turnover | Poor Onboarding | Training Update | 12 |
| IT | Downtime | Old Hardware | Hardware Upgrade | 25 |
| IT | Downtime | No Maintenance | Maintenance Schedule | 15 |
| Finance | Over Budget | Bad Estimates | Forecast Fix | 22 |
| Finance | Over Budget | Extra Spending | Policy Update | 10 |
| Support | Complaints | Incomplete Fix | QA Checklist | 30 |
| Support | Complaints | Poor Response | Service Training | 28 |
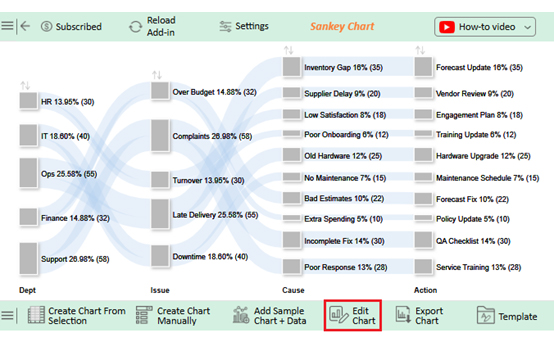

Data speaks, but not everyone speaks data. That is why visual encoding matters. It translates numbers into visuals that our brains process in seconds. Instead of staring at rows of figures, you see trends, patterns, and insights with ease.
In data visualization, encoding is the difference between confusion and clarity. Tools like a ranking chart maker further enhance this by turning complex datasets into clear, structured rankings that are instantly understandable.
Why?
A chart can be powerful, but it is not perfect. Visual encoding gives clarity, yet it also has limits. Poor choices in color, scale, or shape can twist the story. So, keep these key limitations in mind:
Data becomes meaningful only when people can see its story. Visual encoding is what makes that possible. It takes raw numbers and transforms them into shapes, colors, and positions that speak instantly. Its application stretches across industries and use cases.
A chart can tell a story or create confusion. The difference lies in how encoding is handled. Strong strategies in information design sharpen clarity and avoid missteps. Here is how to improve visual communication.
Visual coding in psychology is the process of storing images in the brain. It helps us remember shapes, colors, and patterns. This type of encoding allows people to recall visual details even without words.
Semantic encoding stores meaning, such as understanding words or concepts. Visual encoding stores images, shapes, and colors. Semantic relies on comprehension, while visual depends on mental imagery. Both work together to strengthen memory and recall.
Data does not speak until it is shown in the proper form. That is why visual encoding is so essential. It turns abstract numbers into shapes, colors, and patterns that the mind can understand instantly. Without it, even the most thoughtful analysis loses impact.
Examples such as bar charts, scatter plots, and heat maps demonstrate how visuals can reveal what tables conceal. They show relationships, highlight patterns, and guide smarter decisions. In data analytics, this clarity is the difference between acting fast and missing opportunities.
Strategies improve this power further. Choosing the correct chart, simplifying visuals, and applying a clear visual hierarchy all matter. Consistency and accessibility ensure that every reader, no matter their background, understands the insight with ease.
Practical use cases make the value clear. Businesses track performance with dashboards, while hospitals use healthcare data visualization to monitor patient outcomes. Even travel companies gain insights through Airbnb data visualization to improve guest experiences. Encoding connects numbers to real actions.
Excel alone often falls short in this area. That is why a more innovative chart maker is essential. ChartExpo stands out among the best tools for data visualization. It offers clarity, flexibility, and visuals that go beyond Excel’s limits.
The conclusion is simple. Better visuals mean better decisions, and visual encoding is no longer optional; it is essential for growth. So, install ChartExpo today, and start transforming your data into insights you can act on. The sooner you begin, the faster your data starts working for you.
How much did you enjoy this article?


Calculate accounts receivable turnover ratio to measure credit collection speed, improve cash flow, and strengthen your financial strategy. Read on!

Change Management KPIs are the key to tracking adoption, performance, and ROI during transitions. Find out which metrics matter. Read on!

Data collection methods and techniques determine the quality of every insight you act on. Explore key approaches for gathering reliable data. Read on!


