• Home
  • Tools dropdown img
    • Spreadsheet Charts

      • ChartExpo for Google Sheets
      • ChartExpo for Microsoft Excel
    • Power BI Charts

      • Power BI Custom Visuals by ChartExpo
    • Word Cloud

  • Charts dropdown img
    • Chart Category

      • Bar Charts
      • Circle Graphs
      • Column Charts
      • Combo Charts
      • Comparison Charts
      • Line Graphs
      • PPC Charts
      • Sentiment Analysis Charts
      • Survey Charts
    • Chart Type

      • Box and Whisker Plot
      • Clustered Bar Chart
      • Clustered Column Chart
      • Comparison Bar Chart
      • Control Chart
      • CSAT Survey Bar Chart
      • CSAT Survey Chart
      • Dot Plot Chart
      • Double Bar Graph
      • Funnel Chart
      • Gauge Chart
      • Likert Scale Chart
      • Matrix Chart
      • Multi Axis Line Chart
      • Overlapping Bar Chart
      • Pareto Chart
      • Radar Chart
      • Radial Bar Chart
      • Sankey Diagram
      • Scatter Plot Chart
      • Slope Chart
      • Sunburst Chart
      • Tornado Chart
      • Waterfall Chart
      • Word Cloud
    • Google Sheets
      Microsoft Excel
  • Services
  • Pricing
  • Contact us
  • Blog
  • Support dropdown img
      • Gallery
      • Videos
      • Contact us
      • FAQs
      • Resources
    • Please feel free to contact us

      atsupport@chartexpo.com

Categories
All Data Visualizations Data Analytics Surveys
Add-ons/
  • Google Sheets
  • Microsoft Excel
  • Power BI
All Data Visualizations Data Analytics Surveys
Add-ons
  • Google Sheets
  • Microsoft Excel
  • Power BI

We use cookies

This website uses cookies to provide better user experience and user's session management.
By continuing visiting this website you consent the use of these cookies.

Ok

ChartExpo Survey


Home > Blog > Data Analytics

SEO Analytics Report: Analyze, Visualize, Improve

What is an SEO analytics report, and why should you care?

If you’re running an online business, data isn’t optional but essential. An SEO analytics report helps you see how your website performs in search engines. It tells you what’s working and what needs fixing.

SEO analytics report

A good SEO analytics report also helps you make smarter marketing decisions. Want to know which blog post brings in the most traffic? Done. Are you curious about how your latest campaign impacted organic clicks? The numbers will tell you.

This is where data analytics becomes your ally. It transforms guesswork into strategy when paired with the right analytics tools for business. Whether you monitor keyword growth or bounce rates, the goal is always clarity. Precise data leads to clear results.

Many brands also blend their SEO insights with social media analytics tools. Why? Because search and social often go hand in hand. If your content ranks well and gets shared, you win both battles.

So, what makes an SEO analytics report effective? Simplicity, relevance, actionable insights, and, above all, consistency. Review it regularly, watch for trends, and act fast.

Data doesn’t lie—but you have to know where to look.

Let me guide you…

Table of Contents:

  1. What is an SEO Analytics Report?
  2. What is the Importance of Using an SEO Analysis Report?
  3. What Should Be Included in SEO Report Analytics?
  4. How to Create an SEO Website Analysis Report?
  5. How to Visualize SEO Analytics Reporting in Google Sheets?
  6. Limitations of an SEO Site Analysis Report
  7. FAQs
  8. Wrap Up

What is an SEO Analytics Report?

Definition: An SEO analytics report shows how well your website performs in search engines. It tracks rankings, traffic, and keyword data. You see what brings visitors in—and what pushes them away. This report highlights strengths and weaknesses. It helps improve your content and strategy.

Analytics tools for business help you get precise numbers and trends. They support smarter marketing decisions. Businesses rely on these tools to grow visibility and track online success.

Top Five Charts can show an SEO Analytics Report

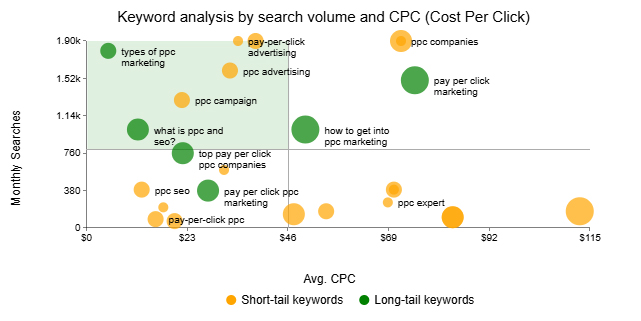
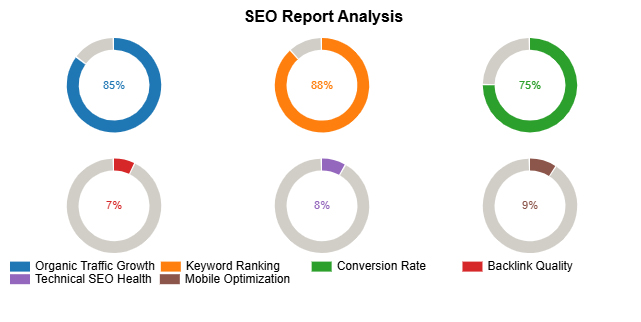
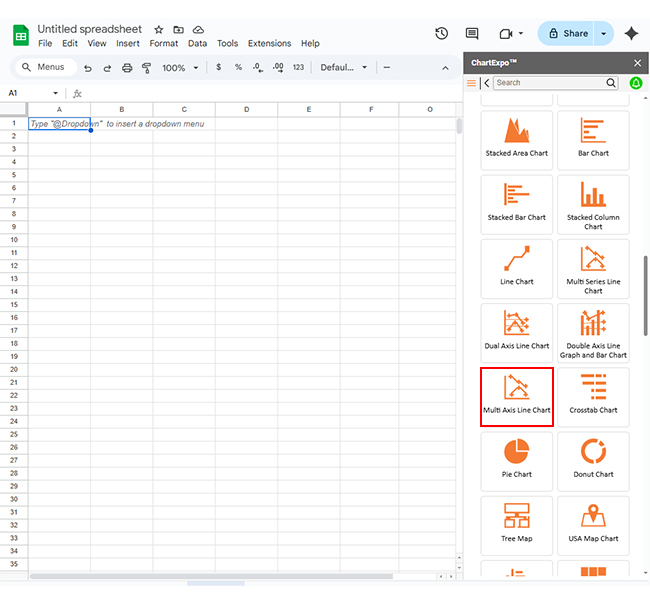
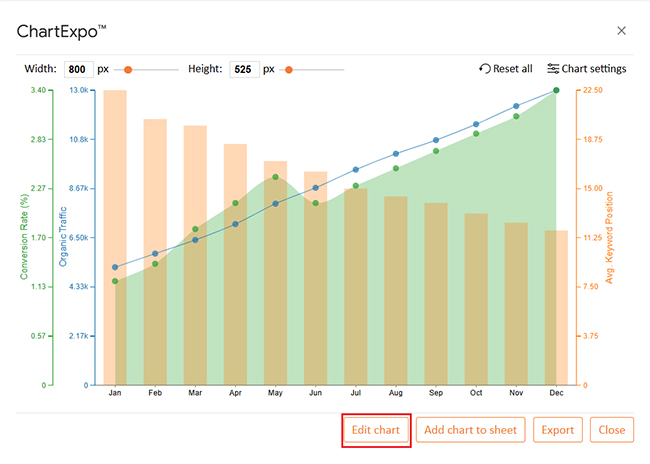
Explore the top five charts to analyze your SEO analytics report. All these charts were built with ChartExpo. ChartExpo is a data visualization tool that creates insightful, easy-to-understand charts in Excel & Google Sheets.

Multi-Axis Line Chart:

SEO analytics report

Scatter Plot:

SEO analytics report

Slope Chart:

SEO analytics report

Double Bar Graph:

SEO analytics report

Progress Circle Chart:

SEO analytics report

What is the Importance of Using an SEO Analysis Report?

Is your website working for you? The SEO analytics report will help you find out. It doesn’t guess—it shows the facts. If you’re serious about online growth, these reports are non-negotiable.

Let’s break down why they matter.

  • Evaluate website performance: An SEO analytics report measures how visitors find and interact with your website. It uses data analytics to give insight into search rankings, traffic sources, and engagement.
  • Identifies optimization opportunities: It highlights underperforming pages and missed keyword targets. With the help of business analytics tools, you can make focused improvements to boost visibility.
  • Detects technical issues: The report reveals crawl errors, broken links, and slow load times. If left unchecked, these issues can damage your ranking and visitor experience.
  • Tracks SEO progress: You can measure performance over time and spot trends. Detailed reporting helps you know what’s working and what isn’t.
  • Supports strategic planning: The data helps you plan future content, refine keyword strategies, and focus your budget wisely. It’s how intelligent analysis turns insight into action.
  • Enhances competitive edge: You can analyze competitor website traffic and compare keyword performance. This helps you find gaps in their strategy—and use them to your advantage.

What Should Be Included in SEO Report Analytics?

You’ve got data, but what do you need to see in an SEO analytics report? A good one doesn’t drown you in numbers. It filters out the noise and shows what matters.

Here’s what every smart report should include, summed up in six simple essentials.

  • Organic traffic & keyword rankings: Track how many people find your site through search. Pair that with keyword rankings to see which terms drive visibility using marketing analytics platform tools.
  • Click-through rates and conversion tracking: CTR shows if your listings get attention. Combine that with conversion data to measure real results, not just traffic.
  • Backlink profile & domain authority: See who links to your site and how strong those links are. A healthy backlink profile builds trust with search engines.
  • Top performing pages: Highlight which pages bring in the most visits and keep users engaged. This tells you what content works—and what to create more of.
  • Bounce rate & session duration: High bounce rate? Low time on page? These signals hint at content gaps or weak user experience. Using visual analytics makes the patterns easier to spot.
  • Technical SEO & index coverage: Check for crawl errors, slow load times, and indexing issues. With marketing report examples, these technical details become clear and actionable.

How to Create an SEO Website Analysis Report?

Creating an SEO analytics report shouldn’t feel overwhelming. Think of it as building a smart snapshot of your website’s performance. It’s less about stuffing it with numbers and more about making sense of the right ones. Here’s how to do it.

  1. Set clear goals: Start by defining what success looks like. Clear goals sharpen focus and align your analytics with traffic, leads, or conversions.
  2. Choose smart tools: Use reliable analytics tools that track search, behavior, and technical performance. The right platform saves time and delivers the insights that matter.
  3. Analyze traffic & keywords: Compare organic traffic and keyword performance. This will show which terms drive real results and where you need improvement.
  4. Audit on-page & technical SEO: Check titles, headers, and content structure. Look into page speed, mobile usability, and indexing issues. Pivot reporting can help you spot patterns quickly.
  5. Assess backlinks & authority: Measure the number and quality of backlinks. This will help you understand your site’s trustworthiness in search engines.
  6. Build, format, and review the report: Format everything clearly and simply. Update and review it regularly to stay ahead and adjust your strategy before competitors do.

How to Visualize SEO Analytics Reporting in Google Sheets?

What is an SEO analytics report? Think of it as your website’s performance review—minus the awkward meeting. You’ve got numbers, trends, rankings, and behavior all packed together. But raw data isn’t the end goal. It needs to make sense. That’s where data visualization steps in. It helps you see the story behind the stats.

Now, Google Sheets does a decent job until it doesn’t. Complex charts? Clean visuals? Smooth user experience? Not quite.

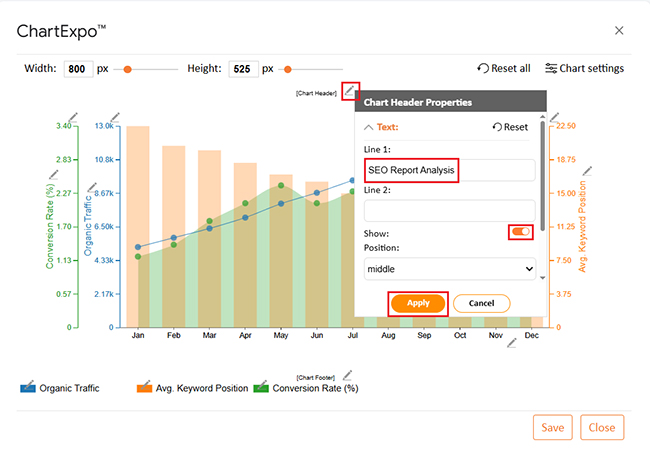
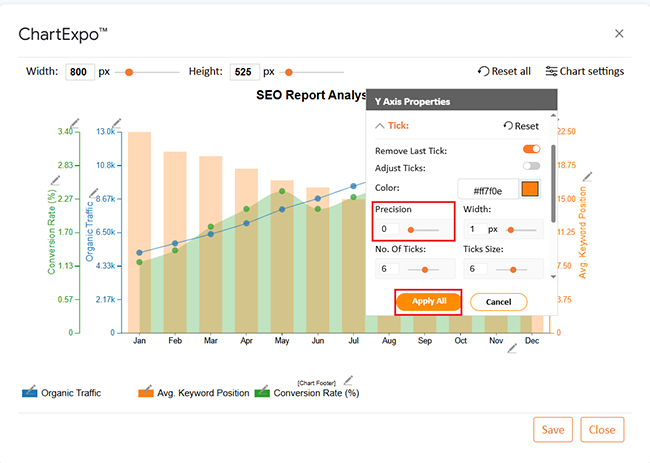
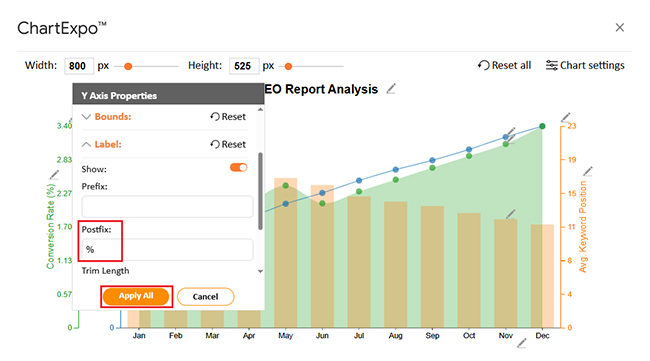
That’s where ChartExpo comes in. It transforms cluttered spreadsheets into clear, interactive visuals—so your SEO data tells you something worthwhile.

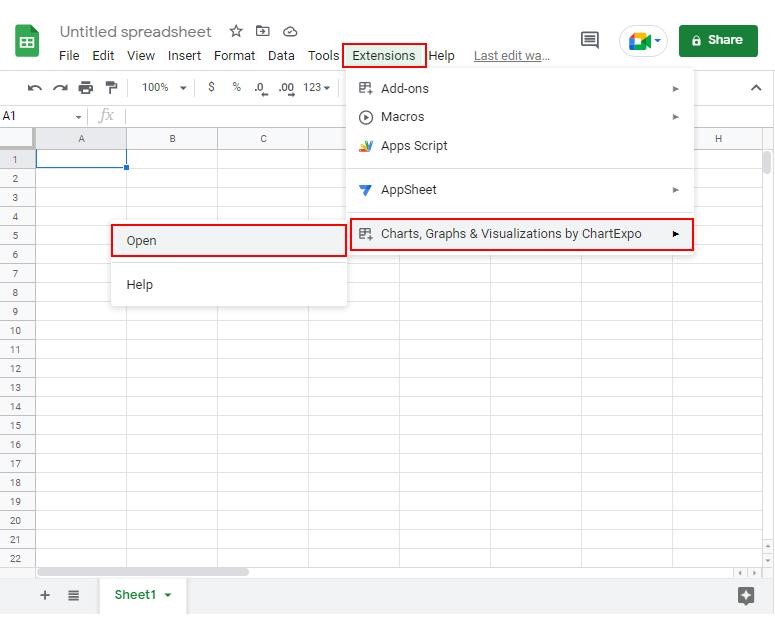
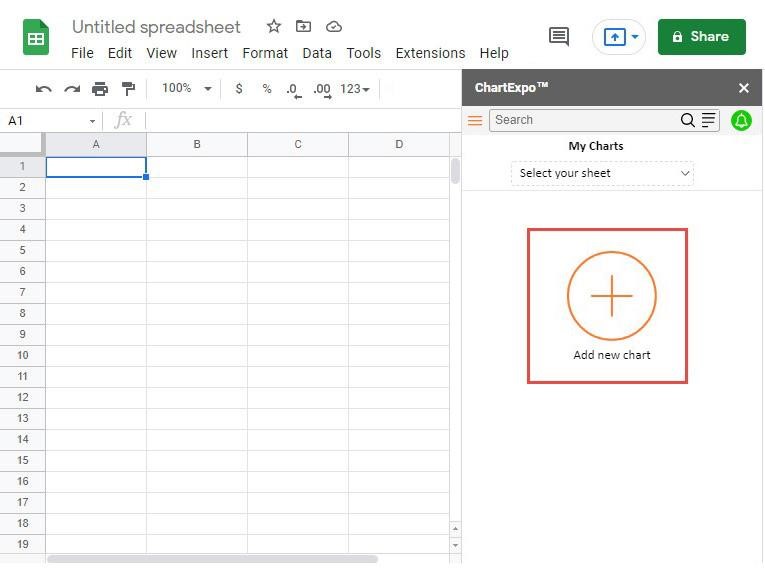
How to Install ChartExpo in Google Sheets?

  1. To start using ChartExpo, download it directly from the Google Sheets program. To do this, select Extensions from the top toolbar.
  2. A menu will appear. Click the Get add-ons option.
  3. Search for ChartExpo, and click on Charts, Graphs & Visualizations by ChartExpo when it appears in the results.
  4. Click the Install button. You will have to confirm your Google account and accept some permissions.

ChartExpo charts are available both in Google Sheets and Microsoft Excel. Please use the following CTAs to install the tool of your choice and create beautiful visualizations in a few clicks in your favorite tool.

Example

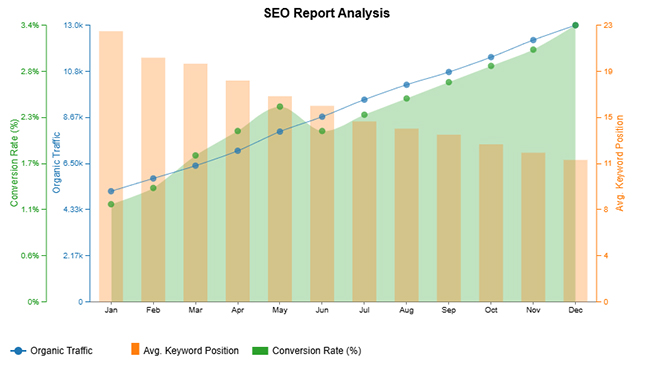
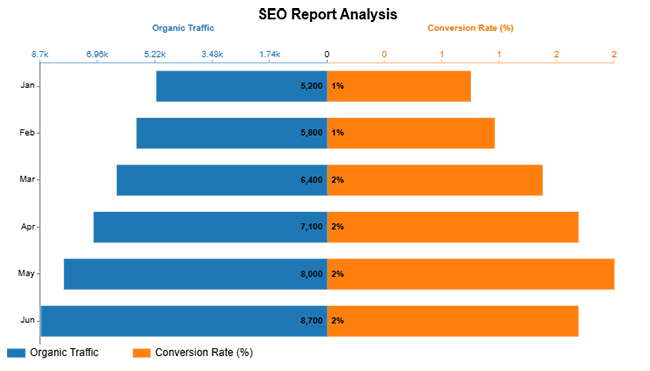
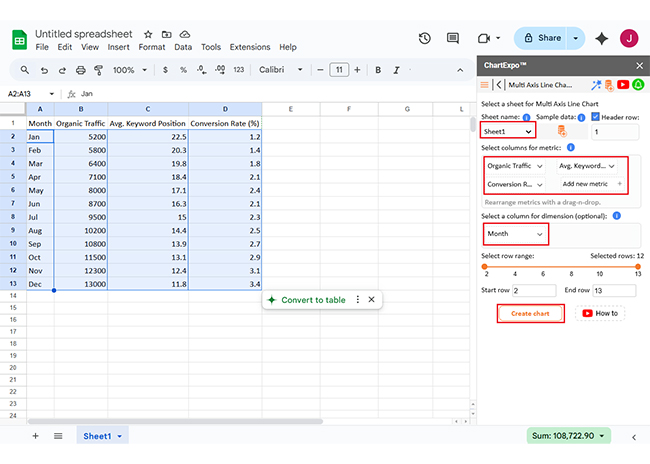
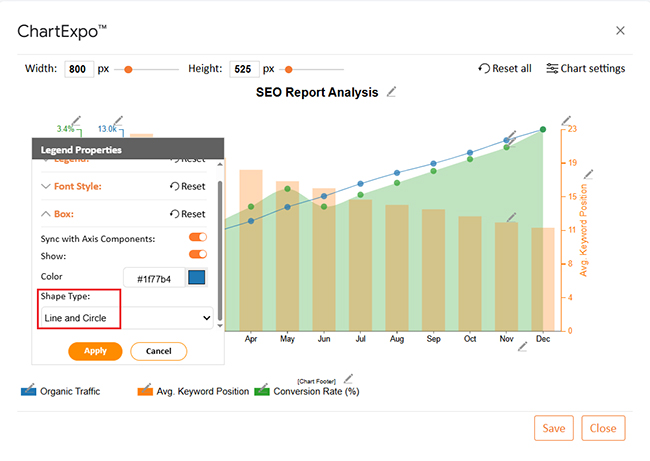
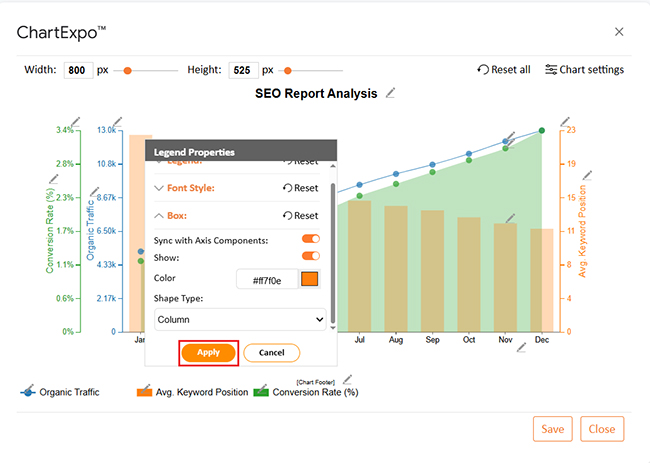
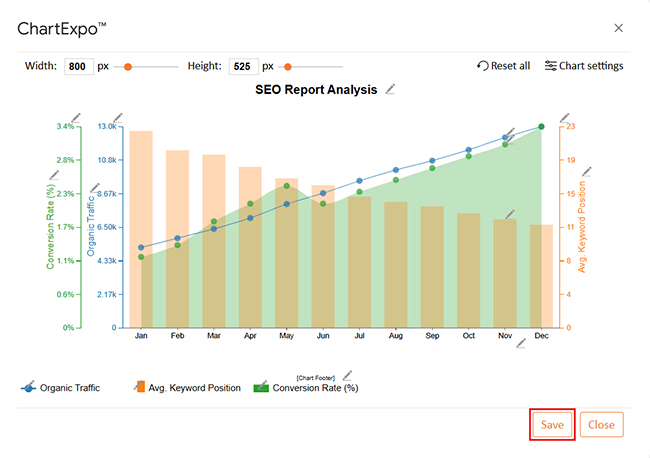
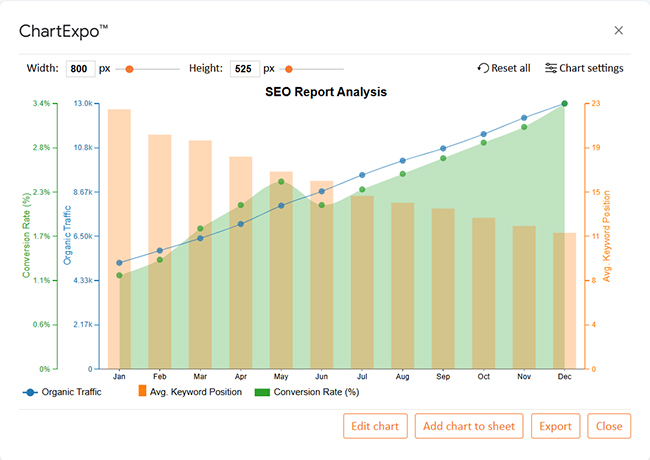
Let’s analyze this SEO analytics report sample data in Google Sheets using ChartExpo.

Month Organic Traffic Avg. Keyword Position Conversion Rate (%)
Jan 5200 22.5 1.2
Feb 5800 20.3 1.4
Mar 6400 19.8 1.8
Apr 7100 18.4 2.1
May 8000 17.1 2.4
Jun 8700 16.3 2.1
Jul 9500 15 2.3
Aug 10200 14.4 2.5
Sep 10800 13.9 2.7
Oct 11500 13.1 2.9
Nov 12300 12.4 3.1
Dec 13000 11.8 3.4
  • To get started with ChartExpo, install ChartExpo in Google Sheets.
  • Go to Extensions > Charts, Graphs & Visualizations by ChartExpo > Open.
SEO analytics report
  • To access the charts library, click the Add new chart button.
SEO analytics report
  • Once it loads, scroll through the charts list to locate and choose the “Multi-Axis Line Chart”.
SEO analytics report
  • Click the “Create Chart From Selection” button after selecting the data from the sheet, as shown.
SEO analytics report
  • Your Multi Axis Line Chart will appear as shown below.
SEO analytics report
  • You can change the data representation by clicking on Settings as follows:
SEO analytics report
  • If you want to add anything to the chart, click the Edit Chart button:
SEO analytics report
  • Click the pencil icon next to the Chart Header to change the title.
  • It will open the properties dialog. Under the Text section, you can add a heading in Line 1 and enable Show.
  • Give the appropriate title of your chart and click the Apply button.
SEO analytics report
  • Change the precision value of the Avg. keyword Position to zero as follows:
SEO analytics report
  • Change the Precision value to one and add the percentage with the Conversion Rate as follows:
SEO analytics report
  • Change the Legend shape of “Organic Traffic” into a Line and Circle, and click the “Apply” button.
SEO analytics report
  • Change the legend shape of “Avg. Keyword Position” into a Column and click the “Apply” button.
SEO analytics report
  • After making all changes, click on the “Save” button as follows:
SEO analytics report
  • Your final Multi Axis Line Chart will look like the one below.
SEO analytics report

Insight

  • Organic traffic increased from 5,200 to 13,000
  • Keyword rankings showed consistent monthly improvement
  • Conversion rate rose from 1.2% to 3.4%
  • This data indicates strong SEO performance and growing user engagement over time

Limitations of an SEO Site Analysis Report

An SEO analytics report is powerful—but it’s not perfect. Think of it as a GPS. It’s super helpful, but sometimes, a human needs to make the final call. You might miss the bigger picture if you rely on the report alone.

Let’s break down the common blind spots.

  • Data accuracy limitations: Data isn’t always real-time or 100% correct. Crawlers miss things; even top social media analytics tools can misreport sources or traffic.
  • Limited competitor insights: You can analyze competitor website traffic, but not all of it. Most reports only scratch the surface—real strategy still needs human digging.
  • Delayed results: SEO takes time. Even after significant updates, your BI reporting might show little change for weeks.
  • Tool dependency: You’re only as good as your tools. Some insights vanish if your platform lags or your subscription ends.
  • Metric overload: Too many numbers can blur what matters. Focus is key—don’t let shiny stats pull you off course.
  • Needs expert input: An analytical report can show data, but does not explain the “why.” Reading between the lines often requires an experienced hand.

FAQs

How to make an SEO analysis report?

  • Define clear SEO goals.
  • Use digital analytics tools.
  • Track traffic, keywords, and backlinks
  • Analyze on-page and technical SEO
  • Use Pivot reporting for visuals
  • Summarize insights clearly
  • Keep the format simple
  • Update the report regularly

How to write an SEO audit report?

  • Scan for SEO errors and issues
  • Check site speed, mobile use, and tags
  • Identify gaps and opportunities
  • Use marketing analytics platforms for deeper data
  • List actionable fixes
  • Add data reporting examples
  • Keep it concise and clear
  • Prioritize what impacts rankings most

What is the SEO ranking report?

An SEO ranking report tracks your keyword positions, shows what ranks where, and highlights gains and drops. It helps with data analysis for marketing and guides content and SEO strategy. It is often built with BI Reporting tools in a simple, visual, and to-the-point way.

Wrap Up

An SEO analytics report helps you understand your website’s search performance. It shows how users find you and what they do once they arrive. This data is essential for growth.

This report includes metrics like traffic, keywords, and rankings. You also see how users engage with your content. These are key parts of data analysis for marketing. It also highlights problems and opportunities, pointing out what works and what doesn’t. That means faster, smarter decisions.

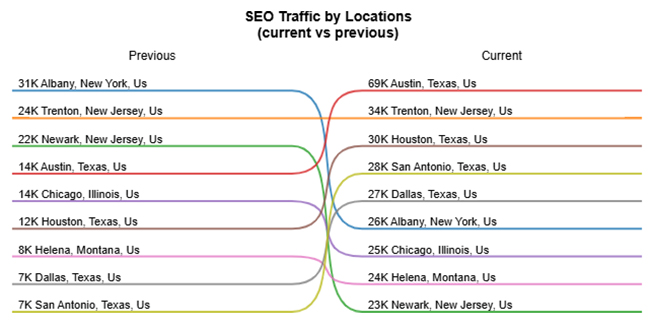
You can also use an SEO analytics report to analyze competitor website traffic. This shows where you stand in the market and what you can do to improve. Combining digital and social media analytics tools makes the report even more powerful. It gives a complete picture of your online presence.

In conclusion, an SEO analytics report is more than a document. It’s a strategy guide. It fits into data reporting examples marketers rely on to grow, compete, and succeed. To visualize insights better, install ChartExpo and bring your data to life.

How much did you enjoy this article?

GSAd1
Start Free Trial!
151595

Related articles

next previous
Data Analytics10 min read

Business Management KPIs for Driving Clearer Insights

Business management KPIs track key performance areas to drive success. Click here to learn how to analyze, use, and measure them effectively and more.

Data Analytics11 min read

Business Development Plan Template: A Complete Guide

A business development plan template helps to structure your growth strategy. This blog will guide you on how to write, visualize, and download your template.

Data Analytics22 min read

80-20 Rule: The Math Is Simple. The Impact Isn’t.

80-20 rule missteps can cost growth and alignment. Are you focusing on the right 20% or missing what matters? Learn more and rethink your strategy today!

Data Analytics8 min read

Benchmarking Dashboard: Tips for Better Insights

This guide dives deep into what benchmarking dashboards are. The guide also reveals easy ways and steps to create a benchmarking dashboard in Power BI.

Data Analytics9 min read

Inventory Management KPIs for Better Visual Insights

Key Performance Indicators for inventory track stock accuracy and efficiency. This blog covers the essential KPIs, analysis tips, and Excel tracking methods.

ChartExpo logo

Turn Data into Visual
Stories

CHARTEXPO

  • Home
  • Gallery
  • Videos
  • Services
  • Pricing
  • Contact us
  • FAQs
  • Privacy policy
  • Terms of Service
  • Sitemap

TOOLS

  • ChartExpo for Google Sheets
  • ChartExpo for Microsoft Excel
  • Power BI Custom Visuals by ChartExpo
  • Word Cloud

CATEGORIES

  • Bar Charts
  • Circle Graphs
  • Column Charts
  • Combo Charts
  • Comparison Charts
  • Line Graphs
  • PPC Charts
  • Sentiment Analysis Charts
  • Survey Charts

TOP CHARTS

  • Sankey Diagram
  • Likert Scale Chart
  • Comparison Bar Chart
  • Pareto Chart
  • Funnel Chart
  • Gauge Chart
  • Radar Chart
  • Radial Bar Chart
  • Sunburst Chart
  • see more
  • Scatter Plot Chart
  • CSAT Survey Bar Chart
  • CSAT Survey Chart
  • Dot Plot Chart
  • Double Bar Graph
  • Matrix Chart
  • Multi Axis Line Chart
  • Overlapping Bar Chart
  • Control Chart
  • Slope Chart
  • Clustered Bar Chart
  • Clustered Column Chart
  • Box and Whisker Plot
  • Tornado Chart
  • Waterfall Chart
  • Word Cloud
  • see less

RESOURCES

  • Blog
  • Resources
  • YouTube
SIGN UP FOR UPDATES

We wouldn't dream of spamming you or selling your info.

© 2025 ChartExpo, all rights reserved.