• Home
  • Tools dropdown img
    • Spreadsheet Charts

      • ChartExpo for Google Sheets
      • ChartExpo for Microsoft Excel
    • Power BI Charts

      • Power BI Custom Visuals by ChartExpo
    • Word Cloud

  • Charts dropdown img
    • Chart Category

      • Bar Charts
      • Circle Graphs
      • Column Charts
      • Combo Charts
      • Comparison Charts
      • Line Graphs
      • PPC Charts
      • Sentiment Analysis Charts
      • Survey Charts
    • Chart Type

      • Box and Whisker Plot
      • Clustered Bar Chart
      • Clustered Column Chart
      • Comparison Bar Chart
      • Control Chart
      • CSAT Survey Bar Chart
      • CSAT Survey Chart
      • Dot Plot Chart
      • Double Bar Graph
      • Funnel Chart
      • Gauge Chart
      • Likert Scale Chart
      • Matrix Chart
      • Multi Axis Line Chart
      • Overlapping Bar Chart
      • Pareto Chart
      • Radar Chart
      • Radial Bar Chart
      • Sankey Diagram
      • Scatter Plot Chart
      • Slope Chart
      • Sunburst Chart
      • Tornado Chart
      • Waterfall Chart
      • Word Cloud
    • Google Sheets
      Microsoft Excel
  • Services
  • Pricing
  • Contact us
  • Blog
  • Support dropdown img
      • Gallery
      • Videos
      • Contact us
      • FAQs
      • Resources
    • Please feel free to contact us

      atsupport@chartexpo.com

Categories
All Data Visualizations Data Analytics Surveys
Add-ons/
  • Google Sheets
  • Microsoft Excel
  • Power BI
All Data Visualizations Data Analytics Surveys
Add-ons
  • Google Sheets
  • Microsoft Excel
  • Power BI

We use cookies

This website uses cookies to provide better user experience and user's session management.
By continuing visiting this website you consent the use of these cookies.

Ok

ChartExpo Survey


Home > Blog > Data Analytics

Restaurant Profit and Loss Template for Data Insights

The restaurant’s profit and loss statement hits harder than the dinner rush on a Friday night. Have you considered how it could impact your business? Many restaurant owners focus on full tables and reviews.

Restaurant Profit and Loss Template

Yet, 60% fail within their first year, often due to financial oversight. From this statistic, tracking money in and out is no longer optional.

The main message: your monthly decisions should always be grounded in numbers. A profit and loss statement identifies exactly where your resources help or hurt your business. Without consistent financial records, you’re navigating mindlessly; with them, you can identify growth opportunities.

Think about the pressure of price sensitivity in your menu. A two-dollar swing on an entrée can affect customer behavior and your bottom line. The right report shows the real impact before it’s too late. That’s where templates become powerful. They cut through noise and reveal truths hiding in daily operations.

The restaurant profit and loss template in Excel isn’t just a form. It is a tool that transforms scattered data into insights you can act on. From ingredients to utilities, every figure finds its place. With each update, the picture becomes sharper.

Ask yourself—can you afford to manage your business without clarity? Using a Restaurant profit and loss template is a simple, effective step toward taking control of your restaurant’s financial future.

Table of Contents:

  1. What is a Restaurant Profit and Loss Template?
  2. Why is the P&L Statement for a Restaurant Important?
  3. When to Use the Restaurant P&L Template?
  4. Restaurant Profit and Loss Statement Templates
  5. How to Create a Profit and Loss Format for a Restaurant in Excel?
  6. How to Analyze a Restaurant Profit and Loss Template in Excel?
  7. How to Use a Restaurant Profit and Loss Template?
  8. Benefits of the P&L Statement for a Restaurant
  9. Tips for a Profit and Loss Format for a Restaurant
  10. FAQs
  11. Wrap Up

What is a Restaurant Profit and Loss Template?

Definition: A Restaurant Profit and Loss Template is a simple tool to track income and expenses. It shows if your restaurant is making money or losing it. Owners use it to monitor sales, food costs, payroll, and other expenses. The data in this template connects directly to key financial metrics that guide smarter decisions.

Many restaurants use a profit and loss template in Excel because it is easy to update and customize. With it, you can see patterns month after month. The template helps you stay organized and spot problems early. It turns numbers into a clear picture of performance you can trust.

Why is the P&L Statement for a Restaurant Important?

Running a restaurant without tracking numbers is like cooking without tasting. Mistakes will show up eventually. A profit and loss statement ensures you know the true health of your restaurant, making strategic decisions instead of guesswork.

How?

  • Tracks revenue and expenses: The statement records every dollar earned and every cost paid. This gives a full picture of how money moves through the business.
  • Reveals profitability: It shows if your restaurant is making money or losing it. Owners can spot weak areas before they become serious problems.
  • Supports smarter planning: By reviewing numbers regularly, you can plan budgets with confidence. This helps in setting realistic sales goals and cutting unnecessary costs.
  • Improves decision-making: The report highlights trends over time. You can see what works, what fails, and where to adjust quickly.
  • Builds investor confidence: Potential investors want clear data. A reliable statement proves you manage money responsibly and understand your operations.

When to Use the Restaurant P&L Template?

Profit and loss numbers speak louder than appearances. A restaurant may look bustling, yet profits might quietly dwindle. That’s why using a P&L template at the right time is critical. It keeps the business anchored in facts instead of assumptions. Here are instances where this template helps you see true performance before surprises arise.

  • Monthly: A monthly finance report helps you stay ahead of trends. It highlights cash flow, food costs, and payroll shifts so issues can be corrected quickly.
  • Quarterly or Yearly: Longer periods show bigger patterns. This is where you can perform a win-loss analysis to compare different menu items, seasons, or campaigns.
  • During Expansion: Growth means risk. Using financial graphs and charts in Excel at this stage makes investor conversations easier and supports smarter decisions.

Restaurant Profit and Loss Statement Templates

As a restaurant owner, you need more than recipes and service skills. Your success depends on clear reporting that shows where your money is made and where it slips away. Using a profit and loss statement template keeps everything structured for you. Whether you need something simple or advanced, choosing the right format can change how you understand your business:

  1. Basic Template: This version covers your sales, cost of goods, and expenses. As a straightforward starting point, you can quickly fill it out and get a clear snapshot of your performance.
  2. Detailed Template: Here, you see your line items broken down into categories. You also have space for items such as provisions for credit losses to help you keep your reporting accurate.
  3. Excel-Based Template: An Excel file is easy for you to update and reuse. You can also link it with a finance dashboard in Excel for deeper insights.
  4. Visual Template: Completing the range of options, charts, and visuals simplifies numbers into patterns. A visual template highlights key insights in a monthly finance report and makes it easier to share data with staff or investors.

How to Create a Profit and Loss Format for a Restaurant in Excel?

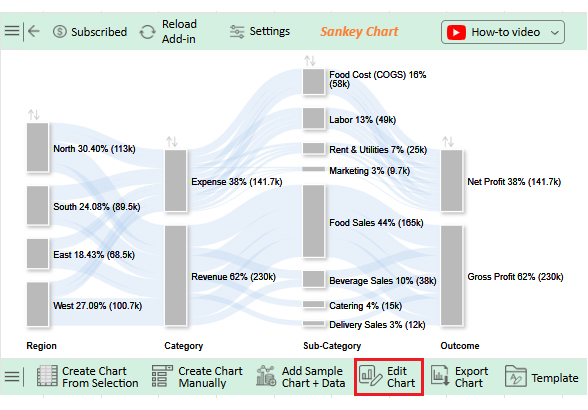
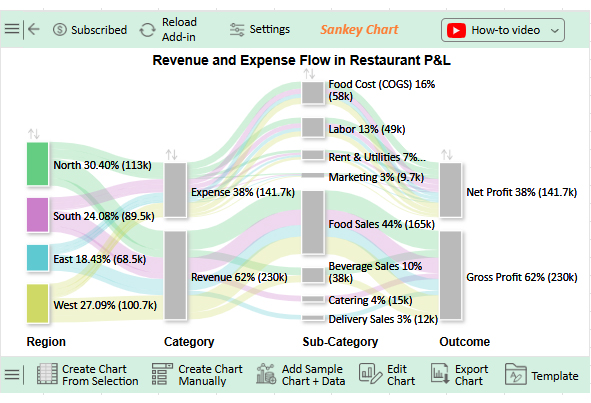
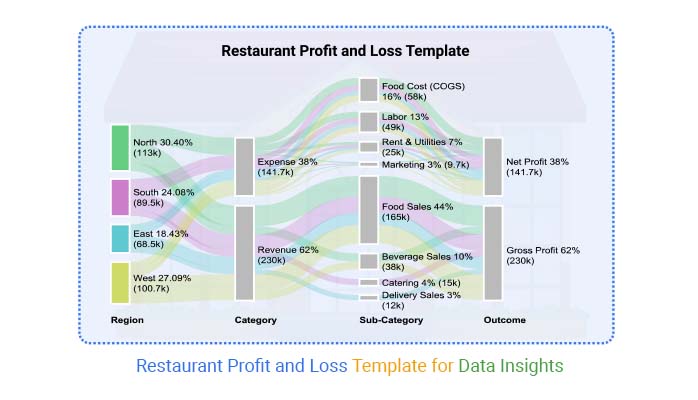
Turn raw numbers into a clear financial picture with Excel. Use a profit and loss format to see where money comes in and where it goes out. This way, you will rely on solid financial metrics to gain a reliable view of profitability and performance:

  1. List revenue streams: List every source of income, such as dine-in meals, bar sales, delivery, or catering. Separate them to show which areas drive growth and which need improvement.
  2. Record costs: Log expenses for food, wages, rent, and utilities. Break down expenses to spot patterns, such as rising food costs, before they cut too deeply into profit.
  3. Calculate gross profit: Subtract direct costs from total revenue to find your gross profit. Reveal how well core operations run and whether margins stay healthy.
  4. Deduct operating expenses: Include insurance, marketing, repairs, and other overhead. Track these regularly to control spending and prevent wasteful habits.
  5. Account for provision for credit losses: Record expected losses from unpaid bills or delayed payments. Factor these in for a more honest report instead of an inflated profit.
  6. Get net profit: Subtract all expenses from total revenue to calculate net profit. Use this final figure to see the true financial health of your restaurant and guide growth decisions.

How to Analyze a Restaurant Profit and Loss Template in Excel?

Running a restaurant without tracking numbers is like serving soup without a spoon. You know the flavor is there, but no one can really enjoy it. That’s where a restaurant profit and loss template comes in. It organizes the chaos of sales, costs, and profit.

To truly tell the story behind the numbers, visualization is key. However, while Excel handles calculations well, it falls short at revealing patterns visually.

We have ChartExpo. This Excel add-in solves the visualization problem by turning data sheets into clear, engaging visuals for fast, actionable insights.

How to Install ChartExpo in Excel?

  1. Open your Excel application.
  2. Open the worksheet and click the “Insert” menu.
  3. You’ll see the “My Apps” option.
  4. In the Office Add-ins window, click “Store” and search for ChartExpo on my Apps Store.
  5. Click the “Add” button to install ChartExpo in your Excel.

ChartExpo charts are available both in Google Sheets and Microsoft Excel. Please use the following CTAs to install the tool of your choice and create beautiful visualizations with a few clicks in your favorite tool.

Example

Let’s analyze this sample data in Excel using ChartExpo.

Region

Category Sub-Category Outcome

Amount ($)

North Revenue Food Sales Gross Profit 50,000
North Revenue Beverage Sales Gross Profit 20,000
North Expense Food Cost (COGS) Net Profit 18,000
North Expense Labor Net Profit 15,000
North Expense Rent & Utilities Net Profit 7,000
North Expense Marketing Net Profit 3,000
South Revenue Food Sales Gross Profit 40,000
South Revenue Catering Gross Profit 15,000
South Expense Food Cost (COGS) Net Profit 14,000
South Expense Labor Net Profit 12,000
South Expense Rent & Utilities Net Profit 6,000
South Expense Marketing Net Profit 2,500
East Revenue Food Sales Gross Profit 30,000
East Revenue Delivery Sales Gross Profit 12,000
East Expense Food Cost (COGS) Net Profit 10,000
East Expense Labor Net Profit 9,000
East Expense Rent & Utilities Net Profit 5,500
East Expense Marketing Net Profit 2,000
West Revenue Food Sales Gross Profit 45,000
West Revenue Beverage Sales Gross Profit 18,000
West Expense Food Cost (COGS) Net Profit 16,000
West Expense Labor Net Profit 13,000
West Expense Rent & Utilities Net Profit 6,500
West Expense Marketing Net Profit 2,200
  • To get started with ChartExpo, install ChartExpo in Excel.
  • Now, click on My Apps from the INSERT menu.
Restaurant Profit and Loss Template
  • Choose ChartExpo from My Apps, then click Insert.
Restaurant Profit and Loss Template
  • Once it loads, choose the “Sankey Chart” from the charts list.
Restaurant Profit and Loss Template
  • Click the “Create Chart From Selection” button after selecting the data from the sheet, as shown.
Restaurant Profit and Loss Template
  • ChartExpo will generate the visualization below for you.
Restaurant Profit and Loss Template
  • If you want to have the chart’s title, click Edit Chart, as shown in the above image.
  • Click the pencil icon next to the Chart Header to change the title.
  • It will open the properties dialog. Under the Text section, you can add a heading in Line 1 and enable Show.
  • Give the appropriate title of your chart and click the Apply button.
Restaurant Profit and Loss Template
  • You can add color to the Nodes and set the direction as follows:
Restaurant Profit and Loss Template
  • You can increase font size for better readability as follows:
Restaurant Profit and Loss Template
  • Click the “Save Changes” button to persist the changes.
Restaurant Profit and Loss Template
  • Your final chart will appear as follows.
Restaurant Profit and Loss Template

Insights

  • Revenue contributes 62% ($230k) vs. Expenses at 38% ($141.7k). This gives a Net Profit of $88.3k.
  • Top Regions: North (30%) and West (27%) drive sales. East trails at 18%.
  • Sales Mix: Food 44% ($165k), Beverages 10%, Catering 4%, Delivery 3%.
  • Key Expenses: Food costs 16%, and Labor 13% are the highest; Rent, utilities, and marketing are smaller portions

How to Use a Restaurant Profit and Loss Template?

Managing a restaurant can feel like juggling knives. One slip, and profits vanish faster than last night’s special. That’s why a restaurant profit and loss template matters. It turns receipts and numbers into a clear story you can use. Used well, it becomes more than a record—it becomes a guide:

  1. Start with revenue: A profit and loss statement for a small business helps you input sales from food, drinks, catering, or delivery. Break them down so you can see which source drives the most income.
  2. Add expenses: Enter costs for food, payroll, rent, and utilities. Tracking them carefully helps spot where money is slipping away.
  3. Review gross profit: Subtract direct costs from sales. This shows how well your menu and pricing balance out against food and labor.
  4. Include operating costs: Record insurance, repairs, and marketing. These small but steady expenses reveal their impact over time.
  5. Factor in extra items: Do not forget taxes, interest, or a monthly finance report check-in. This keeps the numbers real and dependable.
  6. Analyze the results: Look at the net profit and compare it month to month. Pairing the template with a finance dashboard in Excel makes analysis sharper and decisions faster.

Benefits of the P&L Statement for a Restaurant

A full dining room does not always mean a healthy business. Profit can vanish quietly through food costs, payroll, or wasted supplies. That is why a P&L statement is more than paperwork. It is a restaurant’s financial mirror. With it, owners see what works, what drains profit, and where to act next.

How?

  • Clarity on finances: A P&L shows sales, costs, and profit in one place. This keeps owners grounded in facts instead of guesses.
  • Better decisions: Tracking performance highlights strengths and weaknesses. With the support of a finance dashboard in Excel, choices become sharper and less risky.
  • Improved cost control: Regular reports reveal rising expenses early. Spotting food cost spikes or payroll creep helps protect margins.
  • Growth support: Investors and lenders trust solid numbers. A monthly finance report backed by a P&L builds credibility and confidence.
  • Trend analysis: Comparing past results shows patterns across seasons or promotions. This helps plan menus, pricing, and staffing with precision.

Tips for a Profit and Loss Format for a Restaurant

Running a restaurant without clear numbers is like cooking blind. A profit and loss format keeps you honest. It helps you see where money flows in and where it slips away. When paired with financial graphs and charts in Excel, the format becomes even more powerful. Follow these tips to turn raw data into insight you can act on:

  • Keep revenue streams separate: Track food, beverages, catering, and delivery individually. This highlights which revenue streams are strongest, so you know where to focus your efforts.
  • Update regularly: Review monthly instead of waiting until year-end. This approach gives you quicker feedback and minimizes unexpected issues.
  • Track high costs carefully: Food and labor costs are typically the highest. Monitoring these closely helps you maintain healthy profit margins.
  • Use visualization tools: Numbers alone can seem flat, but a dashboard in Excel makes trends clearer and easier to explain.
  • Compare past and present: Compare results on a month-to-month or quarter-to-quarter basis. Spot patterns and plan smarter strategies.

FAQs

How do I create a P&L for my restaurant?

  • List all revenue sources.
  • Record food, labor, and overhead costs.
  • Subtract costs from revenue.
  • Track monthly for accuracy.

How to calculate profit and loss for a restaurant?

  • Add total sales revenue.
  • Subtract the cost of goods sold.
  • Deduct operating expenses like rent and payroll.
  • Factor in taxes and interest.
  • The remaining figure is net profit or loss.

Wrap Up

A restaurant depends on more than food and service. Numbers guide every decision. A clear P&L template clarifies those numbers. It highlights what works and what drains profit.

The best graph to show profit and loss makes the picture even clearer. Numbers alone can feel overwhelming, and graphs bring those details to life. They help owners see patterns faster and make smarter choices.

Tracking expenses is not only about rent and wages. Smart reporting also includes a provision for credit losses. This prevents overstated profits and keeps your records realistic. Honest numbers build confidence for growth.

Financial graphs and charts in Excel add power to your P&L. They reveal trends that raw tables cannot. With visuals, owners explain performance to staff, partners, or investors with ease.

But Excel has limits. Its visuals can feel plain and time-consuming. That is where ChartExpo changes everything. It turns ordinary reports into rich, engaging charts that make analysis simple.

Conclusively, your restaurant deserves more than guesswork. So, start using a profit and loss template today, and pair it with better visuals that speak clearly.

Pro tip: Install ChartExpo and transform how you understand your restaurant’s financial story.

How much did you enjoy this article?

GSAd1
Start Free Trial!
157693

Related articles

next previous
Data Analytics12 min read

Startup Financial Model: A Visual Approach

A startup financial model helps founders plan revenue, expenses, and cash flow. This guide shows how to create, analyze, and visualize your model.

Data Analytics10 min read

Restaurant Key Performance Indicators: A Complete Guide

Restaurant KPIs track sales, costs, and customer satisfaction. Click here to see the examples, benefits, and best practices to boost performance.

Data Analytics10 min read

SLA vs KPI: Key Differences Explained with Visuals

SLA vs. KPI defines performance standards and measures results in business operations. Learn the key differences, similarities, and practical examples.

Data Analytics12 min read

B2B Marketing KPIs: Key Metrics for B2B Growth

B2B marketing KPIs track lead quality, engagement, and revenue. Click here to learn how to choose, analyze, and visualize KPIs for better marketing results.

Data Analytics10 min read

KPI Tracking Software: A Visual Approach to KPIs

Understand what a KPI tracking software does and why it's essential. You’ll discover the best tools and tips to improve decision-making and performance.

ChartExpo logo

Turn Data into Visual
Stories

CHARTEXPO

  • Home
  • Gallery
  • Videos
  • Services
  • Pricing
  • Contact us
  • FAQs
  • Privacy policy
  • Terms of Service
  • Sitemap

TOOLS

  • ChartExpo for Google Sheets
  • ChartExpo for Microsoft Excel
  • Power BI Custom Visuals by ChartExpo
  • Word Cloud

CATEGORIES

  • Bar Charts
  • Circle Graphs
  • Column Charts
  • Combo Charts
  • Comparison Charts
  • Line Graphs
  • PPC Charts
  • Sentiment Analysis Charts
  • Survey Charts

TOP CHARTS

  • Sankey Diagram
  • Likert Scale Chart
  • Comparison Bar Chart
  • Pareto Chart
  • Funnel Chart
  • Gauge Chart
  • Radar Chart
  • Radial Bar Chart
  • Sunburst Chart
  • see more
  • Scatter Plot Chart
  • CSAT Survey Bar Chart
  • CSAT Survey Chart
  • Dot Plot Chart
  • Double Bar Graph
  • Matrix Chart
  • Multi Axis Line Chart
  • Overlapping Bar Chart
  • Control Chart
  • Slope Chart
  • Clustered Bar Chart
  • Clustered Column Chart
  • Box and Whisker Plot
  • Tornado Chart
  • Waterfall Chart
  • Word Cloud
  • see less

RESOURCES

  • Blog
  • Resources
  • YouTube
SIGN UP FOR UPDATES

We wouldn't dream of spamming you or selling your info.

© 2026 ChartExpo, all rights reserved.