• Home
  • Tools dropdown img
    • Spreadsheet Charts

      • ChartExpo for Google Sheets
      • ChartExpo for Microsoft Excel
    • Power BI Charts

      • Power BI Custom Visuals by ChartExpo
    • Word Cloud

  • Charts dropdown img
    • Chart Category

      • Bar Charts
      • Circle Graphs
      • Column Charts
      • Combo Charts
      • Comparison Charts
      • Line Graphs
      • PPC Charts
      • Sentiment Analysis Charts
      • Survey Charts
    • Chart Type

      • Box and Whisker Plot
      • Clustered Bar Chart
      • Clustered Column Chart
      • Comparison Bar Chart
      • Control Chart
      • CSAT Survey Bar Chart
      • CSAT Survey Chart
      • Dot Plot Chart
      • Double Bar Graph
      • Funnel Chart
      • Gauge Chart
      • Likert Scale Chart
      • Matrix Chart
      • Multi Axis Line Chart
      • Overlapping Bar Chart
      • Pareto Chart
      • Radar Chart
      • Radial Bar Chart
      • Sankey Diagram
      • Scatter Plot Chart
      • Slope Chart
      • Sunburst Chart
      • Tornado Chart
      • Waterfall Chart
      • Word Cloud
    • Google Sheets
      Microsoft Excel
  • Services
  • Pricing
  • Contact us
  • Blog
  • Support dropdown img
      • Gallery
      • Videos
      • Contact us
      • FAQs
      • Resources
    • Please feel free to contact us

      atsupport@chartexpo.com

Categories
All Data Visualizations Data Analytics Surveys
Add-ons/
  • Google Sheets
  • Microsoft Excel
  • Power BI
All Data Visualizations Data Analytics Surveys
Add-ons
  • Google Sheets
  • Microsoft Excel
  • Power BI

We use cookies

This website uses cookies to provide better user experience and user's session management.
By continuing visiting this website you consent the use of these cookies.

Ok

ChartExpo Survey


Home > Blog > Microsoft Excel

15 Recruitment KPIs to Guage Hiring Effectiveness

Recruitment key performance indicators (KPIs) are crucial tools for navigating today’s competitive job market, where companies wade through an average of 250 resumes per opening.

Recruitment key performance indicators

Recruitment Key Performance Indicators (KPIs) provide valuable insights into the various stages of the recruitment journey. This is from sourcing candidates to their eventual integration into the company.

Imagine having the ability to identify bottlenecks in your hiring process and precisely knowing where to make improvements. With the right KPIs, you can streamline your recruitment efforts, reduce time-to-hire, and enhance your workforce quality.

According to Glassdoor, the average length of the interview process in the U.S. is 23.7 days. This statistic underscores the need to streamline recruitment efforts to secure top talent before competitors do. Understanding and leveraging recruitment key performance indicators (KPIs) can make all the difference in attracting, assessing, and retaining the best candidates.

With zero hesitation, let’s explore the recruitment key performance indicators (KPIs) that matter and how they can elevate your hiring strategies.

Table of Content:

  1. What are Recruitment Key Performance Indicators (KPIs)?
  2. How to Set Recruitment KPIs?
  3. How to Track Recruitment KPIs in the Hiring Process?
  4. 15 Recruitment KPIs to Guage Hiring Effectiveness
  5. How to Examine Recruitment Key Performance Indicators?
  6. Wrap Up

What are Recruitment Key Performance Indicators (KPIs)?

Definition: Recruitment Key Performance Indicators (KPIs) are measurable metrics that gauge the effectiveness of recruitment processes. They are crucial in measuring the success and efficiency of the recruitment efforts throughout the hiring lifecycle. Thus, they provide valuable insights for optimizing recruitment strategies and enhancing overall talent acquisition efforts.

Common recruitment key performance indicators (KPIs) include the following:

  • Time-to-Fill: Measures the time taken to fill job vacancies.
  • Cost-per-hire: Assesses the expenses incurred in hiring.
  • Quality-of-Hire: Evaluates the performance and longevity of hires.
  • Source-of-Hire: Identifies the most effective recruitment channels.
  • Applicant Satisfaction: Measures candidates’ experiences with the hiring process.

How to Set Recruitment KPIs?

Setting Recruitment KPIs is crucial for assessing the effectiveness of hiring processes. Here is a step-by-step approach to help you establish meaningful and impactful hiring KPIs.

  1. Understand organizational objectives: Comprehensively understand the broader objectives and strategic goals of the organization. Recognize how talent acquisition contributes to these goals, ensuring alignment between recruitment efforts and organizational success.
  2. Collaborate with stakeholders: Engage with key stakeholders, including hiring managers, department heads, and HR teams. Solicit input to gain diverse perspectives on recruitment needs, challenges, and the specific skills required in different roles.
  3. Identify core metrics: Identify the core metrics that directly impact recruitment success. Common hiring KPIs include Time-to-Fill, Cost-per-Hire, Quality-of-Hire, Source-of-Hire, and Applicant Satisfaction. Tailor these metrics to suit the organization’s unique needs.
  4. Make KPIs SMART: Ensure each KPI for recruitment is Specific, Measurable, Achievable, Relevant, and Time-bound (SMART). This precision enhances clarity and facilitates accurate measurement, providing a solid foundation for effective KPI implementation.
  5. Consider diverse metrics: Beyond traditional metrics, consider diverse indicators that reflect the effectiveness of recruitment strategies. Examples of such metrics include the Diversity Hiring Index, Employee Retention Rate, or Talent Pipeline Conversion Rate. Diverse metrics offer a holistic view of recruitment success.
  6. Benchmark against industry standards: Compare chosen KPIs against industry standards. This will help you gain insights into the organization’s competitiveness in the talent market. Moreover, benchmarking helps set realistic targets and identifies areas for improvement.
  7. Define target values: Establish specific target values for each KPI for the recruitment process. These values should be challenging yet achievable, motivating the recruitment team to strive for continuous improvement.
  8. Prioritize key areas: Prioritize key areas based on the organization’s immediate needs and long-term objectives. Allocate resources and attention to the aspects that have the most significant impact on achieving recruitment goals.
  9. Establish baseline data: Before implementation, establish baseline data for each KPI for recruitment. This serves as a reference point for measuring progress and gauging the impact of recruitment strategies over time.
  10. Implement tracking mechanisms: Implement robust tracking mechanisms to monitor and evaluate KPIs continuously. Leverage technology, analytics tools, and regular reporting to ensure real-time visibility into recruitment performance. This facilitates agile adjustments as needed.

How to Track Recruitment KPIs in the Hiring Process?

An effective talent acquisition journey involves more than just hiring. It requires a nuanced understanding of how well the recruitment process aligns with organizational goals.

Tracking Key Performance Indicators (KPIs) in the recruitment landscape becomes the compass guiding these efforts. By incorporating skills matrix examples, organizations can better assess candidates’ qualifications against specific job requirements. Here is a step-by-step guide to help you track KPIs for recruitment with precision and efficiency.

  1. Select tracking tools: Choose appropriate tracking tools tailored to the organization’s needs. Applicant Tracking Systems (ATS) and specialized HR analytics tools are examples that streamline data collection and analysis.
  2. Automate data collection: Implement automated systems to collect recruitment data in real time. This reduces manual efforts, minimizes errors, and ensures continuous KPIs updates as new information becomes available.
  3. Establish dashboards: Create user-friendly dashboards that visualize key recruitment metrics and KPIs. Dashboards provide at-a-glance insights, facilitating quick assessments of performance and enabling data-driven decision-making.
  4. Regular reporting: Institute a regular reporting schedule to keep stakeholders informed about recruitment key performance indicators (KPIs). Regular reports provide a comprehensive overview of trends, successes, and areas for improvement, fostering transparency and accountability.
  5. Integrate data sources: Integrate data from various sources, including ATS, CRM analytics, and external market data. Comprehensive data integration offers a holistic view of the recruitment process, enabling more informed analysis and strategic adjustments.
  6. Set alerts and notifications: Implement alert systems to notify relevant stakeholders of critical changes or deviations from set KPI targets. Alerts ensure timely responses to emerging issues and allow for proactive adjustments to recruitment strategies.
  7. Train recruitment teams: Provide training to recruitment teams on KPI tracking tools and methodologies. Ensuring that teams are adept at using the tracking systems enhances efficiency, accuracy, and overall decision-making effectiveness.
  8. Continuous evaluation: Establish a culture of continuous evaluation. Regularly assess the relevance and effectiveness of chosen hiring KPIs, and tracking tools, including Pyramid charts, and reporting mechanisms. This iterative approach ensures that tracking processes evolve with changing organizational needs.

15 Recruitment KPIs to Guage Hiring Effectiveness

Utilizing Recruitment Key Performance Indicators (KPIs) is crucial in assessing the efficacy of any recruitment endeavor. Here, we outline 15 commonly employed KPIs to gauge hiring success:

  1. Hiring Cycle Length: This is a more general term for the overall duration of the recruitment process.
  2. Normalized Recruitment Investment: This highlights the cost per successful hire.
  3. Employee Value Assessment: This broadens the scope to consider not just performance but the overall value new hires bring.
  4. New Hire Acquisition Success Rate: This clarifies the desired outcome of acquiring new talent.
  5. Post-Application Satisfaction Survey: This specifies the timing of the feedback collection.
  6. Candidate Acquisition Source Analysis: This clarifies the purpose of tracking sources – to understand where talent comes from.
  7. Applicant Journey Abandonment Rate: This emphasizes the candidate’s perspective and the idea of stopping their application journey.
  8. Interview to Offer Ratio: The number of interviews conducted per job offer extended, indicating the efficiency of the interview process.
  9. Interview to Hire Ratio: The number of interviews conducted per successful hire, providing insights into the effectiveness of the selection process.
  10. New Hire Resilience: This uses a more positive and action-oriented term to describe staying with the company.
  11. Time to Productivity: Ignite a shared responsibility for building a diverse team by tracking progress towards a workforce that reflects the community.
  12. Diversity Hiring Metrics: Foster ownership for inclusion by tracking progress toward a representative workforce.
  13. Candidate Feedback Score: A technical term emphasizing the combined data from candidate evaluations.
  14. Offer Rejection Rate: This emphasizes company culture as a potential reason for offer decline.
  15. Hiring Manager Satisfaction: Rate the timeliness and effectiveness of communication from the recruiting team.

How to Examine Recruitment Key Performance Indicators?

Data analysis – a maze of numbers, a jungle of trends, and a battlefield of insights. In this daring quest, data visualization acts as the trusty map, guiding us through the dense information thicket. Yet, our companion Excel, while noble in its efforts, often falters in the face of complex visualization tasks.

Fear not, for ChartExpo emerges as the beacon of hope in this tumultuous sea of data visualization. ChartExpo enables you to move beyond traditional charts and access advanced, specialized visualizations for your most challenging projects.

Now, let us embark on an expedition to unravel the mysteries of analyzing recruitment KPIs.

But first”¦

Let’s learn how to Install ChartExpo in Excel.

  1. Open your Excel application.
  2. Open the worksheet and click the “Insert” menu.
  3. You’ll see the “My Apps” option.
  4. In the office Add-ins window, click “Store” and search for ChartExpo on my Apps Store.
  5. Click the “Add” button to install ChartExpo in your Excel.

ChartExpo charts are available both in Google Sheets and Microsoft Excel. Please use the following CTA’s to install the tool of your choice and create beautiful visualizations in a few clicks in your favorite tool.

Example

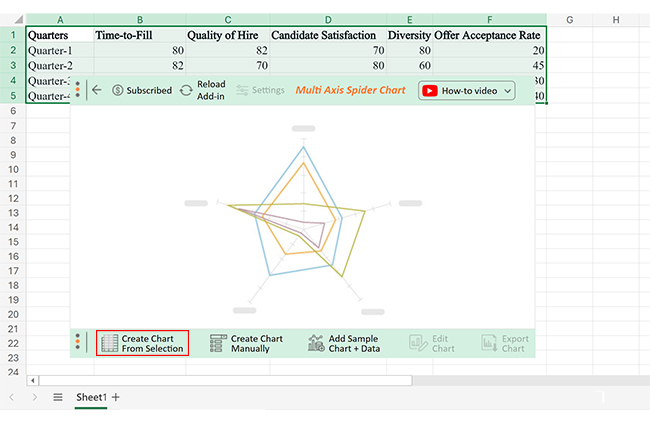
The table below contains quarterly recruitment performance data.

Quarters Time-to-Fill Quality of Hire Candidate Satisfaction Diversity Ratio Offer Acceptance Rate
Quarter-1 80 82 70 80 20
Quarter-2 82 70 80 60 45
Quarter-3 70 80 82 70 30
Quarter-4 85 70 80 65 40

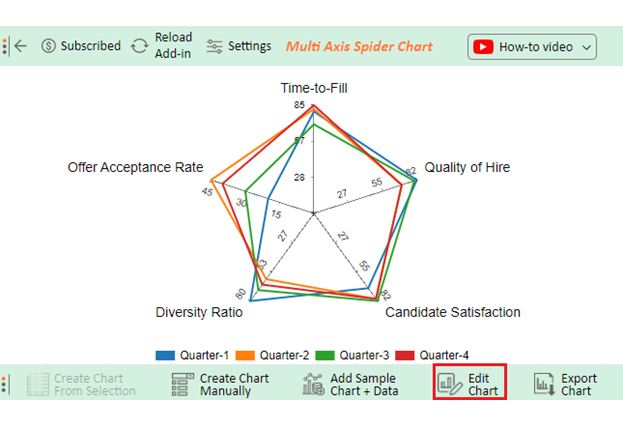
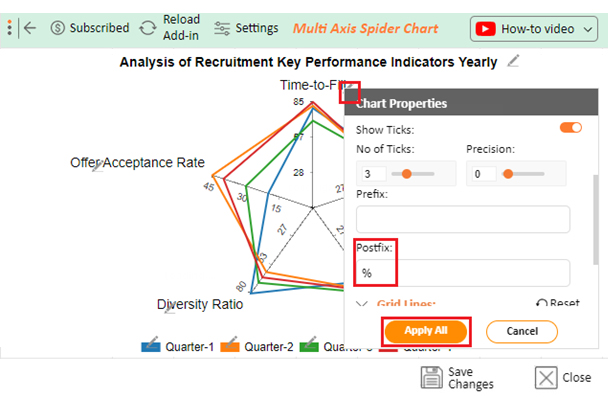
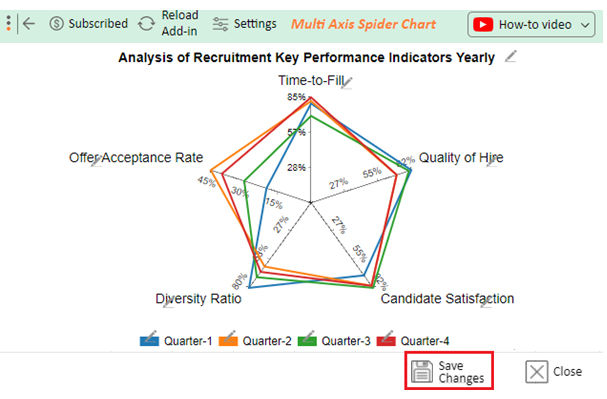
Let’s visualize this data in Excel with ChartExpo and glean valuable insights for data-driven decision-making.

  • To get started with ChartExpo, install ChartExpo in Excel.
  • Now Click on My Apps from the INSERT menu.
insert chartexpo in excel
  • Choose ChartExpo from My Apps, then click Insert.
open chartexpo in excel
  • Once it loads, scroll through the charts list to locate and choose the “Multi-Axis Spider Chart”.
Search Funnel Chart ce514
  • Click the “Create Chart From Selection” button after selecting the data from the sheet, as shown.
Create Chart From Selection ce514
  • ChartExpo will generate the visualization below for you.
Recruitment key performance indicators-Template
  • If you want to add anything to the chart, click the Edit Chart button:
  • Click the pencil icon next to the Chart Header to change the title.
  • It will open the properties dialog. Under the Text section, you can add a heading in Line 1 and enable Show.
  • Give the appropriate title of your chart and click the Apply button.
Apply Tittle on Chart ce514
  • Add the percentage sign with the axes values.
Add Percentage Sign ce514
  • Click the “Save Changes” button to persist the changes made to the chart.
Save Changes ce514
  • Your final Multi Axis Spider Chart will look like the one below.
Final Recruitment key performance indicators

Insights

  • Time-to-Fill: Shows an uptick from Q1 to Q4, implying possible delays in the hiring process.
  • Quality of Hire: Displays fluctuations, reaching a peak in Q3, signaling enhanced candidate suitability.
  • Candidate Satisfaction: Varies across quarters, reaching its highest in Q2, reflecting diverse candidate experiences.
  • Diversity Ratio: Maintains a steady trend, highlighting a need for improvement in promoting diversity.
  • Offer Acceptance Rate: Experiences a decline from Q2 to Q4, indicating potential challenges in securing candidate acceptances.

FAQs

How do you measure recruiting performance?

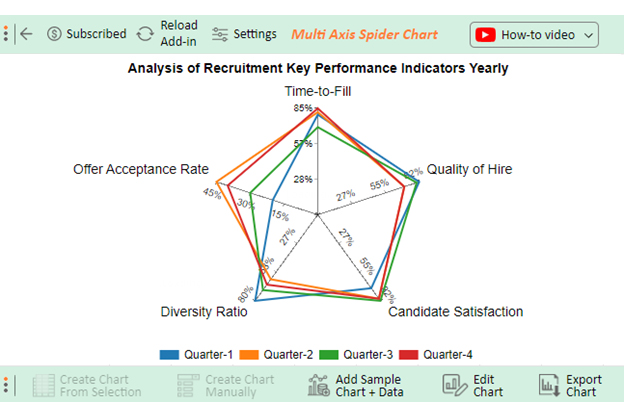
Recruiting performance is measured through recruitment Key Performance Indicators (KPIs). Examples of these KPIs include Time-to-Fill, Cost-per-Hire, Quality-of-Hire, Applicant Satisfaction, and Offer Acceptance Rate. These KPIs assess efficiency, cost-effectiveness, candidate suitability, candidate experiences, and the success of securing candidate acceptances, respectively.

What are important KPIs to monitor during and after the recruiting process?

During the recruiting process, monitor Time-to-Fill, Cost-per-Hire, Source-of-Hire, and Applicant Satisfaction. After recruitment, focus on KPIs like Quality-of-Hire, Retention Rate, and Employee Performance to measure the hiring decisions’ success.

What is the difference between recruiting KPIs and metrics?

Recruiting KPIs (Key Performance Indicators) are strategic, measurable indicators aligned with organizational goals, like Quality-of-Hire. Metrics are quantifiable data points, like Time-to-Fill, providing specific details about the recruitment process. KPIs offer a broader, goal-oriented perspective, while metrics offer detailed insights.

Wrap Up

Recruitment Key Performance Indicators (KPIs) serve as the North Star for effective talent acquisition. These metrics, from Time-to-Fill to Quality-of-Hire, offer insights into the effectiveness, efficiency, and success of the recruitment process.

The significance of monitoring KPIs extends beyond mere data points. It lies in the strategic alignment of recruitment practices with organizational goals. Cost-per-hire and Source-of-Hire metrics offer granular details, while broader indicators like Applicant Satisfaction provide a holistic view.

Quality-of-hire and Retention Rates emerge as pivotal touchpoints in the post-recruitment phase, unveiling the impact of hiring decisions. KPIs, unlike static benchmarks, dynamically adapt, offering real-time feedback on the pulse of recruitment efforts.

The essence of KPI tracking goes beyond the mere fulfillment of roles. It’s about securing the right talent, fostering diversity, and ensuring sustainable success. Therefore, understanding the nuances of recruiting KPIs can help you pivot, refine, and innovate your recruitment process. Consequently, your talent acquisition efforts will be dynamic, strategic, and aligned with the ever-evolving goals of the business.

With ChartExpo, these KPIs transform from static figures into dynamic visual narratives. This offers a comprehensive and accessible view of recruiting performance.

Do not hesitate.

Embrace the recruitment KPIs with ChartExpo to steer recruitment success with data-driven precision.

How much did you enjoy this article?

ExcelAd2
Start Free Trial!
133410

Related articles

next previous
Microsoft Excel8 min read

Excel Task Tracker Template for Smarter Task Insights

Task tracker template in Excel organizes tasks, tracks deadlines, and boosts efficiency. Learn its benefits, and explore expert tips to simplify task management.

Microsoft Excel10 min read

Invoice Tracker Template in Excel for Better Insights

An invoice tracker Excel template helps track invoices, due dates, and payments. Learn how to use this template for better financial management.

Microsoft Excel12 min read

Key Performance Indicators in Healthcare for Better Insights

Key Performance Indicators in healthcare track patient care and efficiency. Learn about these KPIs, top examples, and how to use them to improve outcomes.

Microsoft Excel10 min read

BMI Calculation Formula in Excel for Better Fitness Insights

The BMI calculation formula in Excel helps track and analyze body mass index. Explore step-by-step instructions and tips to simplify BMI tracking in Excel.

Microsoft Excel29 min read

How to Create a Tornado Chart in Excel? A Complete Guide

Click to learn how to plot a Tornado Chart in Excel using easy-to-follow steps. Also, we’ll address the following question: what is a Tornado Diagram?

ChartExpo logo

Turn Data into Visual
Stories

CHARTEXPO

  • Home
  • Gallery
  • Videos
  • Services
  • Pricing
  • Contact us
  • FAQs
  • Privacy policy
  • Terms of Service
  • Sitemap

TOOLS

  • ChartExpo for Google Sheets
  • ChartExpo for Microsoft Excel
  • Power BI Custom Visuals by ChartExpo
  • Word Cloud

CATEGORIES

  • Bar Charts
  • Circle Graphs
  • Column Charts
  • Combo Charts
  • Comparison Charts
  • Line Graphs
  • PPC Charts
  • Sentiment Analysis Charts
  • Survey Charts

TOP CHARTS

  • Sankey Diagram
  • Likert Scale Chart
  • Comparison Bar Chart
  • Pareto Chart
  • Funnel Chart
  • Gauge Chart
  • Radar Chart
  • Radial Bar Chart
  • Sunburst Chart
  • see more
  • Scatter Plot Chart
  • CSAT Survey Bar Chart
  • CSAT Survey Chart
  • Dot Plot Chart
  • Double Bar Graph
  • Matrix Chart
  • Multi Axis Line Chart
  • Overlapping Bar Chart
  • Control Chart
  • Slope Chart
  • Clustered Bar Chart
  • Clustered Column Chart
  • Box and Whisker Plot
  • Tornado Chart
  • Waterfall Chart
  • Word Cloud
  • see less

RESOURCES

  • Blog
  • Resources
  • YouTube
SIGN UP FOR UPDATES

We wouldn't dream of spamming you or selling your info.

© 2025 ChartExpo, all rights reserved.