Categories
You’ve conducted a survey with Microsoft Forms, and an overwhelming number of responses have poured in. Though eager to examine the results, you face a predicament: the data is messy.


You have rows and columns of information and are unsure where to start.
How can you make sense of it all?
Fear not, for Excel is here to save the day. You can turn that jumbled mess of data into a clear, concise analysis with just a few clicks. One that will help you make informed business decisions.
Whether you’re forecasting sales, managing your pipeline, or planning territories, Excel will help you do it all.
And the best part?
You don’t have to be a data scientist to do it. Also, it doesn’t matter whether you’re a seasoned Excel pro or a newbie. This blog post will guide you through analyzing Microsoft Forms templates data in Excel.
Microsoft Forms templates refer to pre-designed surveys or form templates provided by Microsoft Forms. Microsoft Forms is a web-based application for creating surveys, quizzes, and questionnaires.
These templates offer ready-made structures and layouts that you can customize. Then use it as a starting point for creating surveys or forms.
Microsoft Forms templates offer several benefits that make them valuable for various purposes:
Time-saving: Microsoft Forms Templates provide pre-designed structures and layouts, saving you time and effort in creating a survey from scratch. You select a template and customize it to fit your needs rather than starting from a blank canvas.
Professional appearance: Microsoft Forms Templates are designed with aesthetics in mind, ensuring a professional and appealing look for your surveys. This helps create a positive impression on respondents and enhances the overall user experience.
Guidance and structure: Microsoft Forms Templates provide a predefined format and organization, guiding you in formulating practical questions and sections. They provide a framework for ensuring that your survey or form covers all necessary aspects. Also, ensuring it follows a logical flow.
Diverse topics and purposes: Microsoft Forms templates cover various topics and objectives, catering to different needs. This variety allows you to find a template that closely aligns with your goals and requirements.
Customizability: While templates offer a starting point, you can easily customize them to suit your preferences. You can modify the questions, add or remove sections, and personalize the design elements.
Microsoft Forms templates comprise various elements contributing to their overall structure and functionality. These elements include:
Templates provide a predefined structure for organizing questions and sections within the form. This structure ensures logical flow and easy navigation for respondents.
Microsoft Forms templates offer a range of question types to choose from. Examples include multiple-choice, rating scales, text fields, dropdown menus, and more. These question types cater to different data collection needs and allow diverse response options.
Microsoft Forms templates offer pre-configured layouts, color schemes, fonts, and visual elements. Design and theme options enable customization of the form’s appearance. Consequently, allowing you to align it with your brand and create an engaging visual experience.
Templates often include instructional text or guidance to help respondents understand how to complete the form effectively. Instructions may provide context, clarify expectations, or offer guidance on specific question types.
Microsoft Forms templates provide sample questions related to the topic or purpose of the form. These sample questions can serve as inspiration, or you can modify them to suit your specific needs.
Advanced templates may include pre-built logic and branching capabilities. This allows you to set up conditional rules based on respondents’ answers, guiding them through a tailored path. Or skipping irrelevant sections based on their previous responses.
Microsoft Forms templates have a wide range of use cases across different domains and purposes. Some common use cases for Microsoft Forms templates include:
Microsoft Forms Templates for surveys and feedback collection enable gathering valuable insights from employees, customers, or other stakeholders.
These templates offer a structured format for posing questions and capturing responses. As a result, it helps with data-driven decision-making and process optimization.
Microsoft Forms Templates for quizzes and assessments are useful for educational institutions, trainers, or anyone seeking to create interactive assessments.
These templates include question types like multiple-choice, true/false, or short answer. This allows for quick and easy creation of quizzes and assessments.
Microsoft Forms Templates for registrations and event management streamline the collection of participant information for events, workshops, or conferences. These templates often include fields for name, contact details, dietary preferences, and other relevant information.
Templates tailored for data collection and research purposes enable you to collect and analyze data efficiently. They can include a variety of question types, such as Likert scales, ranking questions, or open-ended responses.
Microsoft Forms Templates focused on employee surveys and polls help you gather feedback from your workforce on various topics. Such topics include job satisfaction, training needs, and team collaboration. These templates provide an effective way to engage employees and gather their opinions.
Microsoft Forms templates aimed at customer satisfaction and service feedback assist in collecting valuable customer feedback. They often include rating scales, comment boxes, or Net Promoter Score (NPS) questions.
This enables you to assess customer satisfaction levels and make improvements accordingly.
Templates designed for incident reporting and issue tracking facilitate the systematic capture of incidents, problems, or concerns. These templates typically include fields for describing the issue, its severity, and relevant details. This allows for efficient tracking and resolution.
Templates on training and course evaluations enable trainers and educators to gather feedback on training programs, workshops, or courses. They include questions related to the effectiveness of the training, instructor feedback, or suggestions for improvement.
To create a Microsoft Forms template, follow these steps:
One key advantage of using Microsoft Forms is its seamless integration with Microsoft applications, such as Excel. By collecting responses from respondents, Microsoft Forms generates valuable data that you can analyze in Excel.
However, visualizing and analyzing the survey data in Excel is challenging. This is where ChartExpo comes into play.
ChartExpo for Excel add-in enables you to create insightful survey charts in just a few clicks. You can therefore say goodbye to boring spreadsheets and hello to dynamic visual insights.
Benefits of Using ChartExpo
How to Install ChartExpo in Excel?
ChartExpo charts and graphs are available both in Google Sheets and Microsoft Excel. Please use the following CTAs to install the tool of your choice and create beautiful visualizations with a few clicks in your favorite tool.


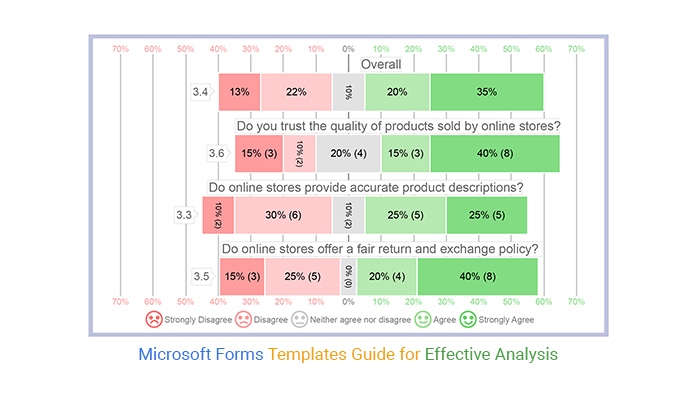
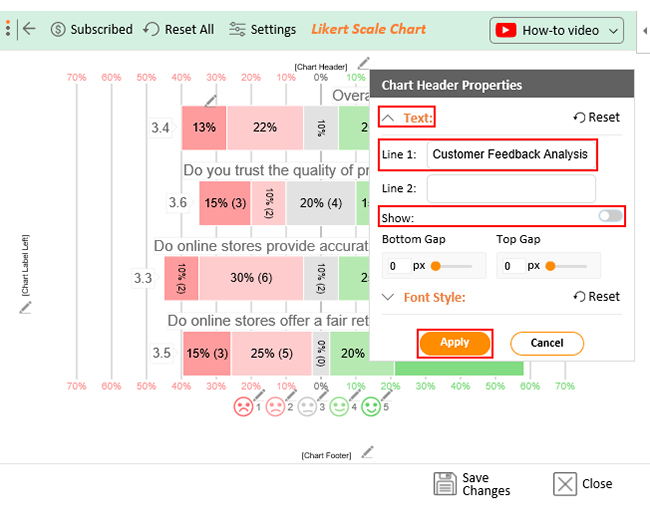
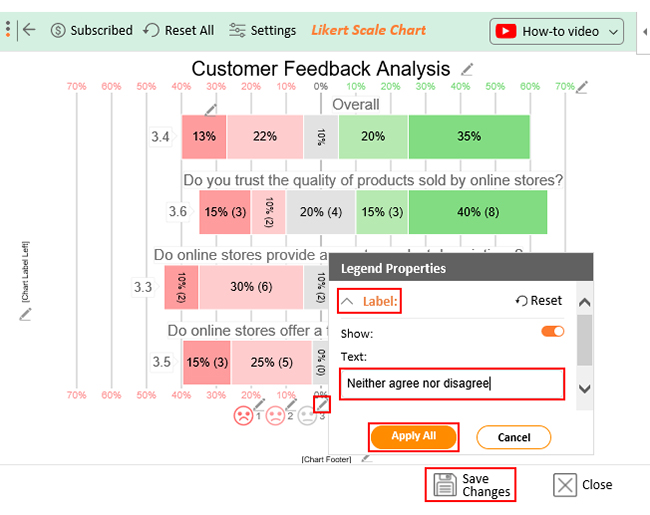
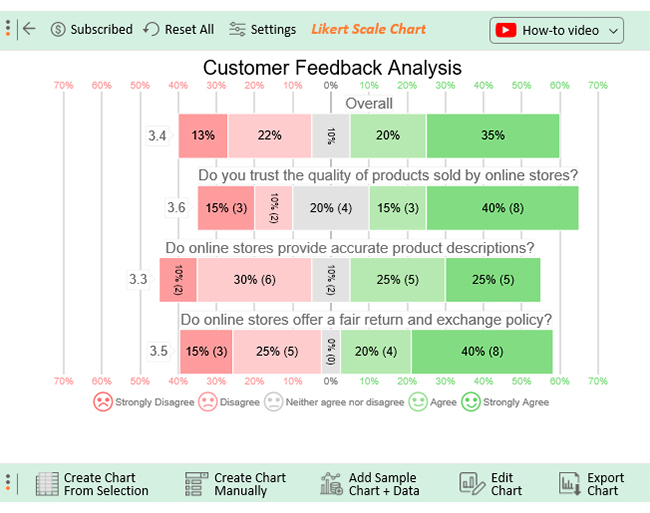
Let’s say you run an online store and have created a survey template for customer feedback. Your template has the following questions.
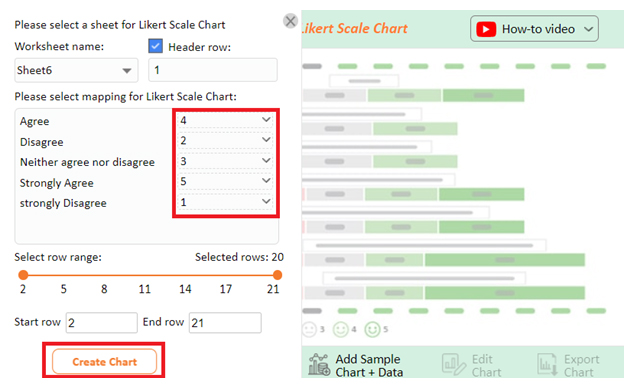
You have mapped the Likert scale below on each question.
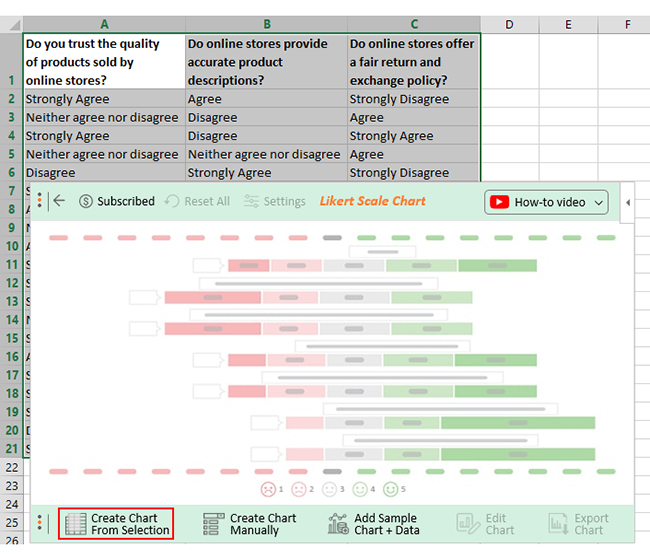
Upon getting customer feedback, you can organize the data in a table as below.
| Do you trust the quality of products sold by online stores? | Do online stores provide accurate product descriptions? | Do online stores offer a fair return and exchange policy? |
| Strongly Agree | Agree | Strongly Disagree |
| Neither agree nor disagree | Disagree | Agree |
| Strongly Agree | Disagree | Strongly Agree |
| Neither agree nor disagree | Neither agree nor disagree | Agree |
| Disagree | Strongly Agree | Strongly Disagree |
| Strongly Agree | Disagree | Strongly Agree |
| Agree | Strongly Agree | Agree |
| Neither agree nor disagree | Strongly Agree | Disagree |
| Agree | Disagree | Strongly Agree |
| Strongly Agree | Strongly Disagree | Strongly Agree |
| Strongly Disagree | Agree | Disagree |
| Strongly Agree | Neither agree nor disagree | Strongly Disagree |
| Neither agree nor disagree | Disagree | Disagree |
| Strongly Agree | Strongly Agree | Strongly Agree |
| Agree | Agree | Agree |
| Strongly Disagree | Agree | Disagree |
| Strongly Agree | Strongly Agree | Strongly Agree |
| Strongly Agree | Strongly Disagree | Strongly Agree |
| Disagree | Agree | Strongly Agree |
| Strongly Disagree | Disagree | Disagree |
This table contains example data. Expect many responses and questions in real life.


Yes, Microsoft Forms provides a variety of templates you can use to create surveys, quizzes, polls, etc. These templates offer pre-designed questions and response formats, making it easier to create effective forms in no time.
A form is a digital document or tool used to collect information. A template is a pre-designed layout or structure you can customize and reuse. Templates provide a starting point for creating forms with predefined elements, saving time and effort.
Yes, you can customize Microsoft Forms templates to suit your specific needs. You can edit the pre-existing questions, add new questions, modify the form layout and design, and adjust settings.
Analyzing Microsoft Forms template data in Excel offers powerful insights and opportunities for data-driven decision-making. Following the above steps, you can easily extract and manipulate the data from your Forms templates. Consequently, gain deeper insights and draw meaningful conclusions.
You can effortlessly export your form responses to an Excel spreadsheet using the export feature in Microsoft Forms. This serves as a data source for further analysis.
Leveraging Excel’s powerful features lets you discover trends, patterns, and correlations in your data. As a result, it provides valuable insights that improve audience understanding and informed decision-making.
Additionally, Excel enables you to visualize your data through charts and graphs, making gleaning insights easier.
To truly unlock the hidden insights, leveraging tools like ChartExpo take your analysis to the next level. ChartExpo for Excel lets you visualize your Microsoft Forms template data intuitively and effectively.
With a few clicks, you can create dynamic visualizations that captivate your audience and drive impactful decision-making. Say goodbye to the headache of creating insightful visuals and hello to a world of effortless chart-making.
How much did you enjoy this article?


Google Forms to Google Sheets keeps your data organized and current with every submission. Learn the steps, methods, and tips now!

Product survey questions reveal what customers truly think. Learn how to ask the right ones and act on the survey results. Read on!

Learn how the 5-Point Performance Rating Scale improves employee evaluations with clear, consistent, and fair performance reviews across teams.


