• Home
  • Tools dropdown img
    • Spreadsheet Charts

      • ChartExpo for Google Sheets
      • ChartExpo for Microsoft Excel
    • Power BI Charts

      • Power BI Custom Visuals by ChartExpo
    • Word Cloud

  • Charts dropdown img
    • Chart Category

      • Bar Charts
      • Circle Graphs
      • Column Charts
      • Combo Charts
      • Comparison Charts
      • Line Graphs
      • PPC Charts
      • Sentiment Analysis Charts
      • Survey Charts
    • Chart Type

      • Box and Whisker Plot
      • Clustered Bar Chart
      • Clustered Column Chart
      • Comparison Bar Chart
      • Control Chart
      • CSAT Survey Bar Chart
      • CSAT Survey Chart
      • Dot Plot Chart
      • Double Bar Graph
      • Funnel Chart
      • Gauge Chart
      • Likert Scale Chart
      • Matrix Chart
      • Multi Axis Line Chart
      • Overlapping Bar Chart
      • Pareto Chart
      • Radar Chart
      • Radial Bar Chart
      • Sankey Diagram
      • Scatter Plot Chart
      • Slope Chart
      • Sunburst Chart
      • Tornado Chart
      • Waterfall Chart
      • Word Cloud
    • Google Sheets
      Microsoft Excel
  • Services
  • Pricing
  • Contact us
  • Blog
  • Support dropdown img
      • Gallery
      • Videos
      • Contact us
      • FAQs
      • Resources
    • Please feel free to contact us

      atsupport@chartexpo.com

Categories
All Data Visualizations Data Analytics Surveys
Add-ons/
  • Google Sheets
  • Microsoft Excel
  • Power BI
All Data Visualizations Data Analytics Surveys
Add-ons
  • Google Sheets
  • Microsoft Excel
  • Power BI

We use cookies

This website uses cookies to provide better user experience and user's session management.
By continuing visiting this website you consent the use of these cookies.

Ok

ChartExpo Survey


Home > Blog > Data Analytics

Margin of Safety Ratio: What You Need to Know

What is the margin of safety ratio?

Picture this: You’re on the road while it’s raining, and the surface is slick. How much slower do you drive to avoid skidding?

Margin of Safety Ratio

That cautious approach is your margin of safety.

In finance, the margin of safety ratio works similarly. It’s a tool to help investors explore the unpredictable terrain of the stock market with a safety buffer.

Suppose you are considering investing in Company X. The margin of safety ratio will tell how far the company’s price can fall before investing becomes a gamble. If Benjamin Graham and Warren Buffet swear by this ratio, what could go wrong?

This ratio protected millions of investors during the 2008 financial crisis. Those who adhered to the principle of maintaining a substantial margin of safety were more prepared to withstand the crisis. Furthermore, research shows that the long-term outperformance of companies with a high MOS is consistent with higher returns.

Whether you are experienced or new to investing doesn’t matter. Understanding the margin of safety ratio is crucial for making wise investment choices. This blog post explores the importance of this tool for investors.

Table of Contents:

  1. What is the Margin of Safety?
  2. Understanding Margin of Safety Ratio
  3. What is the Importance of the Margin of Safety?
  4. How to Calculate the Margin of Safety Ratio?
  5. How to Evaluate Margin of Safety?
  6. Wrap Up

First…

What is the Margin of Safety?

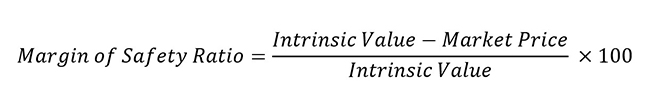
Definition: The margin of safety is a financial concept investors use to mitigate risks. It is the difference between the intrinsic value of a stock and its market price.

Simply speaking, you should purchase the stock at a much lower price than its real value. Why? To avoid major losses in case expectations are wrong or the market crashes. Benjamin Graham popularized this idea.

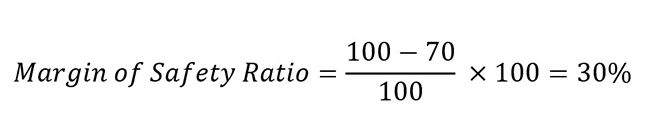
Imagine the internal value of a stock reaches $100, and you bought this stock for $70. The margin of safety here is $30. The purpose of MOS is to leave some space for calculation mistakes or negative market conditions.

The margin of safety can fluctuate greatly depending on the investor’s demands and level of risk. Investors must calculate return on investment capital, as this helps assess potential gains while emphasizing cautious investment. By focusing on undervalued stocks, investors can ensure a lower risk of loss.

Overall, the margin of safety is crucial for conservative investors seeking long-term gains while protecting against downside risk.

Understanding Margin of Safety Ratio

The margin of safety principle was made well-known by renowned British-American investor Benjamin Graham and his followers, particularly Warren Buffett.

Investors use a combination of qualitative and quantitative factors to assess a security’s intrinsic value. Subsequently, the market price is utilized as the reference point for determining the margin of safety. Buffett, a strong supporter of the margin of safety, considers it a key principle in investing. He often sets his price target by discounting the intrinsic value of a stock by up to 50%.

Considering a margin of safety while making investments helps protect against mistakes in analyst assessments or calculations. However, a profitable investment is not guaranteed, as evaluating a company’s intrinsic value is often subjective. Investors and analysts often have varying approaches to determining intrinsic value, which may not always be precise or accurate. Furthermore, forecasting a company’s earnings or revenue is famously challenging.

What is the Importance of the Margin of Safety?

The margin of safety is a fundamental concept in investing that provides a buffer against potential losses. It involves buying securities at a price significantly below their intrinsic value. This approach helps investors manage risk and achieve more stable returns. Here are the key reasons why the margin of safety is important:

  • Risk mitigation: The margin of safety reduces the risk of loss by providing a cushion against market fluctuations and valuation errors. Purchasing assets below their intrinsic value reduces the likelihood of suffering significant losses if the market turns against you.
  • Preservation of capital: One of the primary goals of investing is to preserve capital. The margin of safety helps ensure the invested capital is protected. That is, even if the investment does not perform as expected. This conservative approach prioritizes safeguarding investments.
  • Enhanced return potential: Buying securities at a discounted price increases the potential for higher returns. As the market recognizes the true value of the investment, the price may rise, providing substantial gains. The margin of safety thus boosts the upside potential of investments.
  • Psychological comfort: Investing with a margin of safety offers psychological comfort. Knowing that an investment was made with a buffer against risk can reduce anxiety. Moreover, it can help you remain patient and focused during market volatility. This emotional stability is crucial for long-term success.
  • Long-term perspective: The margin of safety encourages a long-term investment perspective. Investors tend to hold investments for extended periods by focusing on intrinsic value and purchasing undervalued assets. Why? To benefit from compounding returns and reduced transaction costs.
  • Value investing principle: The margin of safety is a core principle of value investing. This strategy, popularized by Benjamin Graham and Warren Buffett, emphasizes buying undervalued stocks to maximize returns and minimize risk. It aligns with a disciplined, research-driven approach to investing.

How to Calculate the Margin of Safety Ratio?

The margin of safety ratio is necessary for investors in their bid to reduce risk and increase potential returns. This ratio represents the difference between the security’s intrinsic value and the market price. The process of how to calculate the margin of safety ratio is outlined below:

  1. Calculate the intrinsic value: Find out the investment’s intrinsic value. The intrinsic value is an estimate of the current value of the asset. The market calculates it through discounted cash flow (DCF) analysis, earnings multiples, or asset-based valuations.
  2. Find market price: Next, find the investment’s current market price. The market price can be obtained from financial news, stock exchanges, or trading platforms.
  3. Calculate Margin of Safety Ratio: Finally, calculate the margin of safety ratio using the following margin of safety formula:
Margin of Safety Ratio Formula

          The margin of safety example calculation:

          Let’s say the intrinsic value of a stock is $100 and its market price is $70, the calculation would be:

Margin of Safety Ratio Calculation
  1. Interpretation: A higher margin of safety ratio indicates a greater cushion against potential losses. For instance, a 30% margin of safety means the market price is 30% below the intrinsic value. This provides significant protection against valuation errors or market downturns. Conversely, a low or negative margin of safety suggests higher risk and less protection.

How to Evaluate Margin of Safety?

Ah, data analysis – the puzzle that never seems to solve itself. Now, throw in the margin of safety, and suddenly, you’re in a data maze without a map. This is where data visualization swoops in like a superhero.

Data visualizations unravel the complexities and reveal the patterns hidden within the numbers. Yet, poor Excel, the trusty sidekick, falls short when bringing the margin of safety to life.

But fear not; we have ChartExpo. ChartExpo revolutionizes data visualization and rescues you from drowning in a sea of uninspiring charts and graphs.

Let’s learn how to install ChartExpo in Excel.

  1. Open your Excel application.
  2. Open the worksheet and click the “Insert” menu.
  3. You’ll see the “My Apps” option.
  4. In the Office Add-ins window, click “Store” and search for ChartExpo on my Apps Store.
  5. Click the “Add” button to install ChartExpo in your Excel.

ChartExpo charts are available both in Google Sheets and Microsoft Excel. Please use the following CTAs to install the tool of your choice and create beautiful visualizations with a few clicks in your favorite tool.

Example

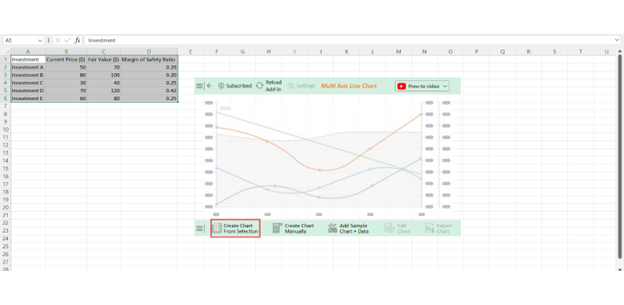
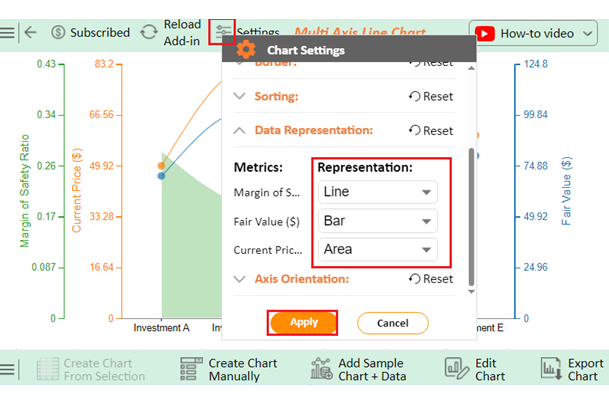
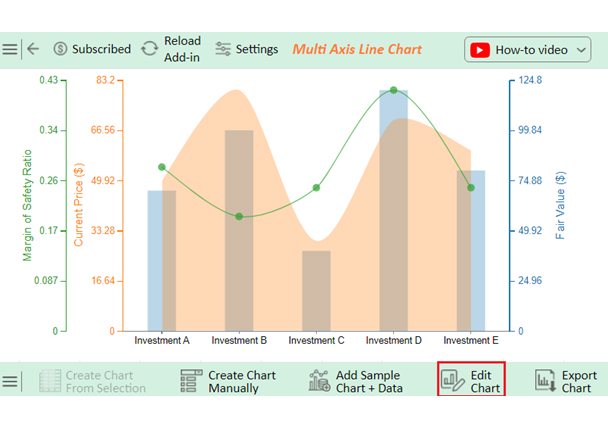
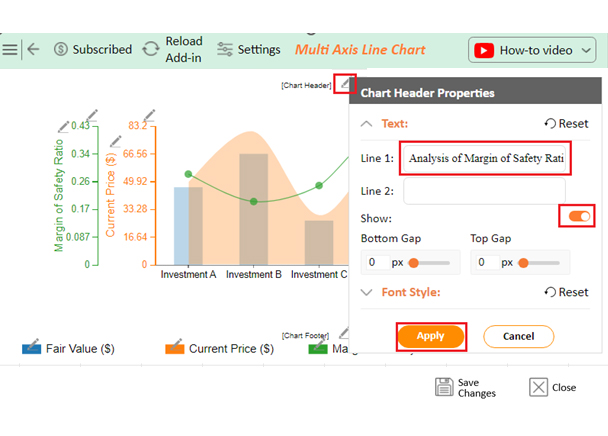
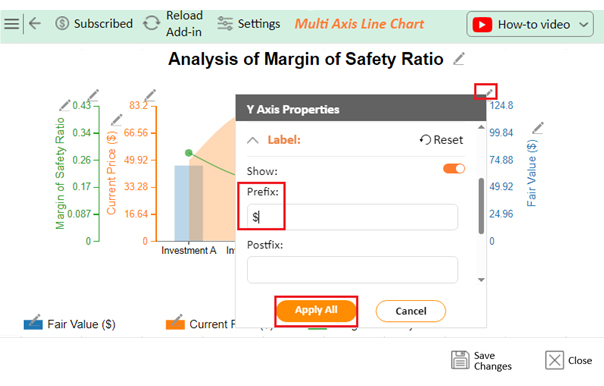
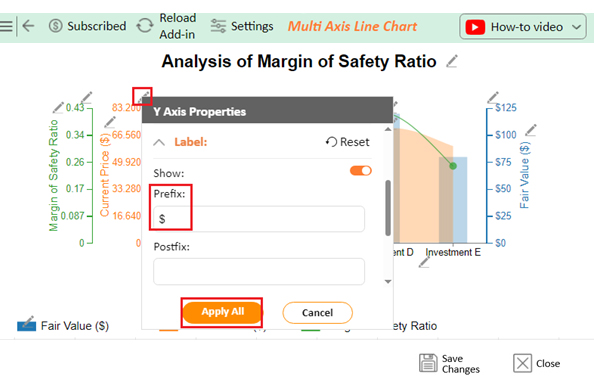
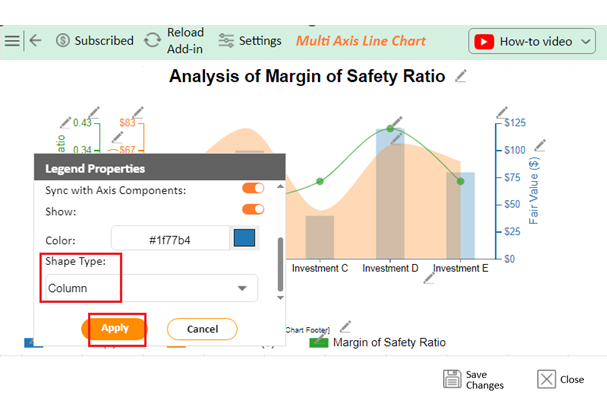
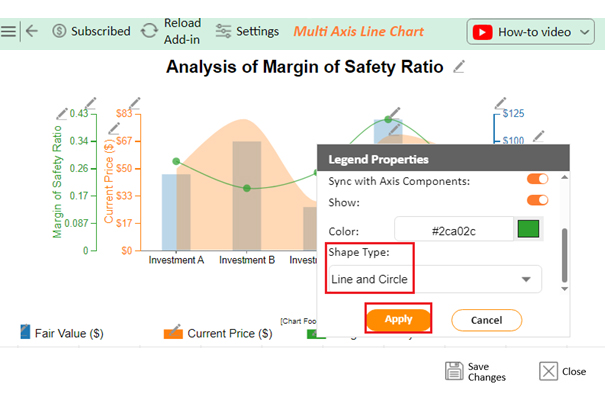
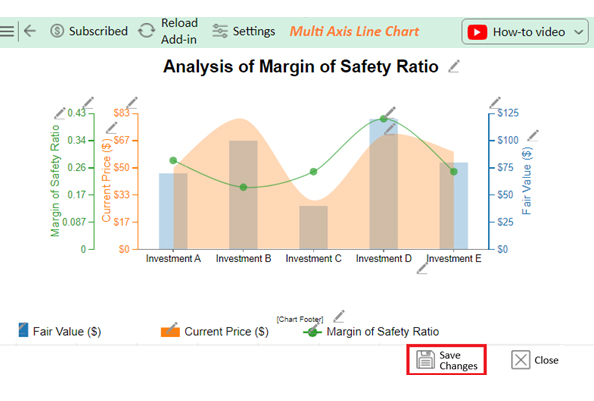
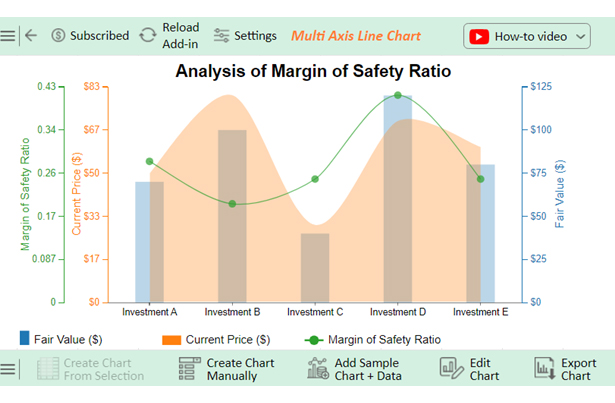
Let’s analyze the margin of safety ratio example data below using ChartExpo.

Investment Current Price ($) Fair Value ($) Margin of Safety Ratio
Investment A 50 70 0.29
Investment B 80 100 0.20
Investment C 30 40 0.25
Investment D 70 120 0.42
Investment E 60 80 0.25
  • To get started with ChartExpo, install ChartExpo in Excel.
  • Now Click on My Apps from the INSERT menu.
insert chartexpo in excel
  • Choose ChartExpo from My Apps, then click Insert.
open chartexpo in excel
  • Once it loads, scroll through the charts list to locate and choose the “Multi-Axis Line Chart”.
search multi axis line chart in excel
  • Click the “Create Chart From Selection” button after selecting the data from the sheet, as shown.
Click Create Chart From Selection for Visual Margin of Safety Ratio
  • ChartExpo will generate the visualization below for you.
Initial Visual of Margin of Safety Ratio
  • Click on Settings and change the “Data Representation” as follows.
Change Data Representation for Visual Margin of Safety Ratio
  • If you want to add anything to the chart, click the Edit Chart button:
Edit Chart for Visual Margin of Safety Ratio
  • Click the pencil icon next to the Chart Header to change the title.
  • It will open the properties dialog. Under the Text section, you can add a heading in Line 1 and enable Show.
  • Give the appropriate title of your chart and click the Apply button.
Add Chart Header for Visual Margin of Safety Ratio
  • Add the dollar sign with Fair Value:
Add Prefix Fair Value for Visual Margin of Safety Ratio
  • Add the dollar sign with the Current Price:
Add Prefix Current Price for Visual Margin of Safety Ratio
  • Change the Legend shape of Fair Value to Column and click the Apply button.
Change Legend Shape of Fair Value for Visual Margin of Safety Ratio
  • Change the Legend shape of the Margin of Safety Ratio into a Line and Circle and click the Apply button.
Change Legend Shape of Margin of Safety Ratio for Visual Margin of Safety Ratio
  • Click the Save Changes button to persist the changes made to the chart.
Save Changes for Visual Margin of Safety Ratio
  • Your final Multi Axis Line Chart will look like the one below.
Final Visual Margin of Safety Ratio

Insights

  • Investment A represents an undervalued asset with a Margin of Safety of 29%. The ascribed Fair Value is $70, whereas the Current Price equals $50.
  • Investment D is 42% safer than other ventures since it has the best MoS. The Current Price is $70, and the Fair Value is $120.
  • Investment B’s safety is 20% (Current Price: $80, Fair Value: $100).
  • Investment E has a 25% Margin of Safety (Present Price: $60, Estimated Value: $80).

FAQs

What does a 20% margin of safety mean?

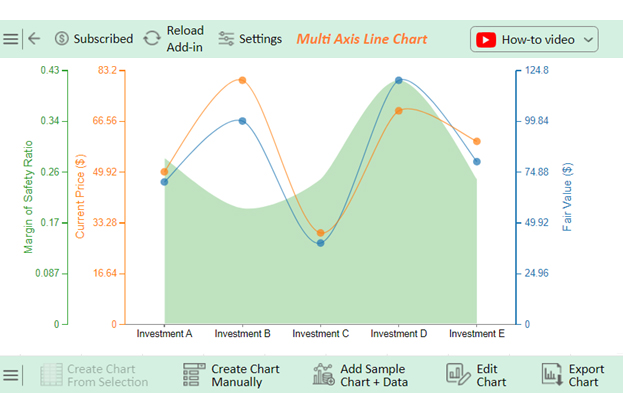
A 20% margin of safety means the market price is 20% below the investment’s intrinsic value. This provides a buffer against errors in valuation or market downturns, reducing the risk of potential losses.

What is a good margin of safety?

A good margin of safety is typically around 20-30%. This range provides a significant cushion against market volatility and valuation errors. It ensures the investment has a reasonable buffer to protect against potential risks and downturns.

How do we interpret the margin of safety?

To interpret the margin of safety, consider the percentage difference between the market price and intrinsic value. A higher margin of safety indicates a larger buffer against potential losses. Conversely, a lower margin suggests higher risk and less protection for investors.

Wrap Up

The margin of safety ratio is essential to investors, especially when financial markets are volatile. This ratio quantifies the cushion available to an investor to cover possible losses.

A higher margin of safety ratio signifies a larger gap between the investment’s market price and intrinsic value. This indicates a lower risk of loss. Investors often seek investments with substantial safety margins to protect their capital in case of market downturns. Or in the case of valuation errors.

The margin of safety ratio safeguards against the inherent uncertainties in investing. Buying securities below their intrinsic value creates a buffer that helps absorb adverse market movements and unforeseen events. This enhances the resilience of your portfolio.

This ratio falls in line with value investing. One of its tenets is buying assets fairly cheaply from their intrinsic values. Value investors seek investments with the highest MOS to mitigate risk while maximizing long-term returns.

The margin of safety is, therefore, a key element to ensure better risk-taking and investment. It measures how much an investment item is undervalued. Moreover, it provides an investment measure to invest in items offering more denotation and promising growth.

Do not hesitate.

Include this ratio in your strategies to obtain sturdy portfolios to survive market recessions and turmoil.

How much did you enjoy this article?

GSAd1
Start Free Trial!
135880

Related articles

next previous
Data Analytics31 min read

Data Analysis Without Nonsense: Fix the Right Problem, Fast

Data analysis can mislead when metrics look right but outcomes fail. Learn how to spot red flags, fix failures, and make better decisions. Read on!

Data Analytics29 min read

Variance Analysis Isn’t a Math Problem, It’s a Trust Problem

Variance analysis helps identify what went wrong, who owns it, and what to do next. Use it to drive decisions, not just reports. Learn more!

Data Analytics10 min read

Supplier Comparison Template: Download It Now

A supplier comparison template streamlines vendor evaluation by comparing cost and quality. Click here to learn its benefits and how to analyze them.

Data Analytics32 min read

Ecommerce Analytics: How to Fix What It Often Gets Wrong

Ecommerce analytics often lead to mixed signals and costly misreads. Fix attribution gaps, align teams, and act on the right data. Get started now!

Data Analytics30 min read

When Sales Funnel Breaks: Failures, Fixes, & Funnel Debt

Is your sales funnel hiding costly gaps? Learn how pipeline stalls, false metrics, and handoff chaos could be draining revenue. Get started now!

ChartExpo logo

Turn Data into Visual
Stories

CHARTEXPO

  • Home
  • Gallery
  • Videos
  • Services
  • Pricing
  • Contact us
  • FAQs
  • Privacy policy
  • Terms of Service
  • Sitemap

TOOLS

  • ChartExpo for Google Sheets
  • ChartExpo for Microsoft Excel
  • Power BI Custom Visuals by ChartExpo
  • Word Cloud

CATEGORIES

  • Bar Charts
  • Circle Graphs
  • Column Charts
  • Combo Charts
  • Comparison Charts
  • Line Graphs
  • PPC Charts
  • Sentiment Analysis Charts
  • Survey Charts

TOP CHARTS

  • Sankey Diagram
  • Likert Scale Chart
  • Comparison Bar Chart
  • Pareto Chart
  • Funnel Chart
  • Gauge Chart
  • Radar Chart
  • Radial Bar Chart
  • Sunburst Chart
  • see more
  • Scatter Plot Chart
  • CSAT Survey Bar Chart
  • CSAT Survey Chart
  • Dot Plot Chart
  • Double Bar Graph
  • Matrix Chart
  • Multi Axis Line Chart
  • Overlapping Bar Chart
  • Control Chart
  • Slope Chart
  • Clustered Bar Chart
  • Clustered Column Chart
  • Box and Whisker Plot
  • Tornado Chart
  • Waterfall Chart
  • Word Cloud
  • see less

RESOURCES

  • Blog
  • Resources
  • YouTube
SIGN UP FOR UPDATES

We wouldn't dream of spamming you or selling your info.

© 2025 ChartExpo, all rights reserved.