• Home
  • Tools dropdown img
    • Spreadsheet Charts

      • ChartExpo for Google Sheets
      • ChartExpo for Microsoft Excel
    • Power BI Charts

      • Power BI Custom Visuals by ChartExpo
    • Word Cloud

  • Charts dropdown img
    • Chart Category

      • Bar Charts
      • Circle Graphs
      • Column Charts
      • Combo Charts
      • Comparison Charts
      • Line Graphs
      • PPC Charts
      • Sentiment Analysis Charts
      • Survey Charts
    • Chart Type

      • Box and Whisker Plot
      • Clustered Bar Chart
      • Clustered Column Chart
      • Comparison Bar Chart
      • Control Chart
      • CSAT Survey Bar Chart
      • CSAT Survey Chart
      • Dot Plot Chart
      • Double Bar Graph
      • Funnel Chart
      • Gauge Chart
      • Likert Scale Chart
      • Matrix Chart
      • Multi Axis Line Chart
      • Overlapping Bar Chart
      • Pareto Chart
      • Radar Chart
      • Radial Bar Chart
      • Sankey Diagram
      • Scatter Plot Chart
      • Slope Chart
      • Sunburst Chart
      • Tornado Chart
      • Waterfall Chart
      • Word Cloud
    • Google Sheets
      Microsoft Excel
  • Services
  • Pricing
  • Contact us
  • Blog
  • Support dropdown img
      • Gallery
      • Videos
      • Contact us
      • FAQs
      • Resources
    • Please feel free to contact us

      atsupport@chartexpo.com

Categories
All Data Visualizations Data Analytics Surveys
Add-ons/
  • Google Sheets
  • Microsoft Excel
  • Power BI
All Data Visualizations Data Analytics Surveys
Add-ons
  • Google Sheets
  • Microsoft Excel
  • Power BI

We use cookies

This website uses cookies to provide better user experience and user's session management.
By continuing visiting this website you consent the use of these cookies.

Ok

ChartExpo Survey


Home > Blog > Google Sheets

How to Build an Investment Tracking Spreadsheet For Success?

Why use an investment tracking spreadsheet to manage your finances?

Tracking investments is essential for making informed decisions. A spreadsheet helps organize your portfolio and monitor performance. Investments can grow or decline quickly. A spreadsheet provides a clear view of your assets. It consolidates information like balances, returns, and fees in one place, saving time and ensuring accuracy.

Investment Tracking Spreadsheet

Managing finances is challenging without the proper tools. Studies show that 88% of spreadsheets are used for financial tasks. An investment tracking spreadsheet simplifies calculations and provides a snapshot of your portfolio.

With financial markets constantly changing, tracking is key. A spreadsheet helps identify trends and adjust strategies. It enables better decision-making, whether you’re a beginner or a seasoned investor.

Automation also plays a role. By integrating formulas and updates, you can reduce manual work, keeping your data reliable.

Using an investment tracking spreadsheet empowers you to take control of your finances. It’s a simple tool with significant benefits. Whether you monitor growth or plan future investments, it keeps you organized and informed.

Are you ready to optimize your portfolio? Let’s explore how;

Table of Content:

  1. What is an Investment Tracking Spreadsheet?
  2. Why Use an Investment Tracker Sheet?
  3. When to Use Google Sheets Investment Tracker?
  4. How to Use an Investment Tracking Spreadsheet?
  5. Benefits of a Simple Investment Tracking Spreadsheet Template
  6. Tips for Using Google Sheets for Investment Tracking
  7. How to Analyze and Download Investment Tracking Spreadsheet?
  8. Wrap Up

What is an Investment Tracking Spreadsheet?

Definition: An investment tracking spreadsheet is a powerful portfolio management tool. It helps you stay organized and facilitates data-driven decision-making. Whether new to investing or experienced, it keeps everything in one place.

How?

  • Track investments: A spreadsheet lets you log all your investments, from stocks to mutual funds. You can easily track where your money is and how it’s growing.
  • Monitor performance: A spreadsheet shows how each investment performs over time. It helps you identify what’s working and what’s not.
  • Organize data: An investment tracking spreadsheet centralizes your data. You can group assets by type, risk analysis, or goals.
  • Facilitate decision-making: Good data leads to smart decisions. With all your information in one place, you can plan better. It helps you decide when to buy, sell, or hold investments.

Why Use an Investment Tracker Sheet?

An investment tracker sheet is a must-have for managing your portfolio effectively. It brings clarity and structure to your financial goals, keeping you informed and in control.

How?

  • Comprehensive overview: An investment tracker sheet consolidates all your investments in one place. It gives you a complete snapshot of your portfolio, saving time and reducing confusion.
  • Performance analysis: Tracking performance becomes effortless. Monitor gains, losses, and trends to understand your investments’ performance.
  • Goal tracking: An investment tracker sheet helps you measure progress toward your goals, whether retirement, a home, or education.
  • Informed decision-making: Better data analytics means better choices. Use the insights from your tracker to make smarter investment decisions, like when to buy, sell, or hold.
  • Tax planning: Track dividends, capital gains, and other taxable events in your sheet to prepare for reporting.
  • Motivation and accountability: Seeing your progress can keep you motivated. Regular updates ensure you stay on track and committed to your investment plan.

When to Use Google Sheets Investment Tracker?

Are you wondering if a Google Sheets investment tracker is right for you? Let’s break it down. It’s simple, versatile, and works for all kinds of investors. Here are six great reasons to give it a shot:

  • Multiple investment accounts: A Google Sheets tracker lets you consolidate everything in one place. Whether it’s stocks, bonds, crypto, or real estate, you can monitor them all together.
  • Customizable tracking needs: Pre-built apps often feel rigid. But with Sheets, you’re the designer. Build charts, tweak formulas, or add fields that suit your unique financial goals.
  • Collaborative portfolio management: Are you managing investments with a partner or team? Google Sheets allows real-time collaboration. Share updates, compare strategies, and make decisions together—there’s no need for complicated tools.
  • Frequent updates: Stay up-to-date with dynamic tracking. Manually input data or link your sheet with live market updates using add-ons or APIs. It’s always accurate and real-time.
  • Budget-friendly solution: Why pay for expensive software when Google Sheets is free? It’s a cost-effective choice, perfect for maximizing your returns without added expenses.
  • Beginner or DIY investors: Are you new to investing or prefer hands-on business analytics and management? Google Sheets is the ultimate DIY tool. Start simple, learn as you go, and take full control of your financial journey.

How to Use an Investment Tracking Spreadsheet?

Managing your investments doesn’t have to be complicated. A spreadsheet can simplify everything, giving you full control over your finances. Here’s how to get started and maximize its potential:

  • Set up your spreadsheet and organize investments: Divide your spreadsheet into categories like stocks, real estate, or crypto. Create columns for essential details—investment name, type, amount, and value. Organizing your data upfront will save you time later.
  • Input data and keep it updated: Add all the relevant information about your investments—purchase dates, amounts, returns, fees, and more. Regularly update the sheet with the latest market values to maintain accuracy and get a real-time view of your portfolio.
  • Track performance with key metrics: Use built-in formulas to calculate growth, ROI, or dividend yields. Highlight trends to see how your investments perform over time. It allows you to identify winners and potential areas for improvement.
  • Create visualizations for clarity: Numbers can be daunting, but Google Sheets Charts make them clearer. Visual aids like pie charts reveal allocation, while line graphs highlight performance trends. These tools uncover patterns, enabling smarter, data-driven decisions.
  • Monitor goals and adjust regularly: Set financial goals, such as retirement savings or reaching a specific portfolio value. Use your spreadsheet to measure progress toward these milestones. Review and update the sheet regularly to stay aligned with your objectives and adapt to market changes.

What are the Benefits of a Simple Investment Tracking Spreadsheet Template?

Why complicate things when a simple solution works? An investment tracking spreadsheet offers powerful benefits without the hassle. Here’s why it’s worth trying:

  • Easy and efficient: It’s simple to set up and use, even if you’re not a spreadsheet wizard. Keep everything organized in one place without drowning in complexity.
  • Customizable and real-time updates: Tailor the template to match your needs. Regular updates also give you an up-to-date view of your portfolio’s performance.
  • Informed decision-making: Seeing all your data at a glance helps you spot trends and make smarter financial moves. It’s like having a personal assistant for your investments.
  • Budget-friendly with better discipline: A simple spreadsheet is cost-effective and helps you stay disciplined in monitoring and managing your finances.

What are the Tips for Using Google Sheets for Investment Tracking?

If you use it correctly, Google Sheets can do wonders for tracking your investments. Here are five tips to make your tracker powerful and stress-free:

  • Stay organized and secure: Keep your data neat with clear categories for each investment type. Use tools like filters and named ranges for easy navigation. Don’t forget to back up your spreadsheet and secure it with permission.
  • Use formulas and automation: Save time with formulas that calculate ROI, growth rates, or allocation percentages. Take it further by automating updates with Google Sheets add-ons or integrations. Let technology do the heavy lifting!
  • Bring your data to life: Transform raw data with visual storytelling. Use charts, graphs, or dashboards to convey your portfolio’s performance. These tools provide quick, clear insights that drive informed decisions.
  • Track progress toward goals: Set financial targets—like building an emergency fund or hitting a retirement milestone. Use your sheet to measure how close you are to achieving them.
  • Review and update regularly: A great tracker is only as good as the data it holds. Make it a habit to update and review your spreadsheet often. It’ll keep your strategy sharp and your investments on track.

How to Analyze and Download Investment Tracking Spreadsheet?

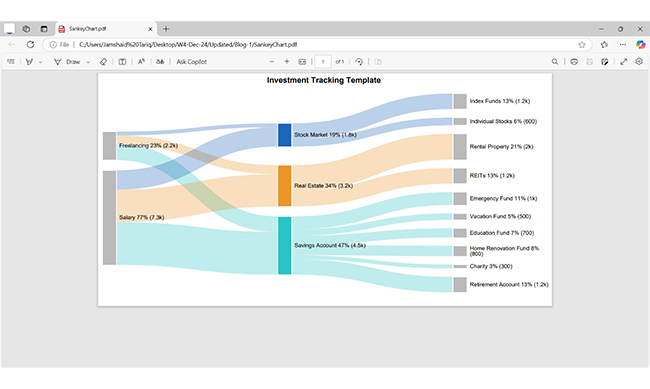
Tracking investments can feel overwhelming. Spreadsheets like Google Sheets are reliable but lack advanced visual analytics. Their basic charts fall short as portfolios grow in complexity.

Data visualization tools, like ChartExpo, fill this gap, offering clarity and actionable insights. ChartExpo turns raw data into stunning, interactive visuals, making analysis intuitive and decisions smarter. Let’s explore why using an investment tracking spreadsheet—and supercharging it with ChartExpo—is a game-changer.

Why use ChartExpo?

Want to make your data pop? ChartExpo turns complex numbers into visuals you can instantly understand. It’s simple, powerful, and perfect for anyone looking to level up their data storytelling game. Here’s why you should try it:

  • Endless chart options: This Google Sheets extension provides versatile options, from pie charts to Sankey diagrams. Whether simple or creative, it has a chart for every data story.
  • Effortless to use: ChartExpo is user-friendly, making it easy to create insightful, appealing visuals without a steep learning curve.
  • Interactive and engaging: With interactive features, you can explore your data and make presentations more dynamic.
  • Affordable and value-packed: ChartExpo gives you premium tools without breaking the bank. It’s a budget-friendly way to bring your data to life.

How to Install ChartExpo in Google Sheets?

  1. To start using ChartExpo, download it directly from the Google Sheets program. To do this, select Extensions from the top toolbar.
  2. A menu will appear. Click the Get add-ons option.
  3. Search for ChartExpo, and click on Charts, Graphs & Visualizations by ChartExpo when it appears in the results.
  4. Click the Install button. You will have to confirm your Google account and accept some permissions.

ChartExpo charts are available both in Google Sheets and Microsoft Excel. Please use the following CTAs to install the tool of your choice and create beautiful visualizations in a few clicks in your favorite tool.
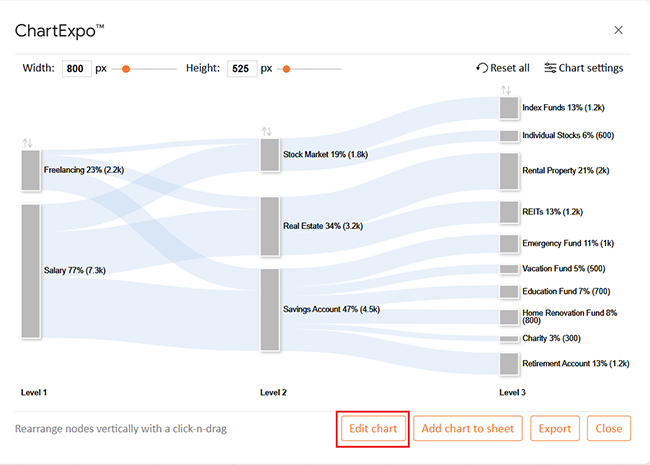
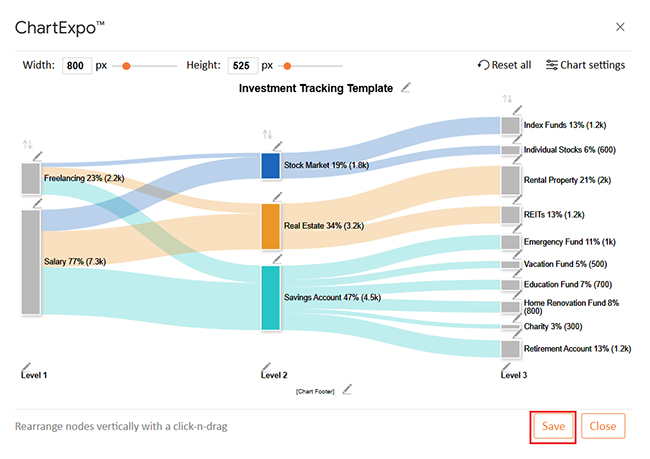
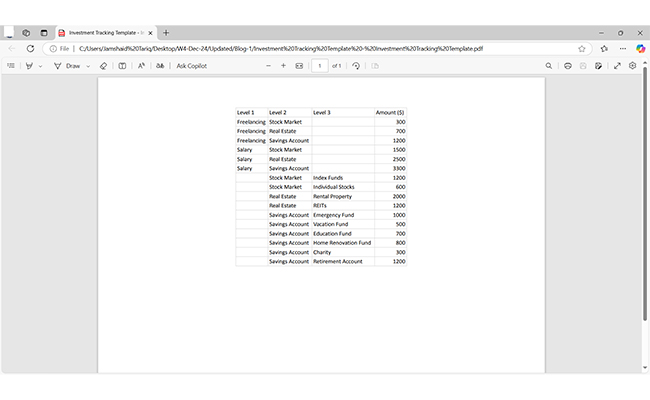
Example

Let’s see how to create a chart in Google Sheets using ChartExpo. We’ll use the sample data below.

Level 1 Level 2 Level 3 Amount ($)
Freelancing Stock Market 300
Freelancing Real Estate 700
Freelancing Savings Account 1200
Salary Stock Market 1500
Salary Real Estate 2500
Salary Savings Account 3300
Stock Market Index Funds 1200
Stock Market Individual Stocks 600
Real Estate Rental Property 2000
Real Estate REITs 1200
Savings Account Emergency Fund 1000
Savings Account Vacation Fund 500
Savings Account Education Fund 700
Savings Account Home Renovation Fund 800
Savings Account Charity 300
Savings Account Retirement Account 1200
  • To get started with ChartExpo, install ChartExpo in Google Sheets.
  • Go to Extensions > Charts, Graphs & Visualizations by ChartExpo > Open.
open chartexpo in google sheets
  • To access the charts library, click the Add new chart button.
add new chart in google sheets
  • Once ChartExpo is loaded. Click on “Sankey Chart”.
search sankey chart in google sheets
  • After selecting the sheet that contains your data, choose the Metrics option. Add the corresponding numbers.
  • To add dimensional data, click the Dimensions button and enter the desired values.
Create Chart From Selection ce746
  • Click the Create chart button to complete the process.
Apply Tittle on Chart ce746
  • Click the Edit chart button to make custom changes.
  • Click the pencil icon next to the Chart Header to change the chart’s title.
  • It will open the properties dialog. Under the Text section, you can add a heading in Line 1 and enable the Show option. Give the appropriate title of your chart and click the Apply button.
Disable Footer Label ce746
  • You can disable the Footer Label:
Change Color of Nodes ce746
  • You can change the colors of all Level 2 nodes as follows:
Change Legend Shapes ce746
  • Change all the legend shapes into circles and click the “Save” button:
Final Investment Tracking Spreadsheet
  • Your final chart will appear as shown below.
Final Investment Tracking Spreadsheet

Insights

  • Income sources: Freelancing and salary contribute a total of $7,500.
  • Savings: Allocated to retirement funds ($1,200) and emergency funds ($1,000).
  • Real estate: Focus on rental properties with an investment of $2,000.
  • Stock market: Primarily invested in index funds totaling $1,200.

Download the Investment Tracking Spreadsheet:

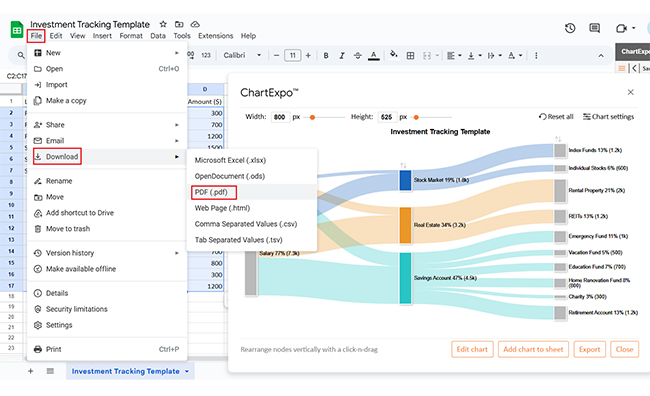
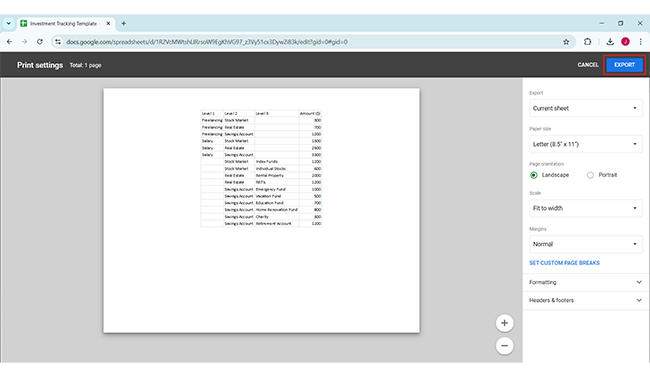
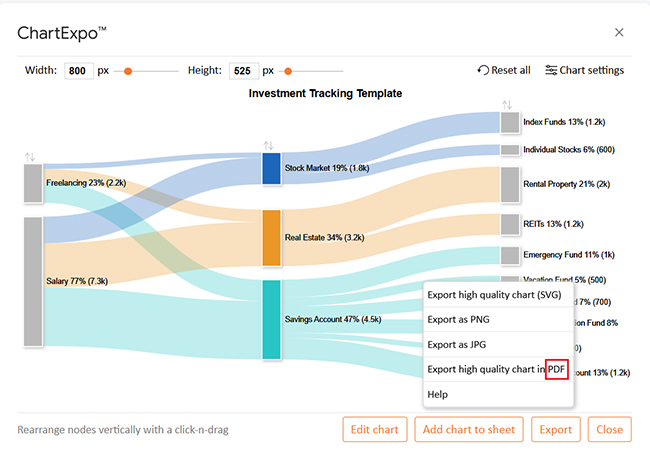
Downloading your spreadsheet and charts as PDFs is the perfect solution. It’s simple, quick, and professional. Let’s walk through the steps together:

  • Download your spreadsheet: Click File > Download, and select PDF (.pdf) to save it.
Download your spreadsheet 1
  • Export charts: Use the EXPORT button to create a PDF version of your chart directly.
Download your spreadsheet 2
  • Enhance with ChartExpo: Transform your data into stunning visuals to simplify data analytics. Export them as PDFs for easy sharing.
Download your spreadsheet 2
  • Share your work: Enjoy a sleek, professional PDF of your spreadsheet and charts.
Download your spreadsheet 1
  • Finally, the PDF will appear as follows.
Download your spreadsheet 1

FAQs

What type of spreadsheets are good to keep for managing investments?

Effective investment management requires spreadsheets that track income, expenses, and portfolio performance. Include tabs for asset allocation, growth over time, and goals. Also, use dynamic formulas and charts for updates. Please keep it clean, organized, and easy to analyze.

How do I create a spreadsheet to track finances?

Here’s how to create a dashboard in Google Sheets to track your finances:

  • Start with a blank spreadsheet.
  • Create columns for income, expenses, and savings.
  • Add rows for categories like salary, bills, and investments.
  • Use formulas for totals and balances. Include charts for visualization.
  • Update regularly to stay on top of finances.

Wrap Up

An investment tracking spreadsheet is a valuable tool for anyone managing finances. It provides clarity and control over your portfolio. With everything in one place, you can focus on growing your investments.

Tracking investments combats information overload and boosts performance monitoring. It helps identify what works and refine strategies for better decisions. A spreadsheet, paired with a reliable chart maker, simplifies goal tracking. It keeps you aligned with financial objectives.

Progress tracking keeps you motivated to stay on course. Detailed records also streamline tax planning. Monitor dividends, capital gains, and taxable events to save time and avoid errors during tax season.

Using an investment tracker sheet fosters accountability. It provides clear insights that support data-driven decision-making. Regular updates encourage frequent portfolio reviews. This practice sharpens focus, enhances decisions, and drives better long-term outcomes.

An investment tracking spreadsheet keeps you organized and confident. It’s a smart move toward financial success. Enhance it by installing ChartExpo to create insightful visuals.

Start today, learn to control your investments fully, and track smarter.

How much did you enjoy this article?

GSAd1
Start Free Trial!
147238

Related articles

next previous
Google Sheets10 min read

Google Workspace for Education for Better Insights

Google Workspace for Education boosts collaboration and remote learning. Explore its features, benefits, and how ChartExpo enhances data analysis.

Google Sheets9 min read

Google Workspace Marketplace for Boosting Insights

Google Workspace Marketplace provides apps to enhance Gmail, Drive, and Docs. Learn about this tool and how to improve data visualization and analysis.

Google Sheets12 min read

Google Sheets CRM Templates for Insightful Decisions

Google Sheets CRM templates help businesses track contacts, sales, and customer data. Learn their benefits, setup steps, and expert tips to boost efficiency.

Google Sheets10 min read

Histogram Chart in Google Sheets: A Quick Walkthrough

A Google Sheets Histogram makes data visualization simple by revealing patterns. Learn how to create, customize, and optimize histograms for better insight.

Google Sheets10 min read

Google Sheets Amortization Schedule with Clear Visuals

A Google Sheets Amortization Schedule tracks loan payments, interest, and balances. Learn how to create your schedule for better loan management.

ChartExpo logo

Turn Data into Visual
Stories

CHARTEXPO

  • Home
  • Gallery
  • Videos
  • Services
  • Pricing
  • Contact us
  • FAQs
  • Privacy policy
  • Terms of Service
  • Sitemap

TOOLS

  • ChartExpo for Google Sheets
  • ChartExpo for Microsoft Excel
  • Power BI Custom Visuals by ChartExpo
  • Word Cloud

CATEGORIES

  • Bar Charts
  • Circle Graphs
  • Column Charts
  • Combo Charts
  • Comparison Charts
  • Line Graphs
  • PPC Charts
  • Sentiment Analysis Charts
  • Survey Charts

TOP CHARTS

  • Sankey Diagram
  • Likert Scale Chart
  • Comparison Bar Chart
  • Pareto Chart
  • Funnel Chart
  • Gauge Chart
  • Radar Chart
  • Radial Bar Chart
  • Sunburst Chart
  • see more
  • Scatter Plot Chart
  • CSAT Survey Bar Chart
  • CSAT Survey Chart
  • Dot Plot Chart
  • Double Bar Graph
  • Matrix Chart
  • Multi Axis Line Chart
  • Overlapping Bar Chart
  • Control Chart
  • Slope Chart
  • Clustered Bar Chart
  • Clustered Column Chart
  • Box and Whisker Plot
  • Tornado Chart
  • Waterfall Chart
  • Word Cloud
  • see less

RESOURCES

  • Blog
  • Resources
  • YouTube
SIGN UP FOR UPDATES

We wouldn't dream of spamming you or selling your info.

© 2025 ChartExpo, all rights reserved.