Categories
Gathering financial information doesn’t have to feel intrusive. Income survey questions provide a structured way to collect earnings data while respecting privacy boundaries.
Rather than demanding exact salary figures, these tools use predefined ranges that make respondents comfortable sharing sensitive details. The result? Better data quality, fewer incomplete responses, and more reliable insights for decision-makers across research, business, and policy settings.
This post walks through everything you need: what income survey questions actually are, why they’re essential for solid analysis, how to craft them effectively, and how to extract meaningful patterns from the responses.
Whether you’re conducting qualitative surveys or building quantitative surveys for demographic survey questions, the framework stays consistent.
Definition: Income survey questions are formatted inquiries designed to capture financial information from individuals or households. Rather than asking for precise dollar amounts, they offer bracketed ranges that reduce discomfort around disclosure.
Typical coverage includes employment compensation, government benefits, investment returns, and supplemental revenue streams. A well-designed set keeps responses uniform and comparable.
When you include a household income survey question alongside individual earnings data, you capture total earning power without compromising anonymity.
The method works in a longitudinal survey just as well as in one-time research, enabling cross-group, cross-regional, and cross-temporal comparisons that reveal broader economic trends.
Financial data becomes valuable only when it drives action. Structured income inquiries convert raw numbers into usable intelligence that guides research frameworks and strategic planning.
Precision and tact aren’t mutually exclusive. These income survey questions strike that balance, working reliably in both corporate and academic environments.
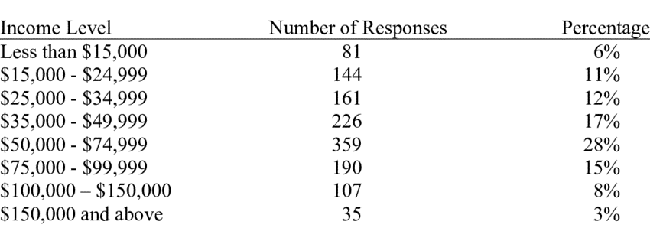
Respondents choose from preset earning tiers rather than typing exact amounts.
This household income survey question aggregates all earners under one roof, reflecting the total household income survey question data.
Monthly breakdowns work better for immediate spending tracking and liquidity planning.
Covers gig work, consulting contracts, or part-time ventures outside main employment.
Flags people dependent on predictable, government-backed monthly payments.
Separates active wages from portfolio-driven and property-based revenue.
Reveals baseline expenses for housing, utilities, and essential services.
Court-ordered payments add context to the overall financial picture.
Accounts for money specifically designated for dependent care.
Usually appears as an annual income survey question with range selections for simplicity.
Building surveys that produce clean, actionable data takes deliberate design. Thoughtful structure encourages honest answers and gives analysts reliable material to work with.
Tiered options minimize cognitive load and remove guesswork from responses.
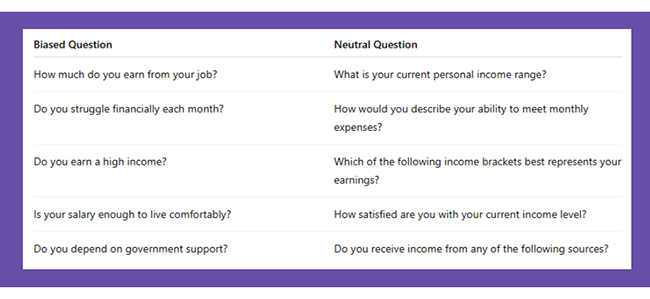
Unbiased phrasing prevents leading questions that skew results.
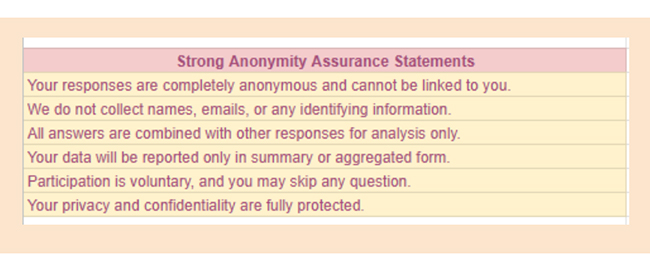
Privacy assurances boost completion rates and data quality in qualitative surveys.
Plain wording works for all education levels.

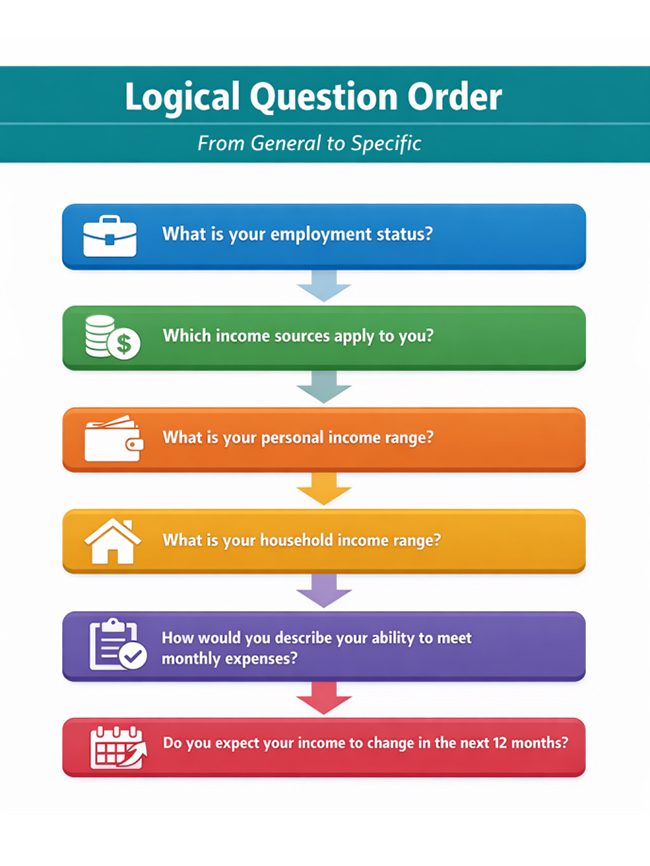
Sequencing from broad to specific reduces early drop-off.
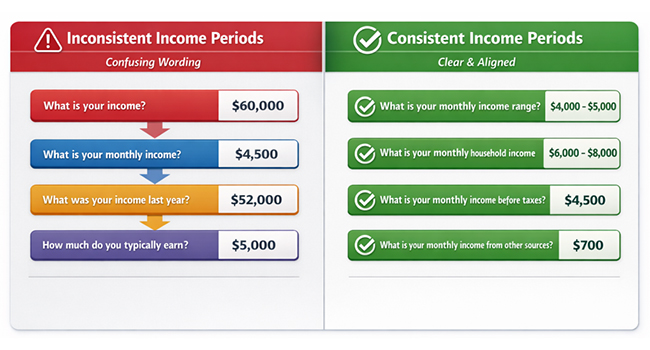
Specify monthly or yearly periods to avoid confusion in quantitative surveys.
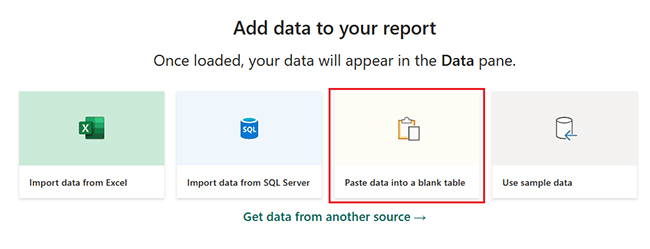
Visualization platforms amplify survey responses when data originates from a Microsoft survey or a Google Forms interface.
Import data from Google Forms directly into Power BI.
Normalize brackets and patch gaps from Google Forms for survey data.
Cluster participants by salary tier, geography, or other attributes.
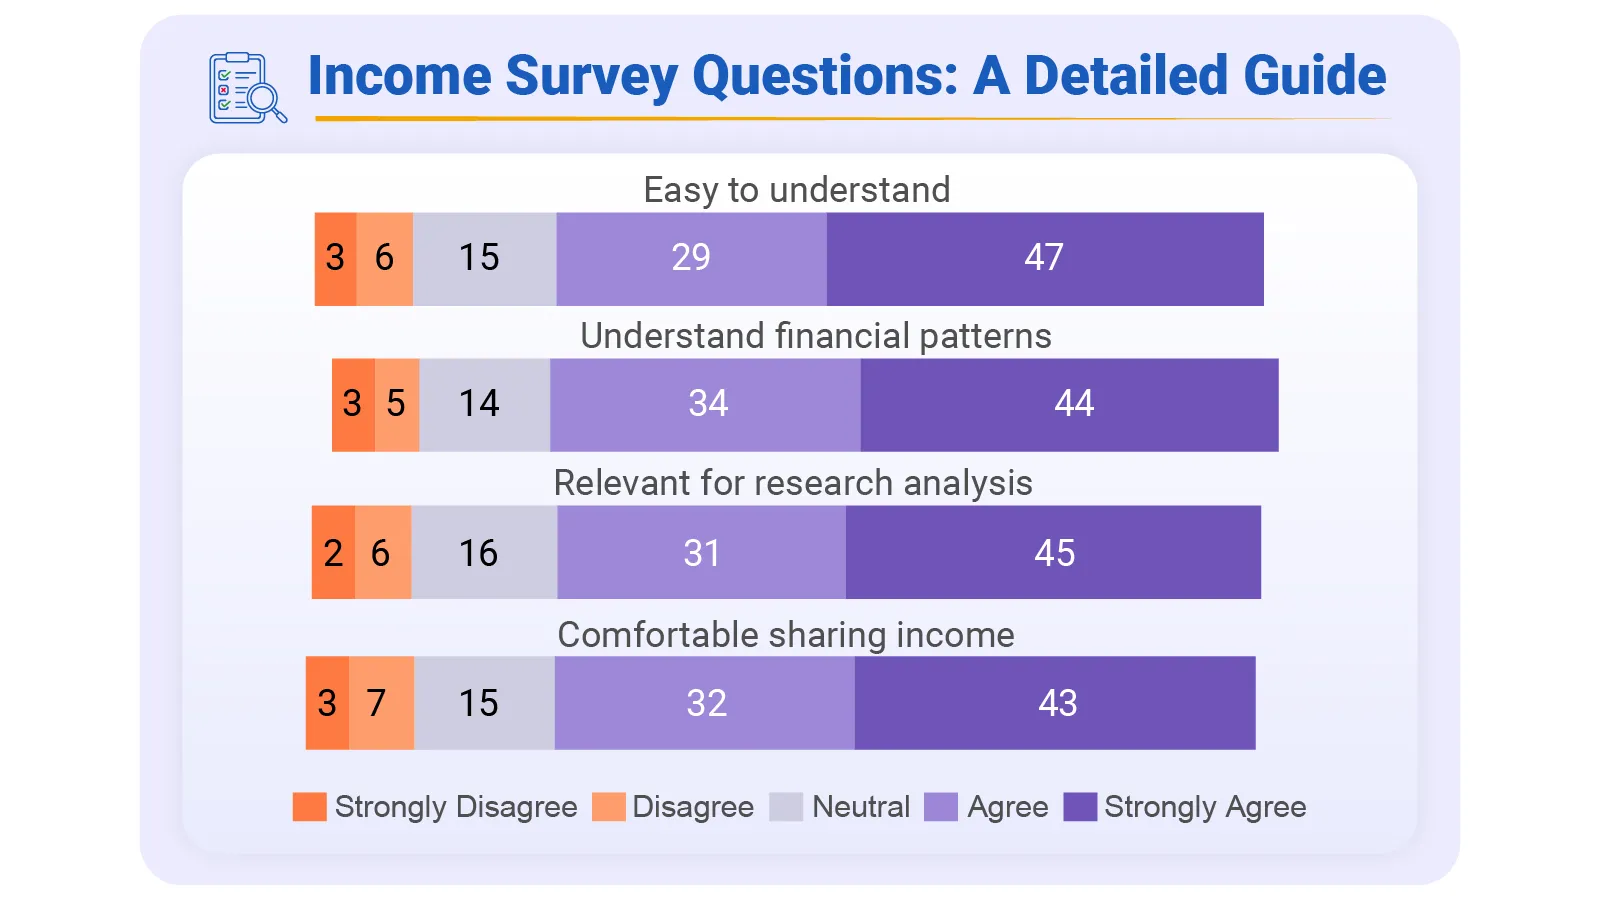
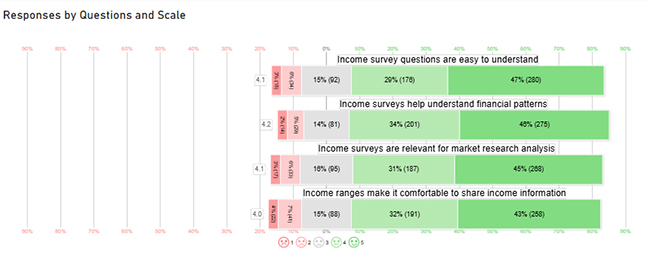
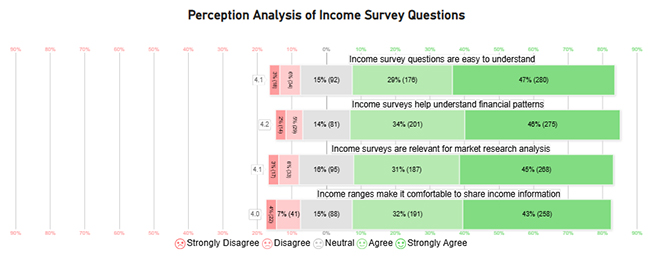
Deploy bar graphs and Likert Scale charts to decode perception data.
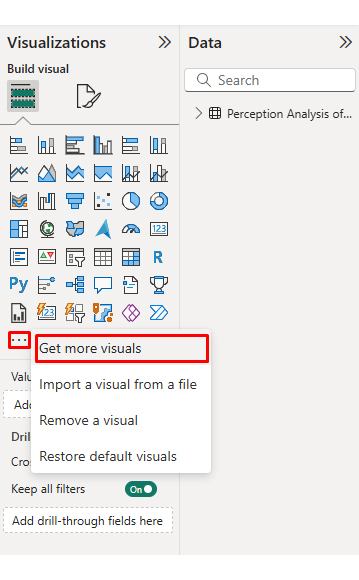
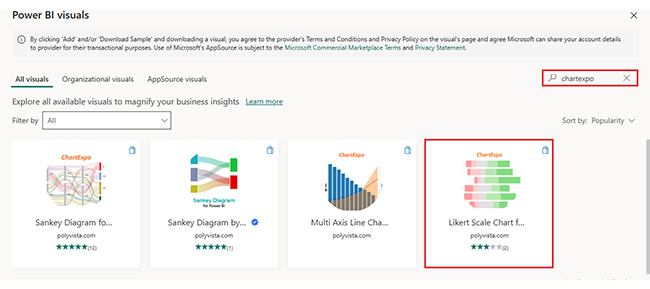
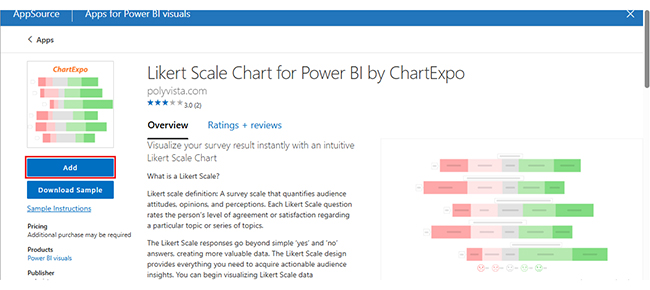
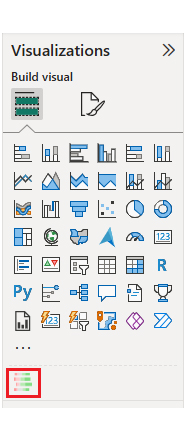
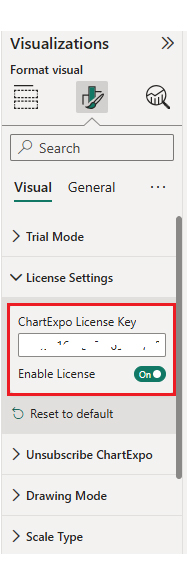
ChartExpo extends Power BI’s native capabilities with specialized income visualizations. Complex salary distributions become navigable, accelerating insight extraction and strengthening decisions.
Why use ChartExpo?
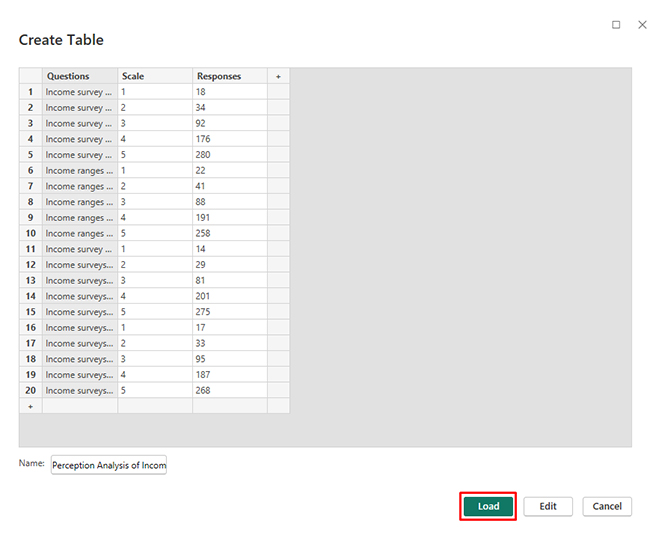
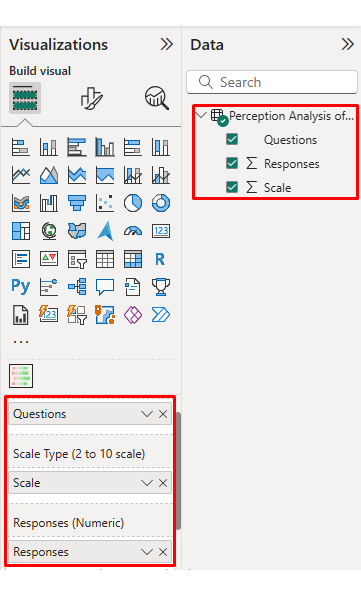
Consider we have the following data for a Likert Chart.
|
Questions |
Scale |
Responses |
| Income survey questions are easy to understand | 1 | 18 |
| Income survey questions are easy to understand | 2 | 34 |
| Income survey questions are easy to understand | 3 | 92 |
| Income survey questions are easy to understand | 4 | 176 |
| Income survey questions are easy to understand | 5 | 280 |
| Income ranges make it comfortable to share income information | 1 | 22 |
| Income ranges make it comfortable to share income information | 2 | 41 |
| Income ranges make it comfortable to share income information | 3 | 88 |
| Income ranges make it comfortable to share income information | 4 | 191 |
| Income ranges make it comfortable to share income information | 5 | 258 |
| Income surveys help understand financial patterns | 1 | 14 |
| Income surveys help understand financial patterns | 2 | 29 |
| Income surveys help understand financial patterns | 3 | 81 |
| Income surveys help understand financial patterns | 4 | 201 |
| Income surveys help understand financial patterns | 5 | 275 |
| Income surveys are relevant for market research analysis | 1 | 17 |
| Income surveys are relevant for market research analysis | 2 | 33 |
| Income surveys are relevant for market research analysis | 3 | 95 |
| Income surveys are relevant for market research analysis | 4 | 187 |
| Income surveys are relevant for market research analysis | 5 | 268 |


These tools deliver substantial benefits while carrying inherent trade-offs.
Earnings tiers enable precise audience clustering for survey results interpretation.
Financial context enriches survey results, clarifying decision patterns.
Categorizing by compensation streamlines cross-group benchmarking.
Bracketed formats simplify processing compared to open text fields.
Comparing salary trends across markets, sectors, or demographics becomes feasible.
Sensitivity around money can suppress survey participation.
People inflate or deflate earnings for various reasons.
Diverse revenue streams complicate precise classification.
Financial inquiries demand tactful phrasing.
Bracket interpretation varies, affecting data uniformity.
Following proven techniques boosts answer rates and data validity for survey questions.
Robust confidentiality commitments underpin good survey questions. These standards apply across all types of survey work.
Deploy range selectors, objective wording, and explicit time windows. Confidentiality pledges raise truthfulness.
Uniform earnings categories enable grouping, benchmarking, and longitudinal tracking.
Absolutely. Companies decode spending capacity, price tolerance, and customer layers.
Income survey questions deliver financial intelligence without compromising respondent privacy. Bracket-based formats reduce hesitation while maintaining analytical precision.
These tools work across research contexts, from academic studies to commercial applications, providing consistent value regardless of scale or sector. The structured approach enables meaningful comparisons across demographics and time periods.
Combining thoughtful design with platforms like Power BI unlocks deeper insights from survey responses. Range selectors, neutral phrasing, and confidentiality commitments form the foundation of effective data collection.
When executed properly, these methods transform raw responses into strategic direction for policy makers, researchers, and business leaders. The framework adapts to qualitative surveys, quantitative surveys, and longitudinal survey designs equally well, supporting diverse analytical needs.
How much did you enjoy this article?


Google Forms to Google Sheets keeps your data organized and current with every submission. Learn the steps, methods, and tips now!

Product survey questions reveal what customers truly think. Learn how to ask the right ones and act on the survey results. Read on!

Learn how the 5-Point Performance Rating Scale improves employee evaluations with clear, consistent, and fair performance reviews across teams.


