Categories
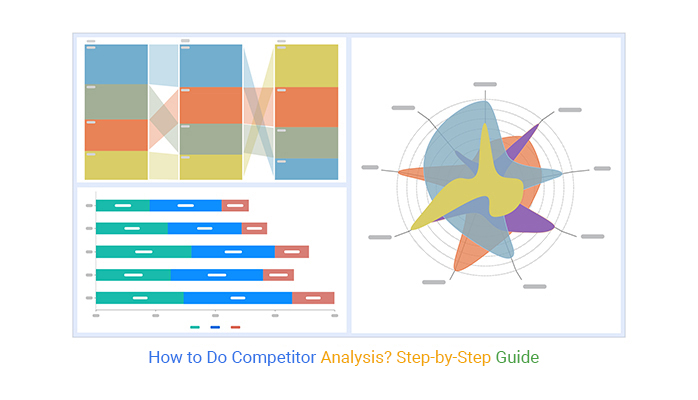
Learn essential steps in How to Do Competitor Analysis with our guide. Elevate your strategy & stay ahead of the competition using practical insights & tools.


This is where competitor analysis comes into play.
Consider two brands, A and B, with similar products but different marketing strategies. A focuses on emotional branding and customer loyalty. In contrast, B targets younger consumers with social media campaigns.
They can adjust their marketing strategies through competitor analysis to reach their target audiences better. Consequently, increase their market share.
Do you want to level up and leave your competitors in the dust?
Well, it’s time to unleash your inner detective and conduct serious competitor analysis. And what better tool to use? No need to hire a private investigator or don a spy disguise. All you need is your computer and some computer skills.
So, grab your magnifying glass, and let’s look into how to do a competitor analysis.
Definition: Competitor analysis involves identifying and studying rivals to spot their strengths and weaknesses. It entails examining their offerings, sales techniques, pricing, and marketing strategies to find opportunities for improvement. This aids in understanding your place in the market and developing strategies to gain a competitive edge.
There is no better way to do competitor analysis than by analyzing their data and metrics. While several tools are available, Excel and ChartExpo, stand out as the best options.
Excel, a spreadsheet program, allows you to organize and manipulate data easily. ChartExpo, an add-in for Excel, enables you to create insightful visualizations, such as Mosaic plots, which help in interpreting complex data relationships. Together, they provide a powerful combination for conducting competitor analysis.
With Excel’s data organization and ChartExpo’s visualization capabilities, competitors won’t stand a chance against your data-driven superhero status.
Utilizing competitive analysis templates can streamline this process, providing a structured framework to gather and analyze essential data. Here’s a breakdown of key elements you might find ineffective competitive analysis templates:
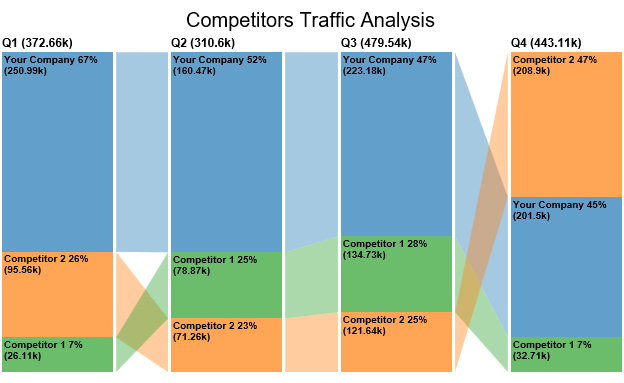
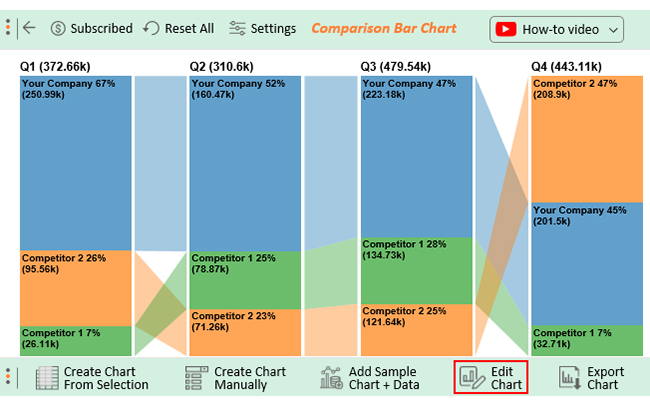
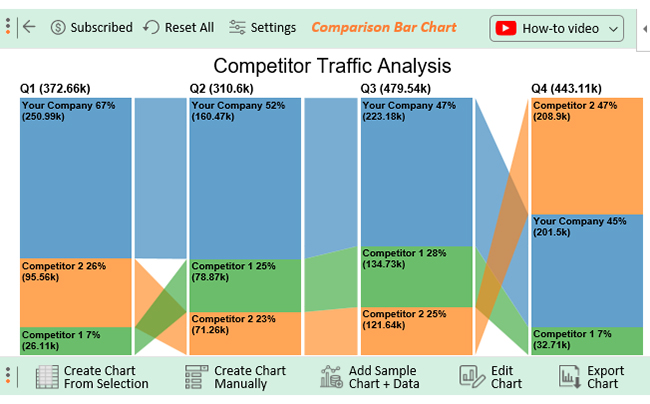
A Comparison Bar Chart is a powerful tool for comparing data sets visually. It uses bars to represent sections within the same category and compares the data to other categories or periods. This provides a clearer understanding of how data changes between categories.
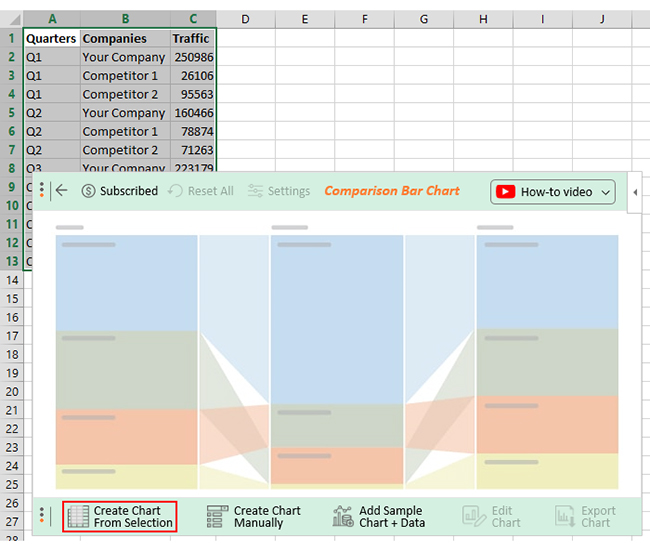
Assume you have your company’s and competitor’s quarterly website traffic data, as shown below.
| Quarters | Companies | Traffic |
| Q1 | Your Company | 250986 |
| Q1 | Competitor 1 | 26106 |
| Q1 | Competitor 2 | 95563 |
| Q2 | Your Company | 160466 |
| Q2 | Competitor 1 | 78874 |
| Q2 | Competitor 2 | 71263 |
| Q3 | Your Company | 223179 |
| Q3 | Competitor 1 | 134726 |
| Q3 | Competitor 2 | 121635 |
| Q4 | Your Company | 201495 |
| Q4 | Competitor 1 | 32707 |
| Q4 | Competitor 2 | 208904 |
You can map this data on a Comparison Bar Chart as shown below.
A Stacked Bar Chart displays numeric values across two categorical variables. It divides each bar into sub-bars corresponding to a level of the second categorical variable. It explores the relative decomposition of each primary bar based on the levels of the variable.
The data below displays the companies as the primary categorical variable and the products as the secondary categorical variable.
| Countries | Companies | Garments | Electronics | Toys |
| USA | Your Company | 56 | 37 | 7 |
| USA | Competitor’s Company | 25 | 11 | 64 |
| Canada | Your Company | 52 | 38 | 10 |
| Canada | Competitor’s Company | 52 | 34 | 14 |
| UK | Your Company | 53 | 22 | 25 |
| UK | Competitor’s Company | 32 | 35 | 33 |
| UAE | Your Company | 27 | 24 | 49 |
| UAE | Competitor’s Company | 44 | 26 | 31 |
The chart below depicts the market share of each product by company. This reveals which firm dominates the market and which items drive sales.

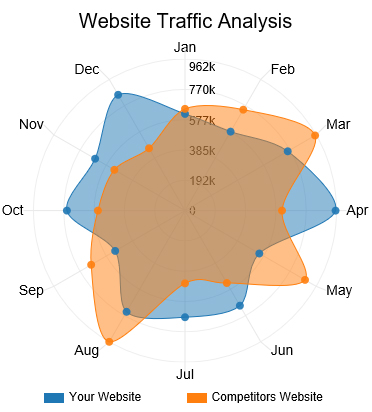
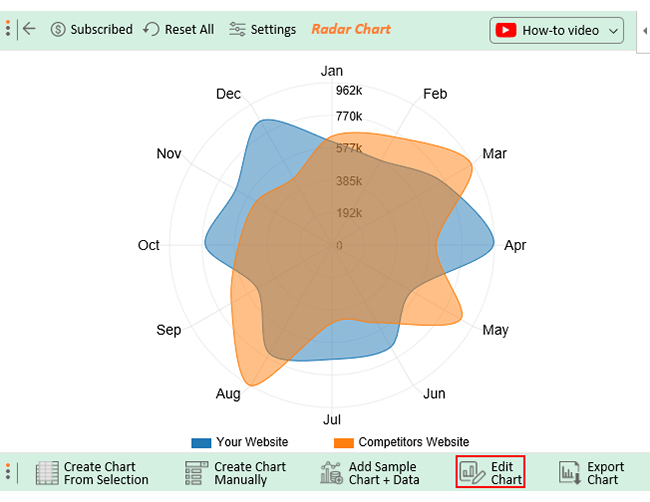
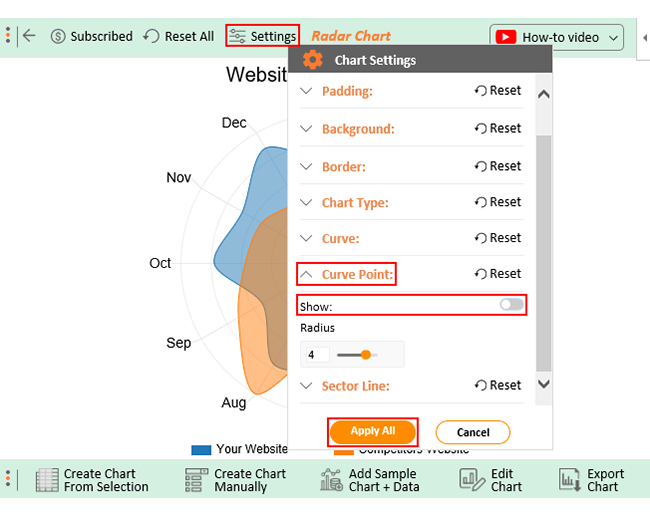
A Radar Chart is also known as a Spider Chart or Polar Chart. It helps compare multiple quantitative variables and display performance. Each variable has an axis arranged radially with equal distances. All variables connect to form a polygon. The shape of the chart can indicate which variables perform well or poorly.
Let’s say you have website traffic data distributed across the different months in a year, as shown below.
| Months | Your Website | Competitors Website |
| Jan | 614000 | 646000 |
| Feb | 579000 | 740000 |
| Mar | 753000 | 954000 |
| Apr | 956000 | 616000 |
| May | 545000 | 880000 |
| Jun | 697000 | 531000 |
| Jul | 677000 | 462000 |
| Aug | 742000 | 962000 |
| Sep | 512000 | 688000 |
| Oct | 750000 | 553000 |
| Nov | 659000 | 518000 |
| Dec | 849000 | 457000 |
You can see how beautifully this data has been mapped on a Radar Chart below.
As discussed earlier, Excel is the best tool for performing competitor analysis. However, Excel poses some challenges with data analysis. This necessitates the use of a third-party tool, ChartExpo.
Why ChartExpo?
Let’s learn how to Install ChartExpo in Excel.
ChartExpo charts and graphs are available both in Google Sheets and Microsoft Excel. Please use the following CTA’s to install the tool of your choice and create beautiful visualizations in a few clicks in your favorite tool.


Example #1
Let’s assume you have your company’s and competitor’s quarterly website traffic data, as shown in the above Comparison Bar Chart template.


The following video will help you to create a Comparison Bar Chart in Microsoft Excel.
Example #2
Let’s create a Radar Chart visualization of your data and glean valuable insights.


Competitor analysis is a crucial component of strategic business planning, providing valuable insights that can influence decision-making and contribute to the overall success of a company. Understanding what a data analyst does in this context can enhance your approach. Here are some key benefits of conducting competitor analysis:
Analyzing your competitors helps you determine how to differentiate your product or service from others. Through this process, you can identify your USP. Understanding your USP is crucial as it can help you craft a compelling value proposition. Consequently, develop a clear brand identity that expresses your differentiation strategy.
You can identify areas where your business can improve to meet or exceed customer expectations. This can help you provide better value to your customers and improve overall customer satisfaction. This contributes to increased customer loyalty and retention.
You can gain insights into your competitor’s target markets, customer demographics, and product offerings. As a result, identify gaps or unmet customer needs that may present new opportunities for your business. This can help you expand your customer base and increase your market share.
Regular and systematic competitor analysis will help you understand their strengths and weaknesses. This lets you stay up-to-date and refine your business strategies to maintain a competitive edge. As a result, ensure the long-term success of your business.
You can examine your competitors’ marketing messages, social media presence, and content marketing tactics. You will gain knowledge of market trends thanks to this. As a result, identify where you can improve your campaigns.
Competitor analysis provides valuable insights that can inform strategic decision-making processes. This includes identifying new target markets, adjusting pricing strategies, developing unique value propositions, or enhancing product offerings.
Competitor analysis helps you identify potential threats and risks in the market. By understanding the actions and strategies of competitors, you can proactively respond to market changes and competitive challenges.
Competitor analysis is a strategic method for determining a business’s position in the marketplace relative to its rivals. It aids businesses in identifying their strengths and areas for improvement.
The goal of a market analysis is to locate opportunities and potential clients. Comparatively, competitor analysis concentrates on understanding competitors to develop a competitive advantage.
To do competitor analysis, use ChartExpo, a third-party tool that supercharges data visualization. ChartExpo creates insightful data visualizations that facilitate effective competitor analysis.
A competitive analysis should include an evaluation of the following competitor aspects;
It should also identify opportunities and threats in the market that can inform strategic decision-making.
Performing a competitive analysis offers several benefits;
Competitors do exist depending on the type of business you run and the industry you operate in. To remain successful, you must study them and understand how they operate. Doing this will help you defend your position, compete better, and improve your business’ performance.
Understanding the competition and finding new opportunities are made possible with the help of competitor analysis. It assists you in staying one step ahead of the competition and guarantees your business’s long-term success.
It entails identifying and researching competitors to determine their strengths and weaknesses.
This may seem daunting, yet you can accomplish it. With basic knowledge and the right tools, you can do it independently.
How can you maximize your competitor analysis, and what tools should you use?
The data analysis go-to tool is a spreadsheet. However, a spreadsheet can only show you data in rows and columns.
How to do competitor analysis? This is where ChartExpo comes in handy.
ChartExpo makes data more engaging with visualizations that give you a bird’s eye view of the whole picture. It converts data in your spreadsheets into interactive visualizations and dashboards.
Try ChartExpo today.
How much did you enjoy this article?


Key Performance Indicators in healthcare track patient care and efficiency. Learn about these KPIs, top examples, and how to use them to improve outcomes.
The BMI calculation formula in Excel helps track and analyze body mass index. Explore step-by-step instructions and tips to simplify BMI tracking in Excel.

Click to learn how to plot a Tornado Chart in Excel using easy-to-follow steps. Also, we’ll address the following question: what is a Tornado Diagram?