• Home
  • Tools dropdown img
    • Spreadsheet Charts

      • ChartExpo for Google Sheets
      • ChartExpo for Microsoft Excel
    • Power BI Charts

      • Power BI Custom Visuals by ChartExpo
    • Word Cloud

  • Charts dropdown img
    • Chart Category

      • Bar Charts
      • Circle Graphs
      • Column Charts
      • Combo Charts
      • Comparison Charts
      • Line Graphs
      • PPC Charts
      • Sentiment Analysis Charts
      • Survey Charts
    • Chart Type

      • Box and Whisker Plot
      • Clustered Bar Chart
      • Clustered Column Chart
      • Comparison Bar Chart
      • Control Chart
      • CSAT Survey Bar Chart
      • CSAT Survey Chart
      • Dot Plot Chart
      • Double Bar Graph
      • Funnel Chart
      • Gauge Chart
      • Likert Scale Chart
      • Matrix Chart
      • Multi Axis Line Chart
      • Overlapping Bar Chart
      • Pareto Chart
      • Radar Chart
      • Radial Bar Chart
      • Sankey Diagram
      • Scatter Plot Chart
      • Slope Chart
      • Sunburst Chart
      • Tornado Chart
      • Waterfall Chart
      • Word Cloud
    • Google Sheets
      Microsoft Excel
  • Services
  • Pricing
  • Contact us
  • Blog
  • Support dropdown img
      • Gallery
      • Videos
      • Contact us
      • FAQs
      • Resources
    • Please feel free to contact us

      atsupport@chartexpo.com

Categories
All Data Visualizations Data Analytics Surveys
Add-ons/
  • Google Sheets
  • Microsoft Excel
  • Power BI
All Data Visualizations Data Analytics Surveys
Add-ons
  • Google Sheets
  • Microsoft Excel
  • Power BI

We use cookies

This website uses cookies to provide better user experience and user's session management.
By continuing visiting this website you consent the use of these cookies.

Ok

ChartExpo Survey


Home > Blog > Microsoft Excel

How to Move a Table in Excel for Clear Data Visuals?

How to move a table in Excel efficiently?

It is a question many Excel users ask while managing data. Whether rearranging sheets or consolidating reports, moving tables is a basic yet essential skill. This feature saves time and effort, rearranging sheets, consolidating reports, or moving tables –It’s a basic skill.

Moving tables isn’t complicated, but it can feel tricky without guidance. Properly relocating a table ensures your data remains intact and maintains its formatting. From financial reports to inventory lists, tables are the backbone of data-driven tasks.

How to Move a Table in Excel

Studies show that professionals spend up to 10% of their workweek on spreadsheet tasks. Understanding simple actions like moving tables can reduce wasted time and improve workflow efficiency. This small skill has a big impact, especially when handling multiple projects.

Tables in Excel are more than just data—they represent insights. Moving tables ensures that nothing gets misplaced. It’s a practical skill that helps keep your files organized and error-free.

If you’ve ever struggled with moving tables, this guide is for you. By mastering this feature, you’ll handle your data more effectively and work smarter.

Table of Contents:

  1. Why Move Tables in Excel?
  2. How to Move a Pivot Table in Excel?
  3. How to Move a Table in Excel With Example?
  4. How to Analyze Moved Table Data in Excel?
  5. Wrap Up

First…

Why Move Tables in Excel?

It’s not just about repositioning data; it’s about creating a more organized and efficient workspace. Whether managing large datasets or collaborating with a team, knowing why to move a table is key.

Why?

  • Improved organization: Rearranging tables helps keep your worksheets tidy. It ensures your data is in the right place for easier navigation and updates.
  • Data integration: Moving tables allows you to combine data from sheets or workbooks, helping create comprehensive reports or summaries.
  • Presentation and reporting: Placing tables enhances readability. It makes your reports look cleaner and more professional for data presentations or sharing with others.
  • Efficient space management: Relocating tables can free up space on your sheet. It is useful for adding new data or creating charts alongside your table.
  • Preparation for analysis: Positioning your table correctly ensures smoother analysis. It simplifies the process of applying formulas, pivot tables, or options to filter data in Excel effectively.
  • Collaboration needs: Moving tables to a shared or prominent area promotes teamwork. It ensures everyone can access and understand the data effortlessly.

How to Move a Pivot Table in Excel?

Moving a Pivot Table in Excel is quick and simple but can significantly improve your workflow. Whether organizing a report or adjusting your layout, knowing how to move a Pivot Table ensures your data remains functional. Here’s how you can do it step by step:

  • Select the Pivot Table: Click anywhere on your Pivot Table. This activates it, making the necessary tools and options available.
  • Open the Pivot Table options: Navigate to the “PivotTable Analyze” tab in the ribbon. This tab contains all the settings you need for managing your Pivot Table.
  • Choose the move option: Click the “Move PivotTable” option in the Analyze tab. A dialog box will pop up, allowing you to define a new location.
  • Choose the new location: Decide where you want the Pivot Table to go. You can move it within the same worksheet or to a completely new sheet. Please select the desired cell or range for its new location.
  • Confirm the move: Click “OK” to finalize. Your Pivot Table will be instantly relocated, retaining all its data and formatting.

How to Move a Table in Excel With Example?

If you’ve ever worked with tables in Excel, you know they can sometimes be stubborn when you want to reposition them. Don’t worry—moving a table is easy. I’ll show you a quick and effective way to move your table in Excel with no fuss.

  1. Drag Table to New Location:
    • Begin by entering your data into an Excel sheet. For example, a table with columns for Channel, Gender, and Views.
Enter Your Data into Excel Sheet for Learning How to Move a Table in Excel
    • Select the table by highlighting the rows and columns you want to move.
Select Table Highlighting Rows and Columns for Learning How to Move a Table in Excel
    • Once selected, click and hold on the table, then drag it to the desired location.
Click and Hold on Table for Learning How to Move a Table in Excel
    • Release the mouse button, and your table will appear in its new position, fully intact.
Release Mouse Button for Learning How to Move a Table in Excel
  1. Cut and Paste a Table to the New Location:
    • Start with your data in an Excel sheet. For instance, a dataset tracking sales or performance metrics. To cut the table, press Ctrl + X, select your data, right-click, and choose Cut.
To Cut Table Press Ctrl+X for Learning How to Move a Table in Excel
    • Navigate to the target location, select the starting cell, and either press Ctrl + V or use the Paste option.
To Paste Target Location Press Ctrl+V for Learning How to Move a Table in Excel
    • Your table will appear in the new spot, ready for further adjustments.
Table will Appear in New Spot for Learning How to Move a Table in Excel

How to Analyze Moved Table Data in Excel?

Analyzing moved table data in Excel can feel like solving a puzzle with missing pieces. Data visualization is key to unlocking insights.

Excel is a powerful tool for data analysis, but it often needs to improve in data visualization. While analyzing data is essential, presenting it visually is where the real magic happens.

Moving tables in Excel might seem simple, but better visuals require smarter solutions. That’s where ChartExpo steps in. Whether you need to move columns in Excel or enhance your data presentation, ChartExpo transforms dull data into dynamic visuals, filling Excel’s gaps in data storytelling.

Let’s learn how to install ChartExpo in Excel.

  1. Open your Excel application.
  2. Open the worksheet and click the “Insert” menu.
  3. You’ll see the “My Apps” option.
  4. In the Office Add-ins window, click “Store” and search for ChartExpo on my Apps Store.
  5. Click the “Add” button to install ChartExpo in your Excel.

ChartExpo charts are available both in Google Sheets and Microsoft Excel. Please use the following CTAs to install the tool of your choice and create beautiful visualizations with a few clicks in your favorite tool.

Example

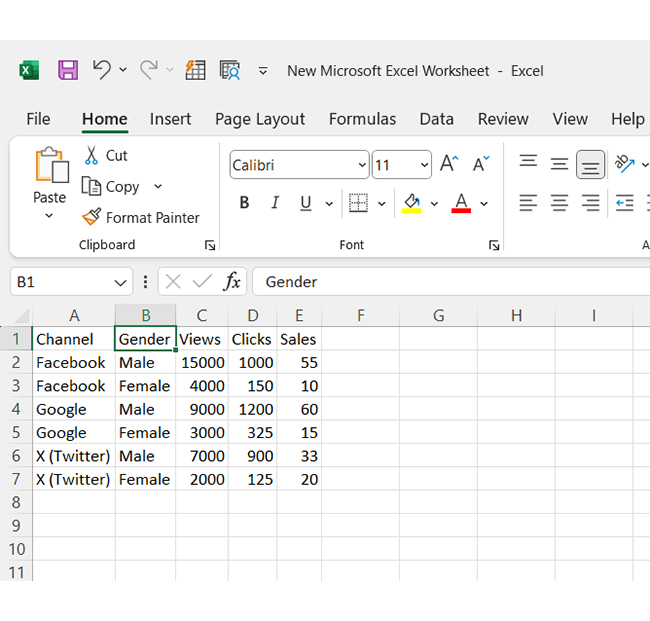
Let’s dive into analyzing and interpreting data in this sample using Excel with the powerful ChartExpo tool.
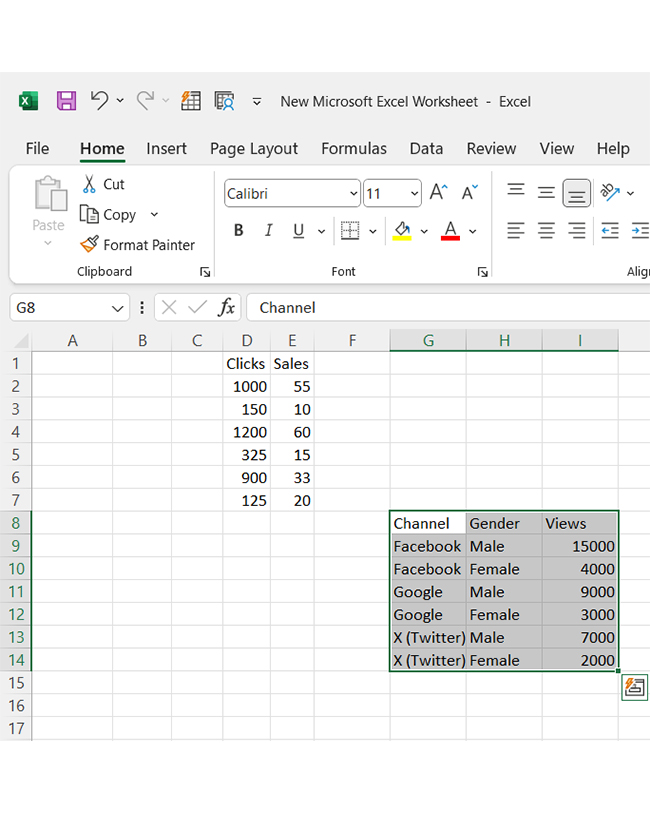
Channel Gender Views Clicks Sales
Facebook Male 15000 1000 55
Facebook Female 4000 150 10
Google Male 9000 1200 60
Google Female 3000 325 15
X (Twitter) Male 7000 900 33
X (Twitter) Female 2000 125 20
  • To get started with ChartExpo, install ChartExpo in Excel.
  • Now Click on My Apps from the INSERT menu.
insert chartexpo in excel
  • Choose ChartExpo from My Apps, then click Insert.
open chartexpo in excel
  • Once it loads, scroll through the charts list to locate and choose the “Clustered Stacked Bar Chart”. This chart is best suited to this scenario.
search clustered stacked bar chart in excel
  • You will see a Clustered Stacked Bar Chart on the screen.
See Clustered Stacked Bar Chart After Learning How to Move a Table in Excel
  • Click the “Create Chart From Selection” button after selecting the data from the sheet, as shown.
Click Create Chart From Selection After Learning How to Move a Table in Excel
  • ChartExpo will generate the visualization below for you.
Initial Visual After Learning How to Move a Table in Excel
  • If you want to have the chart’s title, click Edit Chart, as shown in the above image.
  • Click the pencil icon next to the Chart Header to change the title.
  • It will open the properties dialog. Under the Text section, you can add a heading in Line 1 and enable Show.
  • Give the appropriate title of your chart and click the Apply button.
Add Chart Header After Learning How to Move a Table in Excel
  • You can change the color of the Male section by clicking on the Legend small pencil icon:
Change Color of Male Section After Learning How to Move a Table in Excel
  • You can change the color of the Female section by clicking on the Legend small pencil icon:
Change Color of Female After Learning How to Move a Table in Excel
  • Click the “Save Changes” button to persist the changes.
Click Save Changes After Learning How to Move a Table in Excel
  • Your Clustered Stacked Bar Chart will appear as below.
Final How to Move a Table in Excel

Insights

  • Male users generate higher views, clicks, and sales across all channels.
  • Google leads in sales, particularly among male users.
  • Facebook has the highest views overall but shows lower sales efficiency.

Enhance Chart Insights by Effectively Moving Tables in Excel:

  1. Open your Excel Application.
  2. Install ChartExpo Add-in for Excel from Microsoft AppSource to create interactive visualizations.
  3. Select the Clustered Stacked Bar Chart from the list of charts.
  4. Select your data.
  5. Click on the “Create Chart from Selection” button.
  6. Customize your chart properties to add header, axis, legends, and other required information.

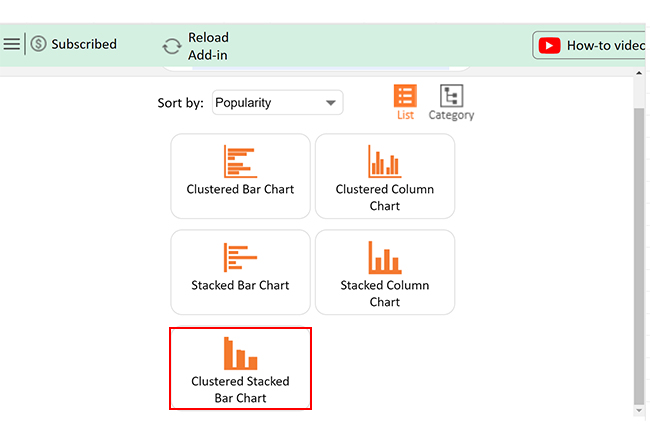
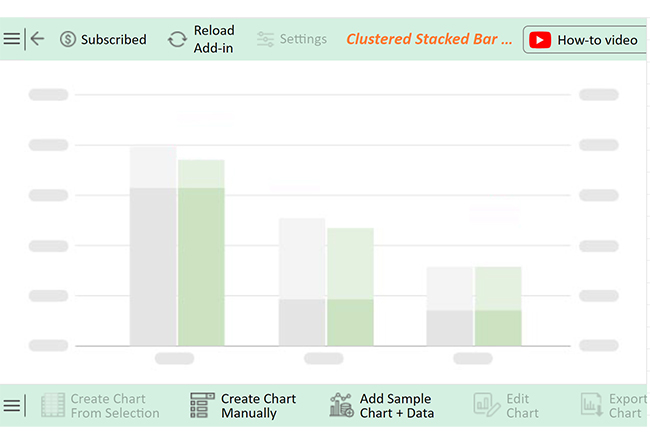
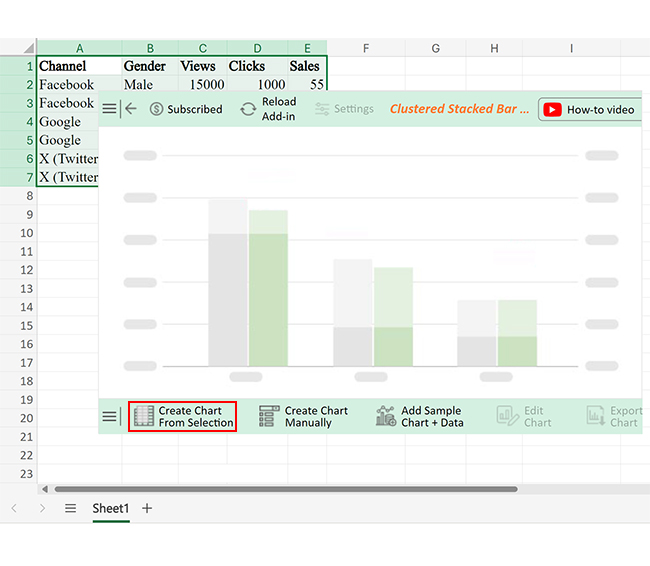
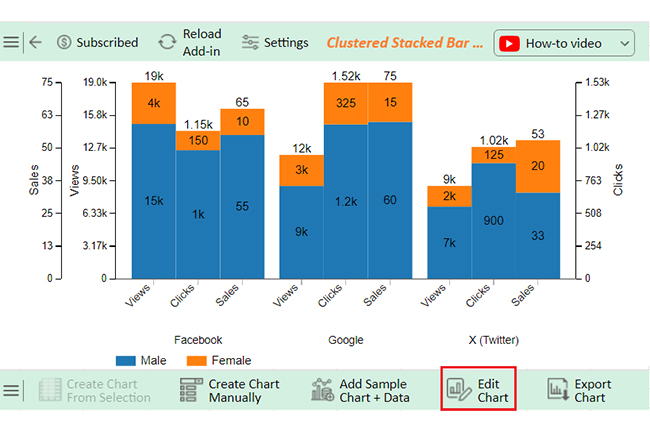
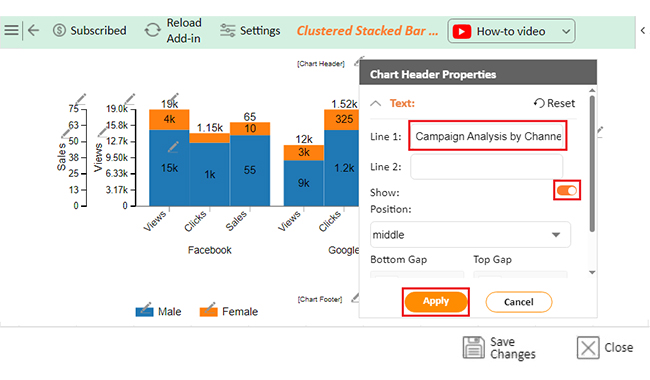
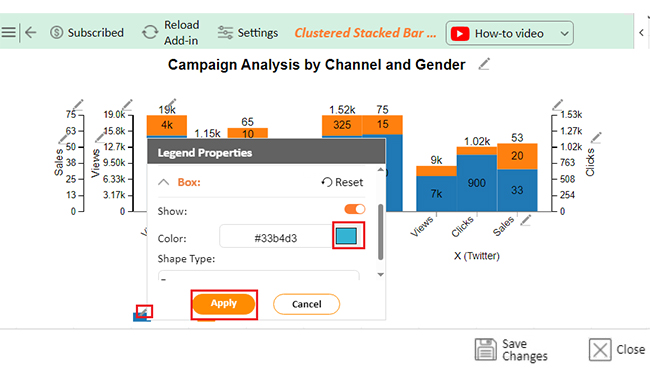
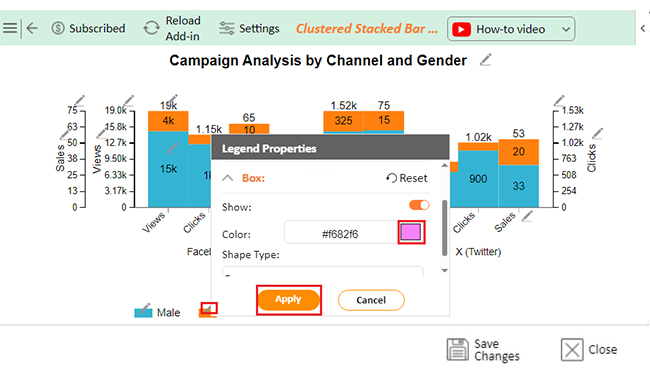
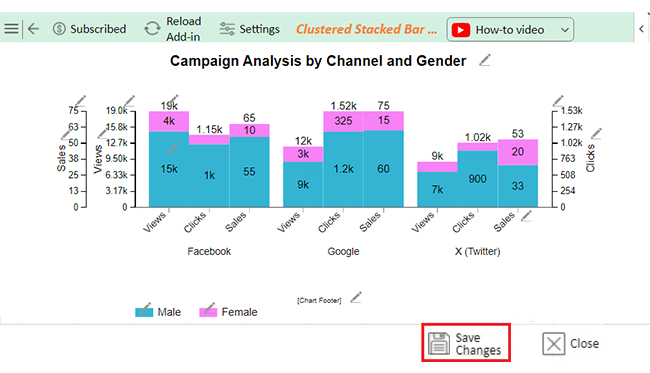
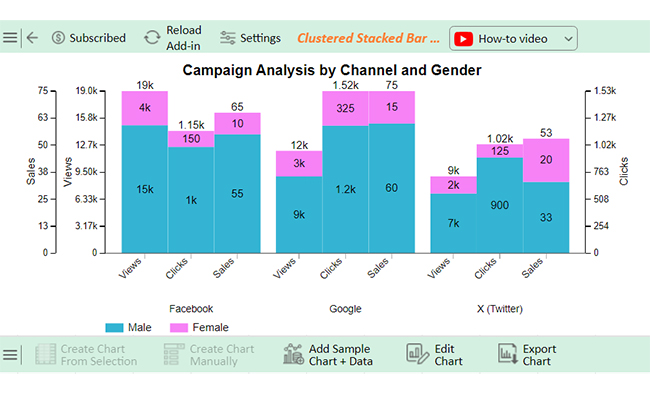
The following video will help you create a Clustered Stacked Bar Chart in Microsoft Excel.

FAQs

How do I move an entire table in Excel?

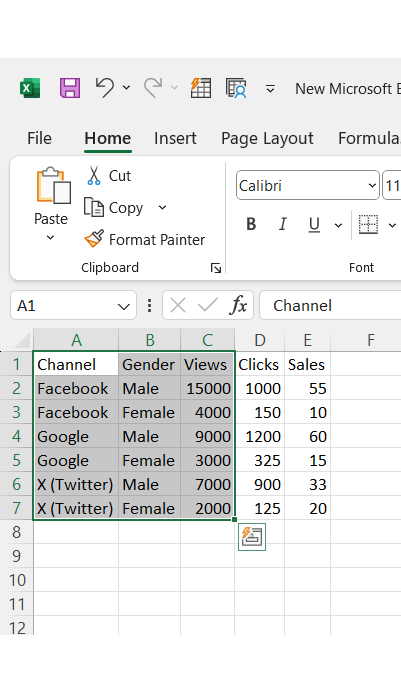
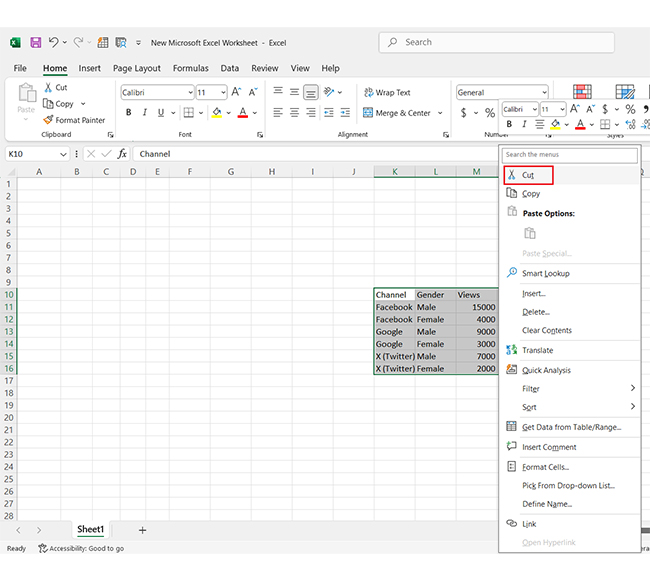
To move an entire table in Excel:

  • Select the table by clicking and dragging across it.
  • Hover over the table’s edge until a four-sided arrow appears.
  • Click, hold, and drag the table to the desired location.

How do I change the position of a table in Excel?

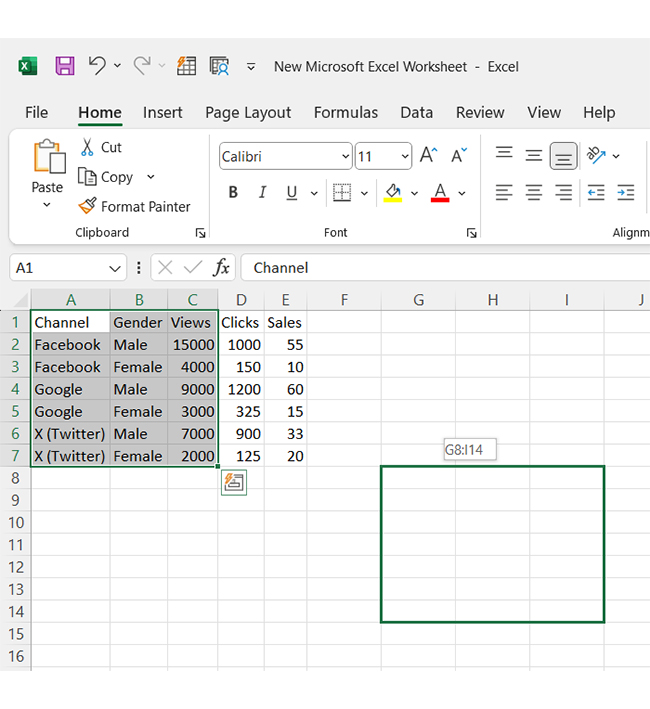
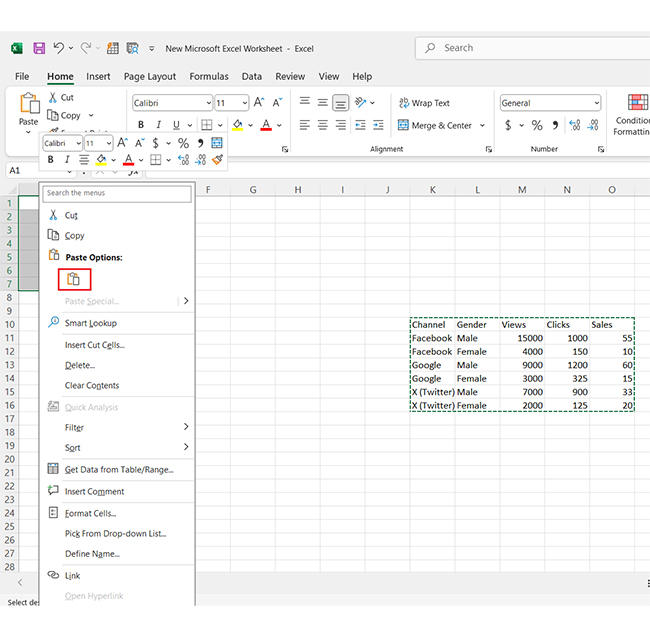
To change a table’s position in Excel:

  • Select the table by clicking its edge.
  • When the cursor changes to a four-sided arrow, click and hold.
  • Drag the table to the new position and release the mouse button.

How do I make a table moveable in Excel?

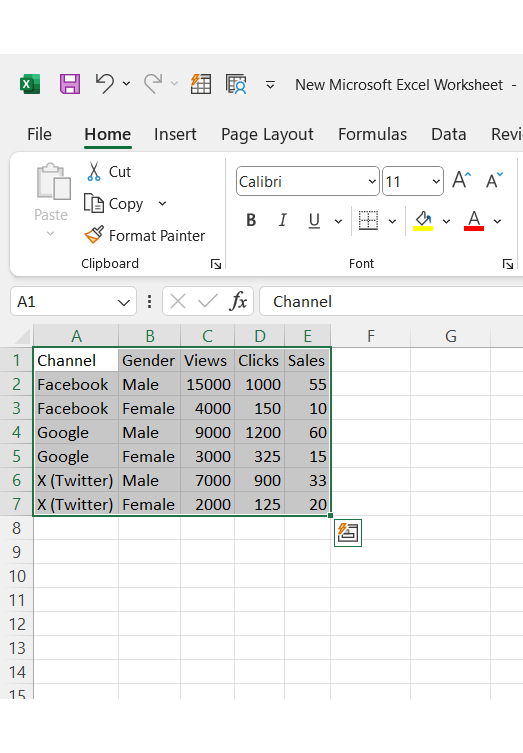
To make a table movable in Excel:

  • Click anywhere inside the table.
  • Hover over its border until the cursor becomes a four-sided arrow.
  • Click, hold, and drag the table to reposition it anywhere on the worksheet.

Wrap Up

Moving a table in Excel is a simple but vital skill. It helps you organize data effectively and work with greater ease. Whether rearranging for better visuals or preparing for analysis, the process saves time and enhances productivity.

Dragging and dropping a table is quick for small adjustments. It allows for instant placement changes with minimal effort. This method is ideal for on-the-go modifications.

Cutting and pasting is another reliable option. It provides flexibility to move data across worksheets or entirely new files. This ensures your work stays clean and well-structured.

Both methods preserve the data and formatting. It reduces errors and ensures your tables remain accurate and functional. You don’t have to worry about losing important details during the process.

Learning these techniques makes collaboration smoother. Teams can easily adapt shared files, improving communication and efficiency. These skills are valuable for both beginners and advanced users.

In summary, knowing how to move a table in Excel enhances your workflow. It keeps your data organized, accessible, and ready for any task. You can handle Excel challenges confidently and efficiently by mastering these simple steps.

How much did you enjoy this article?

ExcelAd2
Start Free Trial!
145634

Related articles

next previous
Microsoft Excel12 min read

Key Performance Indicators in Healthcare for Better Insights

Key Performance Indicators in healthcare track patient care and efficiency. Learn about these KPIs, top examples, and how to use them to improve outcomes.

Microsoft Excel10 min read

BMI Calculation Formula in Excel for Better Fitness Insights

The BMI calculation formula in Excel helps track and analyze body mass index. Explore step-by-step instructions and tips to simplify BMI tracking in Excel.

Microsoft Excel29 min read

How to Create a Tornado Chart in Excel? A Complete Guide

Click to learn how to plot a Tornado Chart in Excel using easy-to-follow steps. Also, we’ll address the following question: what is a Tornado Diagram?

Microsoft Excel14 min read

How to Create a Scatter Plot in Excel with 3 Variables?

Click to discover how to create a Scatter Plot in Excel with 3 variables. We’ll also address the following question: why do we use Scatter Plot Graph?

Microsoft Excel12 min read

Construction Budget Spreadsheet for Better Planning

A construction budget spreadsheet helps track expenses and control costs. This blog explores benefits, top templates, and tips for better budgeting in Excel.

ChartExpo logo

Turn Data into Visual
Stories

CHARTEXPO

  • Home
  • Gallery
  • Videos
  • Services
  • Pricing
  • Contact us
  • FAQs
  • Privacy policy
  • Terms of Service
  • Sitemap

TOOLS

  • ChartExpo for Google Sheets
  • ChartExpo for Microsoft Excel
  • Power BI Custom Visuals by ChartExpo
  • Word Cloud

CATEGORIES

  • Bar Charts
  • Circle Graphs
  • Column Charts
  • Combo Charts
  • Comparison Charts
  • Line Graphs
  • PPC Charts
  • Sentiment Analysis Charts
  • Survey Charts

TOP CHARTS

  • Sankey Diagram
  • Likert Scale Chart
  • Comparison Bar Chart
  • Pareto Chart
  • Funnel Chart
  • Gauge Chart
  • Radar Chart
  • Radial Bar Chart
  • Sunburst Chart
  • see more
  • Scatter Plot Chart
  • CSAT Survey Bar Chart
  • CSAT Survey Chart
  • Dot Plot Chart
  • Double Bar Graph
  • Matrix Chart
  • Multi Axis Line Chart
  • Overlapping Bar Chart
  • Control Chart
  • Slope Chart
  • Clustered Bar Chart
  • Clustered Column Chart
  • Box and Whisker Plot
  • Tornado Chart
  • Waterfall Chart
  • Word Cloud
  • see less

RESOURCES

  • Blog
  • Resources
  • YouTube
SIGN UP FOR UPDATES

We wouldn't dream of spamming you or selling your info.

© 2025 ChartExpo, all rights reserved.