Categories
How do you link sheets in Excel?
If you’re managing data across multiple sheets, connecting them can save time and reduce errors. Linking sheets help maintain accuracy, whether tracking budgets, sales, or project timelines. Businesses rely on real-time updates, especially when using a marketing analytics platform to track performance.


You can connect sheets using formulas like VLOOKUP, HLOOKUP, or INDEX-MATCH. Need numbers from another sheet? A simple reference pulls them in. Need automatic updates? Links refresh instantly—no need to dig through multiple files. Using chart elements in Excel helps visualize linked data effectively, providing clear insights.
So, how do you link sheets in Excel efficiently? It starts with understanding cell references. Whether linking within the same file or across workbooks, a few keystrokes create a connection. This reduces manual work and keeps everything updated.
Errors happen when data is inconsistent. Poor data management costs companies millions each year. Linking sheets prevent outdated or mismatched information. This well-structured business process mapping approach ensures data flows logically and stays accurate.
Finance, marketing, logistics—everyone depends on accurate data. Learning how to link sheets in Excel keeps reports organized and sharpens decision-making.
Minor improvements lead to significant productivity gains; let’s explore how to link sheets in Excel.
Definition: Linking sheets in Excel means connecting data from one sheet to another. It allows updates in one place to reflect everywhere. Instead of copying and pasting, you use formulas to pull data automatically. Standard functions include VLOOKUP, HLOOKUP, and INDEX-MATCH.
You can link sheets within the same workbook or across different files. Businesses use this to keep reports accurate and up to date. It saves time, reduces errors, and ensures consistency in calculations and analysis. Data modeling in Excel streamlines complex data relationships, providing clearer insights.
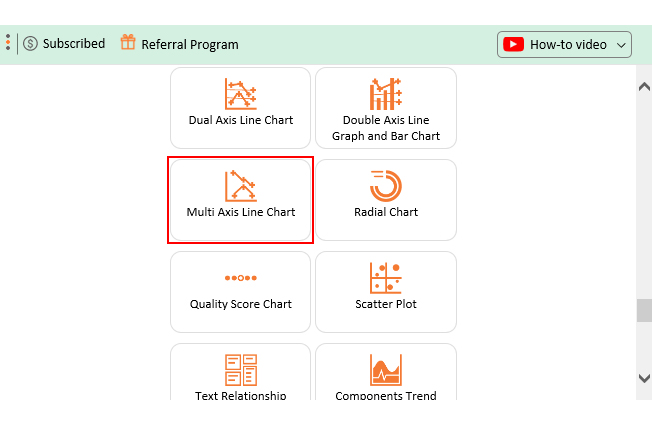
Step by Step Guide to Using a Multi-Axis Line Chart in Power BI for Linking Sheets and Comparing Trends
Step by Step Guide to Using a Multi-Axis Line Chart in Google Sheets for Linking Sheets and Comparing Trends
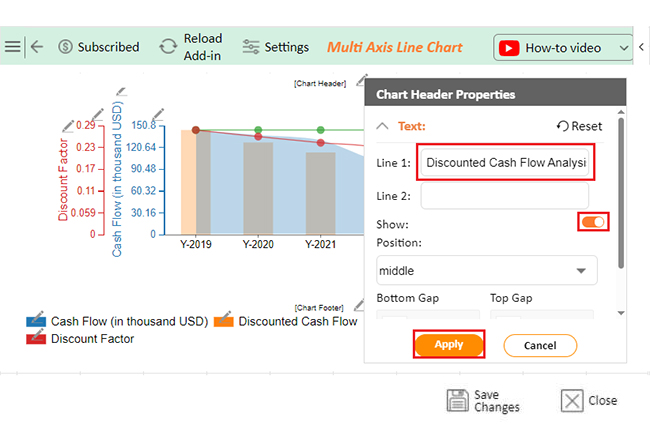
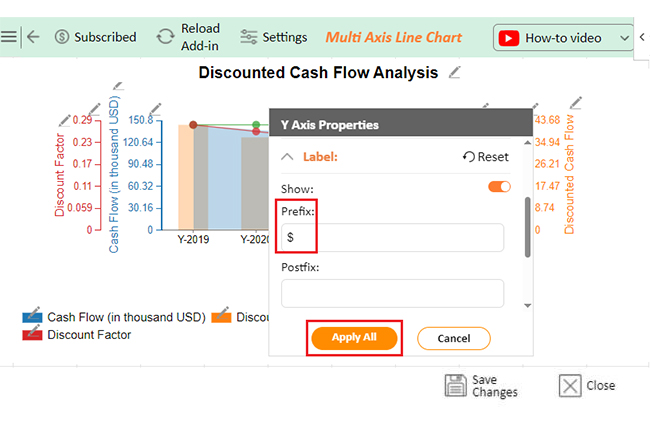
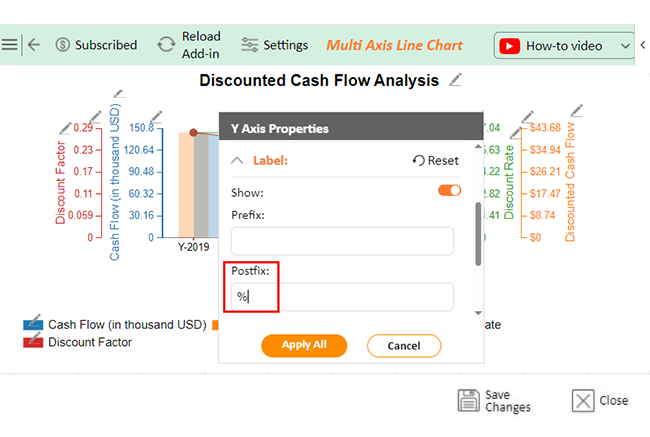
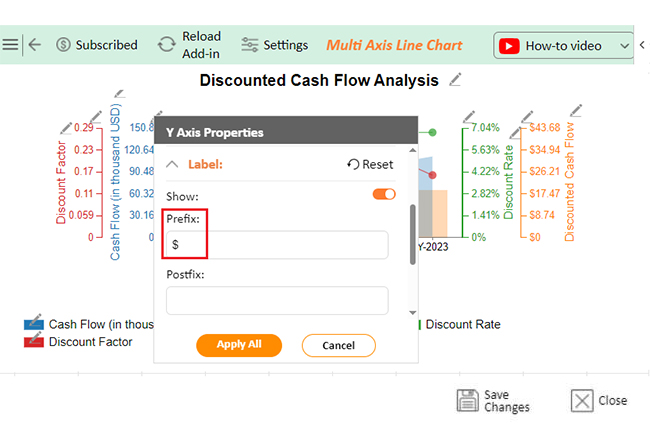
Step by Step Guide to Using a Multi-Axis Line Chart in Microsoft Excel for Linking Sheets and Comparing Trends
Are you manually updating data across multiple sheets? That’s a recipe for mistakes. One wrong number can throw off an entire report. Linking sheets in Excel solves this problem. It keeps everything accurate, saves time, and improves workflow.
Here’s why it matters:
Managing spreadsheets gets messy fast. Linking sheets keep data accurate and crucial for break-even analysis and profitability. Here’s when it makes the most sense:
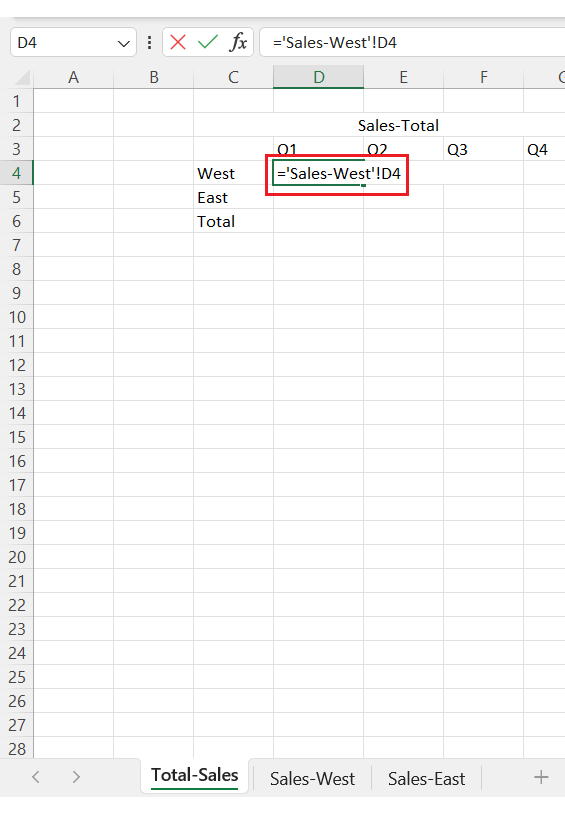
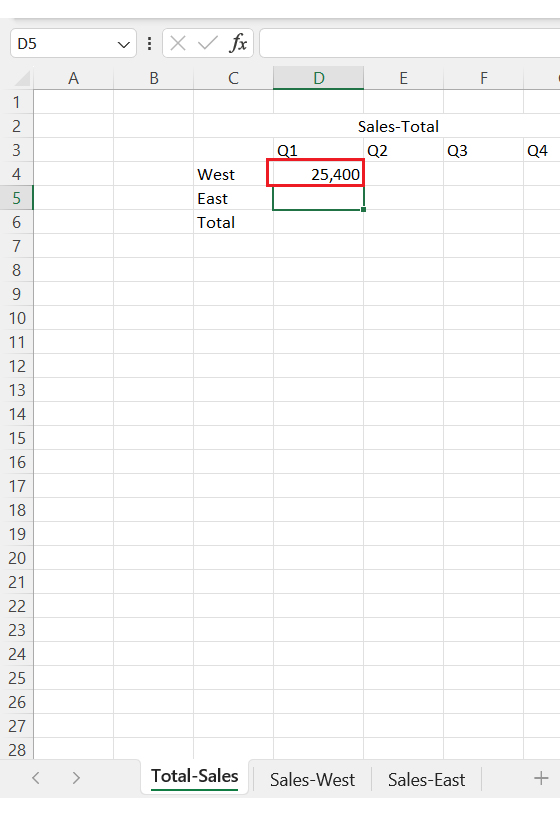
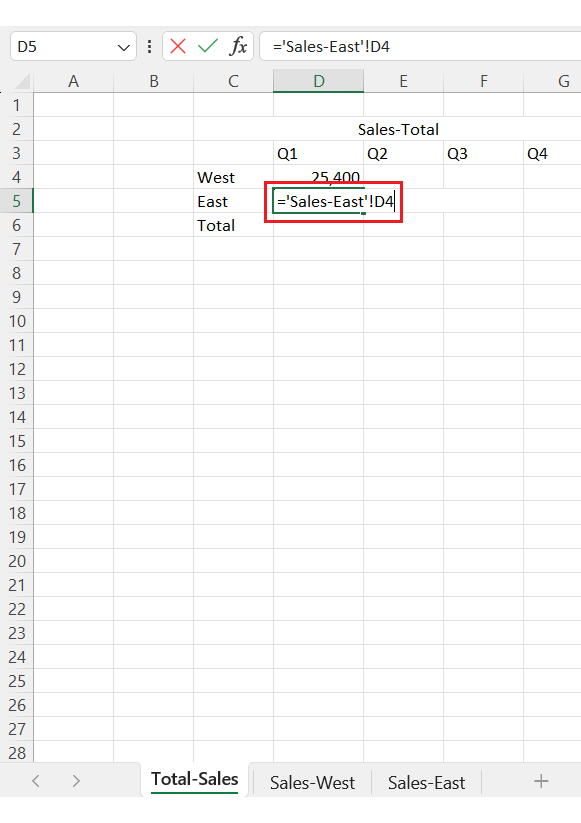
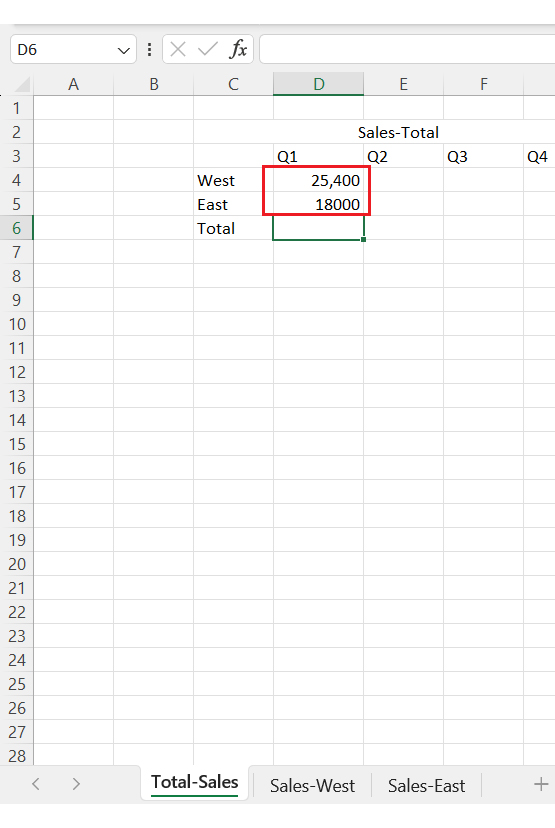
Have you ever wished your Excel sheets could talk to each other? Good news—they can. You can pull data from one sheet to another effortlessly by linking cells. This simplifies multivariate analysis to help you uncover patterns in complex datasets.
Here’s how to do it in just a few steps:
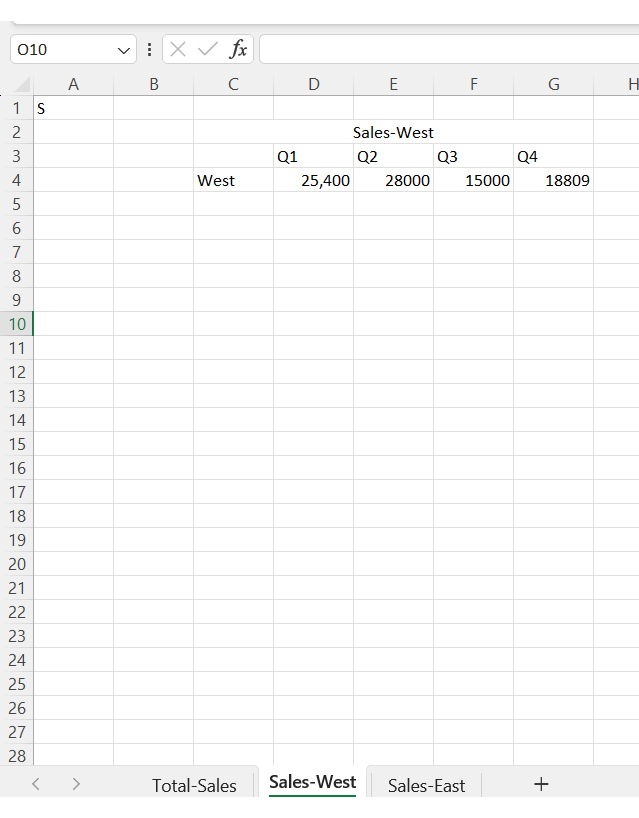
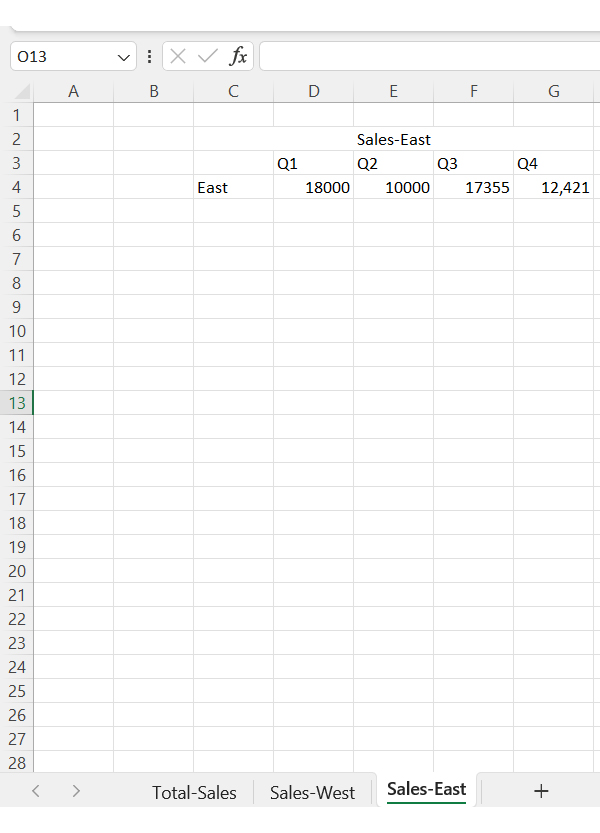
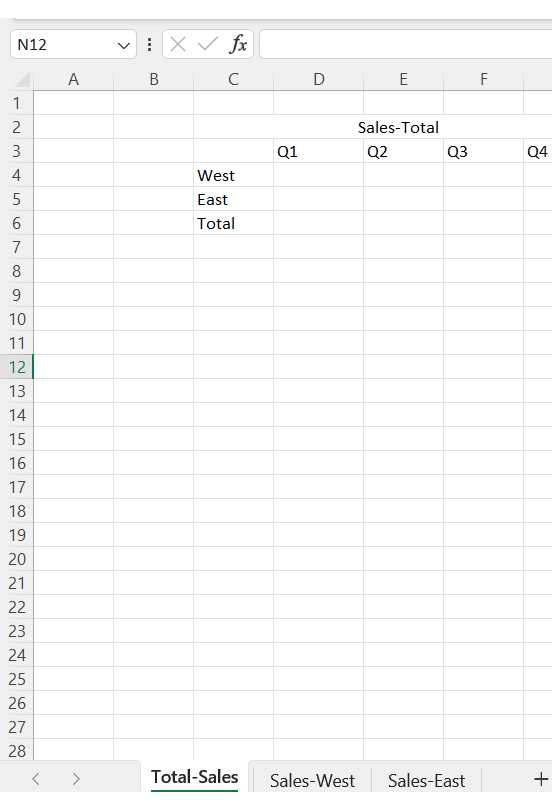
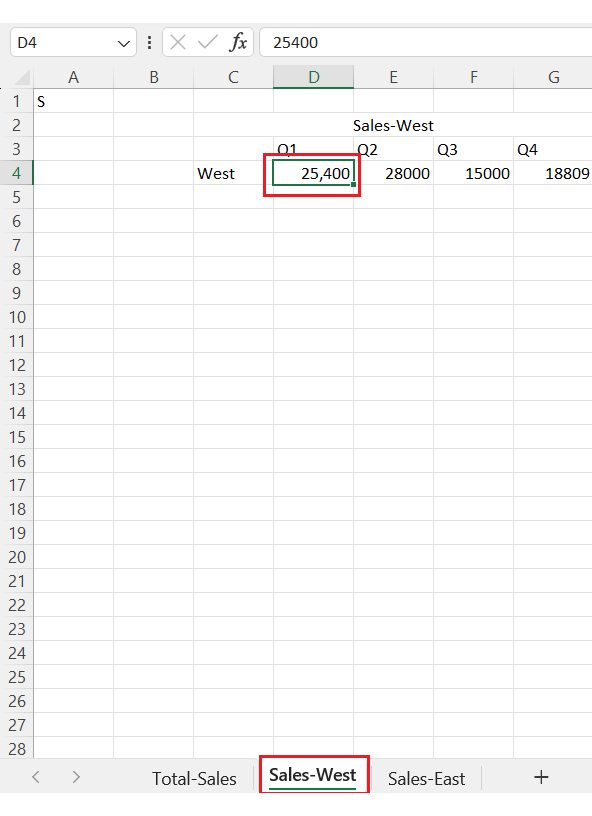
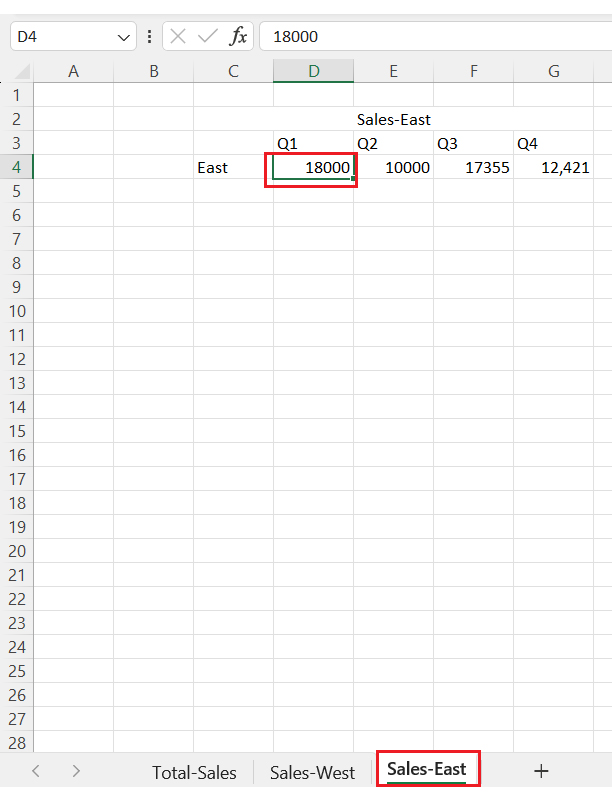
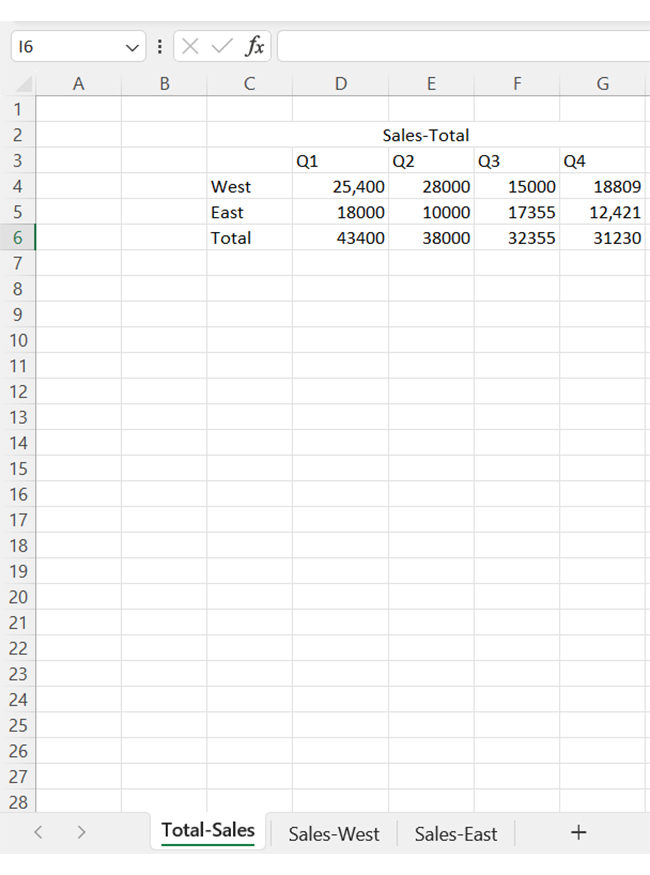
Managing multiple sales sheets is time-consuming and error-prone. Linking sheets in Excel automates updates. This helps make data transformation in Excel a breeze, keeping related data clean and organized for analysis. Let’s walk through how to do this step by step.
Excel is great for organizing data, but linking sheets can be tricky. When analyzing data, you need clear insights, not just numbers. That’s where data visualization comes in—it turns raw data into meaningful visuals. Visual analytics goes a step further, enabling a more profound exploration of your data.
Unfortunately, Excel’s charts are essential and often lack flexibility. This makes spotting trends and making decisions harder than they should be.
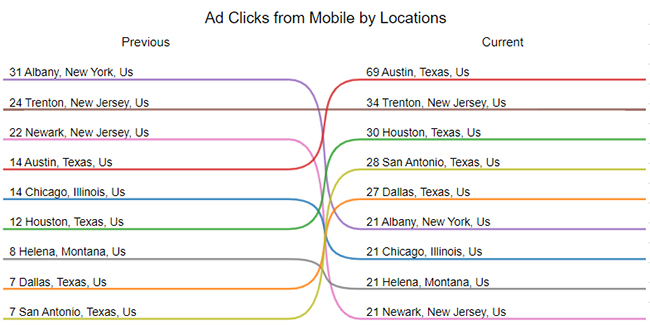
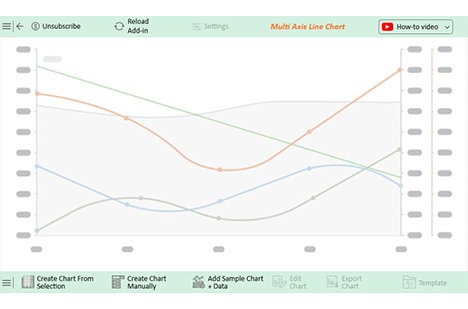
Enter ChartExpo. This powerful tool takes Excel’s visualization game to the next level by helping you create insightful charts with ease. Pair it with Gestalt principles, and even a Scatter plot chart becomes easier to structure and interpret, making patterns clearer and reducing errors.
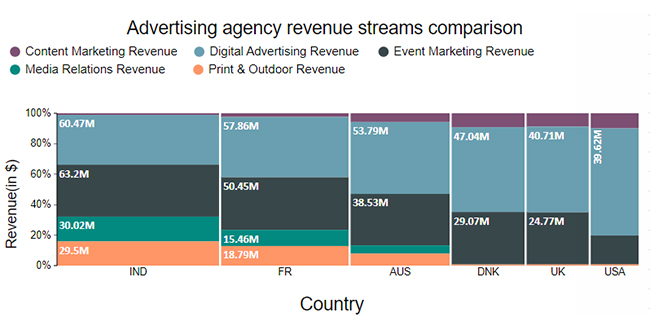
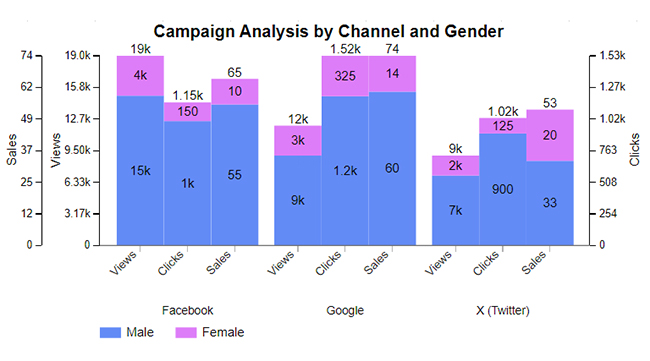
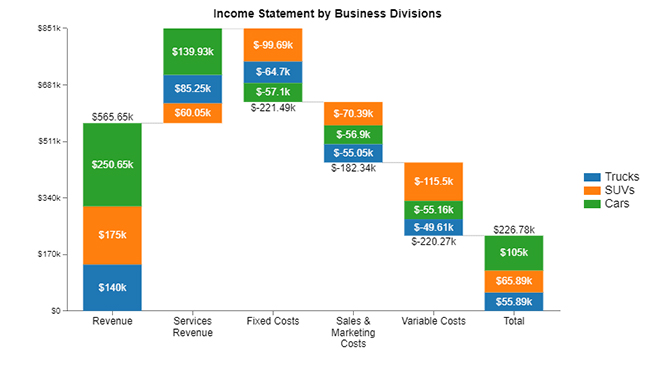
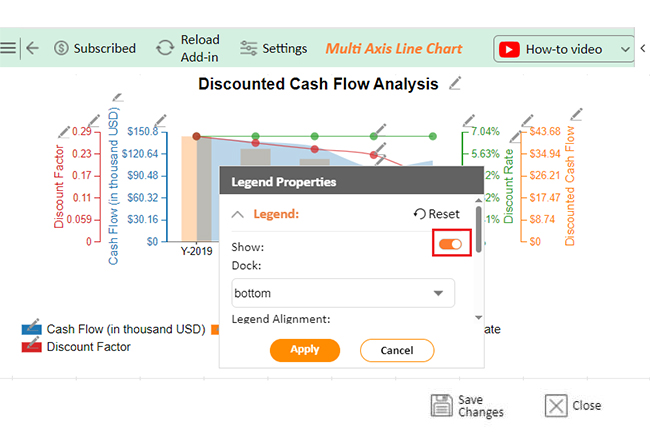
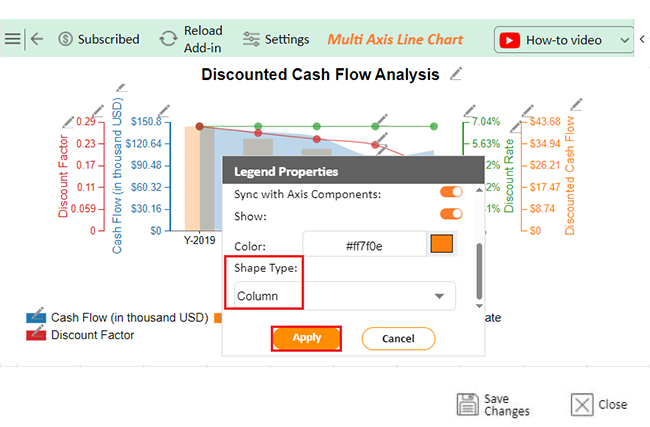
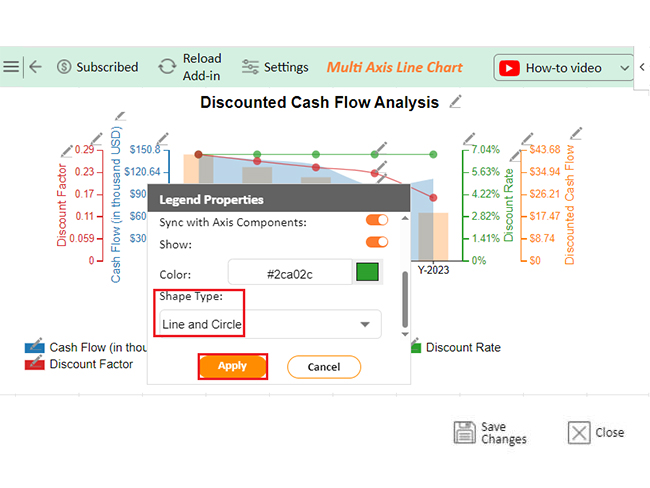
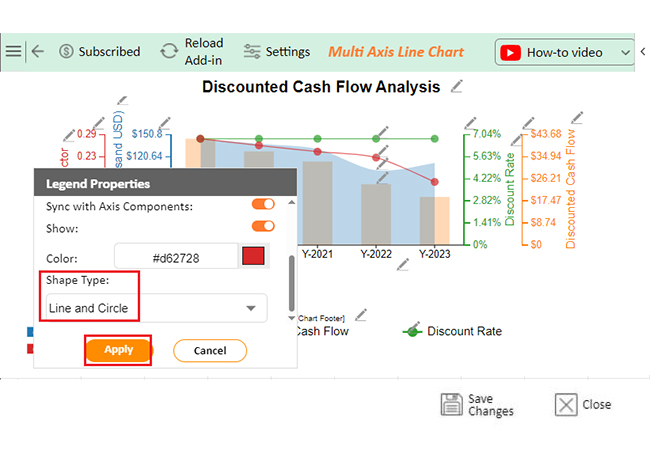
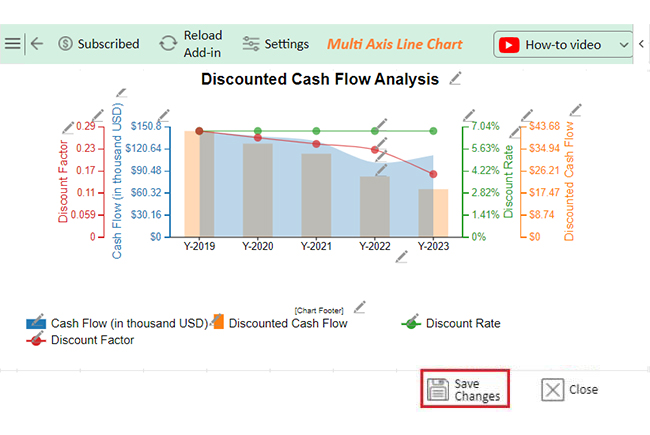
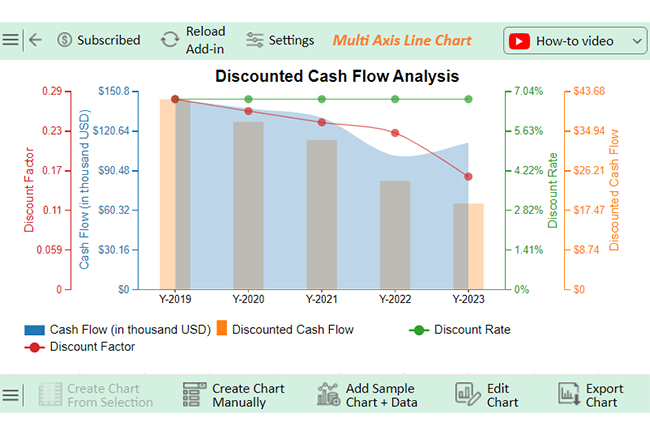
The charts below, including a Waterfall chart, were created using ChartExpo:
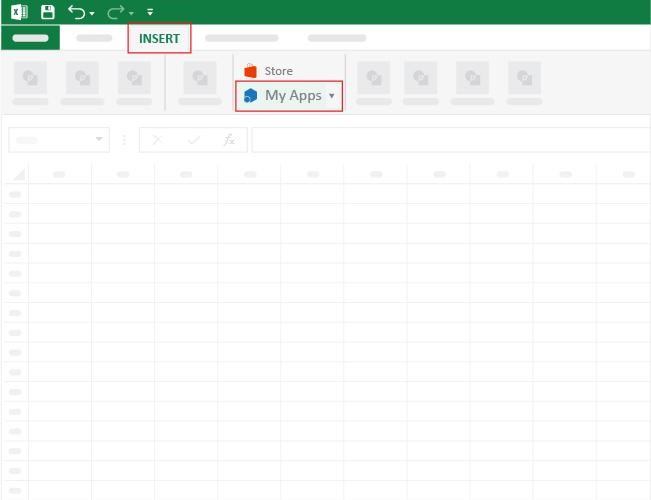
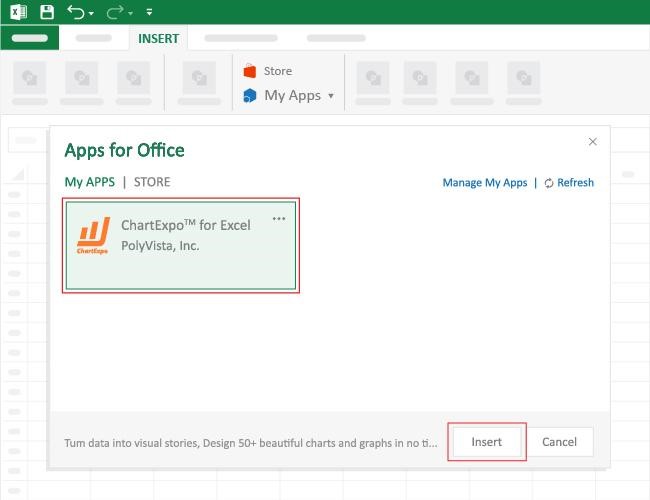
How to Install ChartExpo in Excel?
ChartExpo charts are available both in Google Sheets and Microsoft Excel. Please use the following CTAs to install the tool of your choice and create beautiful visualizations with a few clicks in your favorite tool.
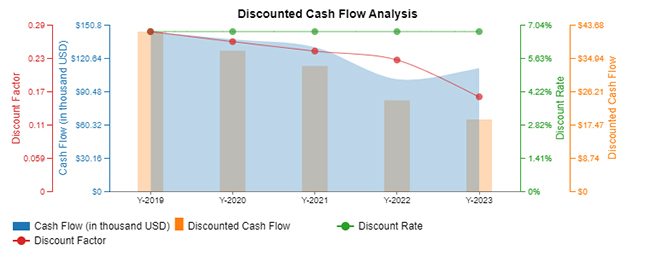
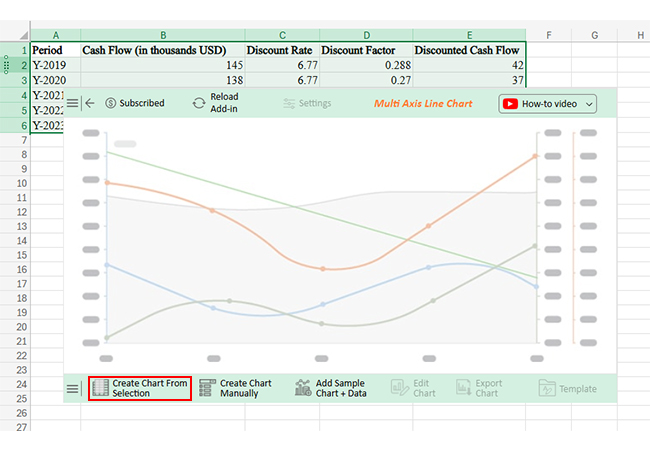
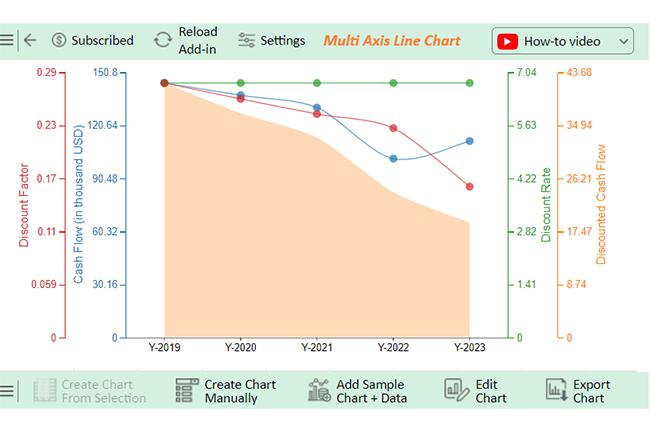
Let’s analyze this sample data and learn how to clean data in Excel using ChartExpo.
| Period | Cash Flow (in thousands USD) | Discount Rate | Discount Factor | Discounted Cash Flow |
| Y-2019 | 145 | 6.77 | 0.288 | 42 |
| Y-2020 | 138 | 6.77 | 0.27 | 37 |
| Y-2021 | 131 | 6.77 | 0.253 | 33 |
| Y-2022 | 102 | 6.77 | 0.237 | 24 |
| Y-2023 | 112 | 6.77 | 0.171 | 19 |
Manually updating spreadsheets leads to errors, wasted time, and outdated reports. Linking sheets in Excel keeps everything connected, accurate, and automated. Moreover, calculating variance in Excel helps you track data fluctuations and maintain accuracy in your analysis.
Here’s why it makes a difference:
Linking sheets in Excel sounds like a smart move—until it starts causing trouble. While it helps keep data connected, it also brings risks that can slow you down.
Linking sheets in Excel makes data management effortless. It keeps information accurate and reduces manual work. Whether for business reports or personal tracking, it improves efficiency. Using linked sheets also helps when analyzing and interpreting data, ensuring insights are based on real-time information.
By connecting sheets, data stays consistent. Updates in one place reflect everywhere, preventing errors and outdated information. It also helps eliminate duplicates in Excel, reduce clutter, and maintain clean datasets.
Formulas like VLOOKUP, HLOOKUP, and INDEX-MATCH simplify the process. They pull data automatically, saving time—no more copying and pasting.
Linked sheets also improve reporting. Reports stay updated without extra effort, making analysis faster and more reliable. Well-structured connections contribute to the best-designed dashboards, presenting clear and actionable insights.
Collaboration becomes smoother when sheets are connected. Teams access the latest data instantly, and there are no version conflicts or confusion.
Mastering how-to link sheets in Excel boosts productivity, streamlines workflow, and enhances accuracy.
Do not hesitate.
Start using link sheets in Excel and install ChartExpo to create better visualizations and revolutionize data analysis.
How much did you enjoy this article?


Learn how to use sparklines in Excel to quickly visualize trends inside cells. Discover types, creation steps, customization, use cases, benefits, and best practices.

Learn what a confidence interval graph is, how to create it in Excel, and how to interpret results to make more reliable, data-driven decisions.

A correlation matrix in Excel helps identify relationships between variables. Learn how to create, read, and use it for effective data analysis.


